ROIC, or Return on Invested Capital, is a profitability ratio that gauges how well a company generates earnings from its invested capital. It's an essential indicator because it provides insight into two critical areas:
Operational Efficiency: ROIC tells us how good a company is at turning capital into profits. High ROIC values indicate that a company is using its invested funds effectively to generate earnings, reflecting strong operational performance.
Value Creation: ROIC is crucial for investors because it shows whether a company is creating value. When ROIC exceeds the company's cost of capital, it indicates that the firm is generating more profit than it costs to fund its operations and growth, which typically leads to value creation for shareholders.
ROIC is important as it evaluates the performance of a company’s management in deploying capital and helps in comparing the efficiency of companies across industries, regardless of their financial structures.
The ROIC calculation is detailed at the end of the article
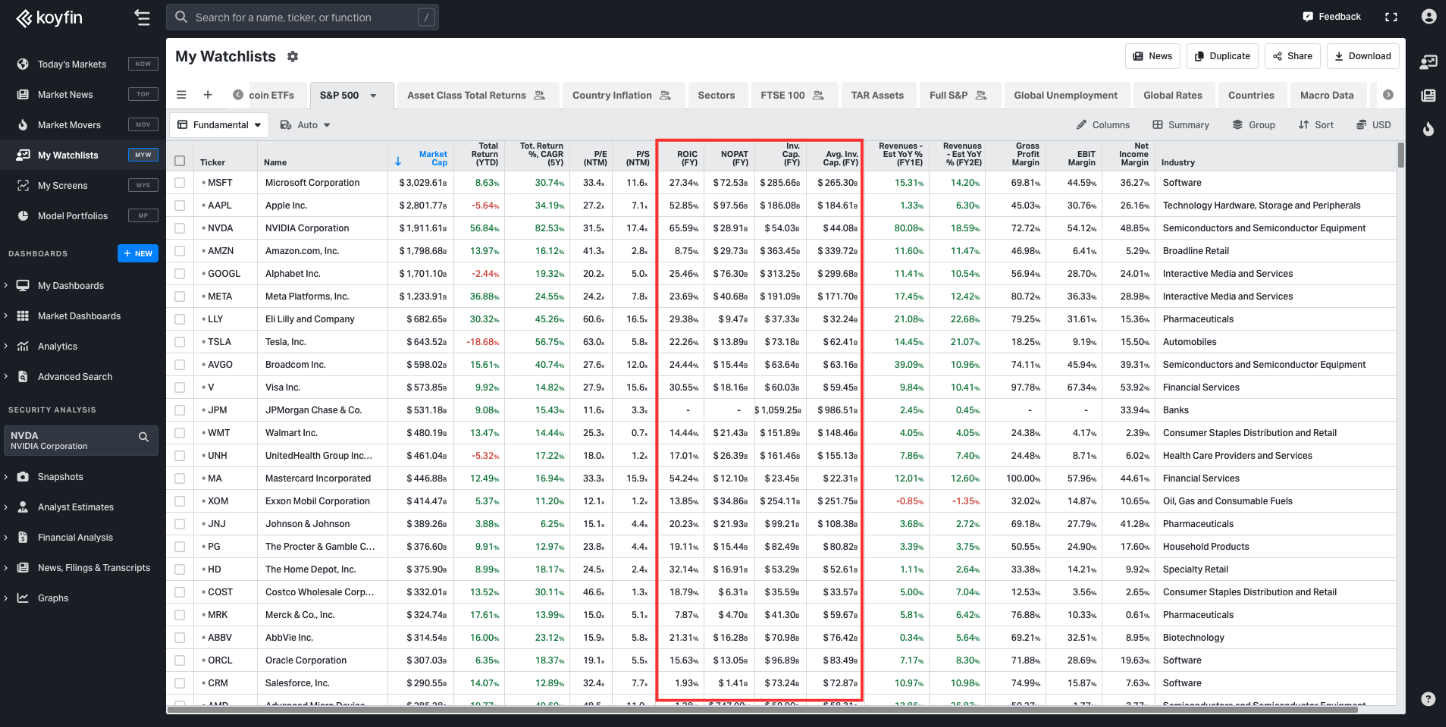
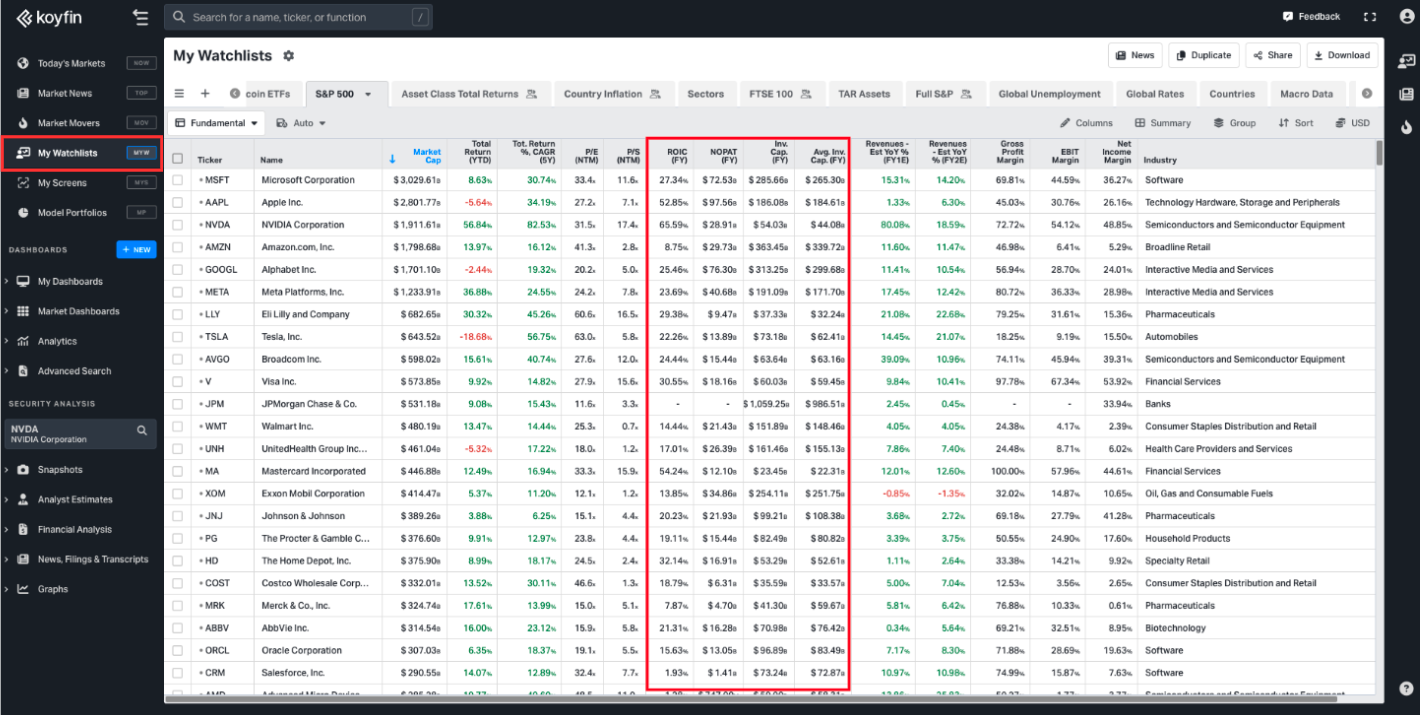
My Watchlists
You can select ROIC as a column in your watchlist, or the underlying components used to calculate ROIC, NOPAT, Invested Capital, and Average Invested Capital.. The data can be presented on a FY or LTM basis.
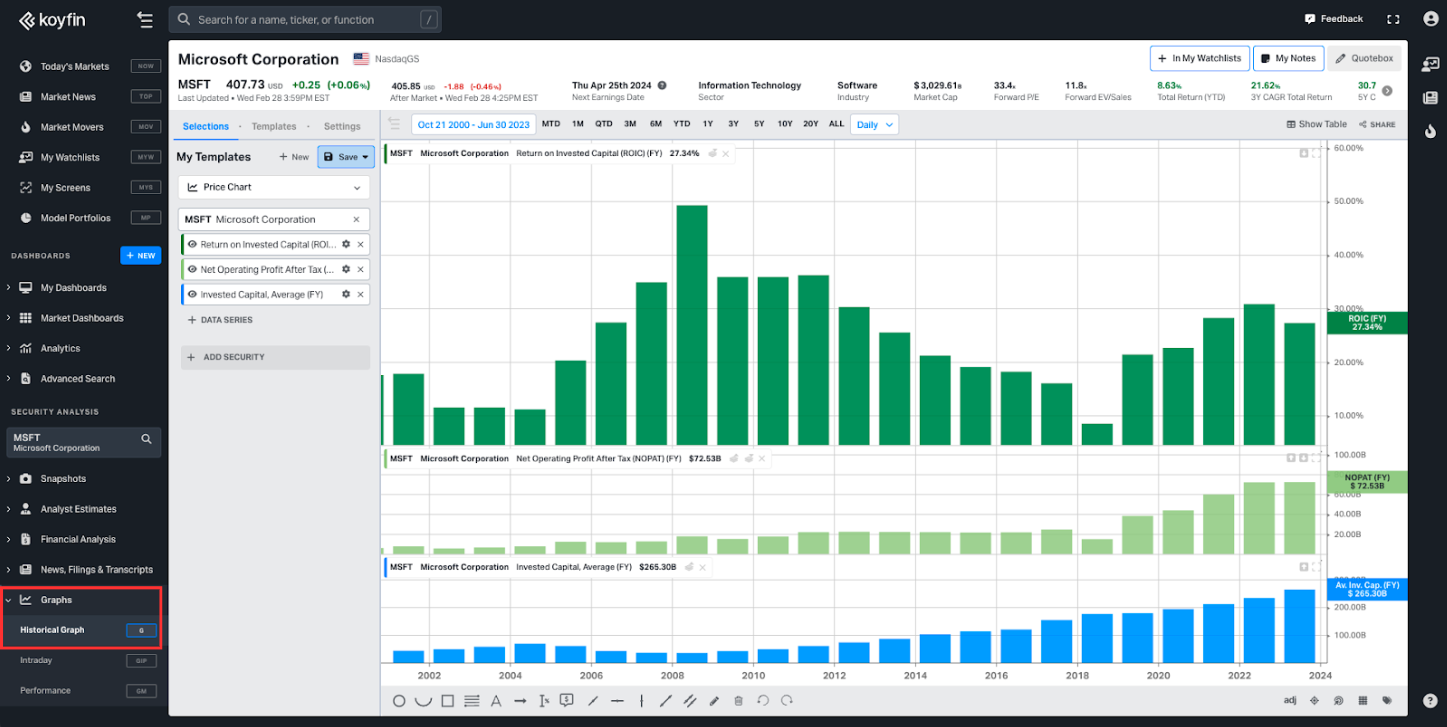
Charts
The Historical Graph (G) will allow you to illustrate a time series of ROIC, NOPAT, and Invested Capital on an FY or LTM basis.
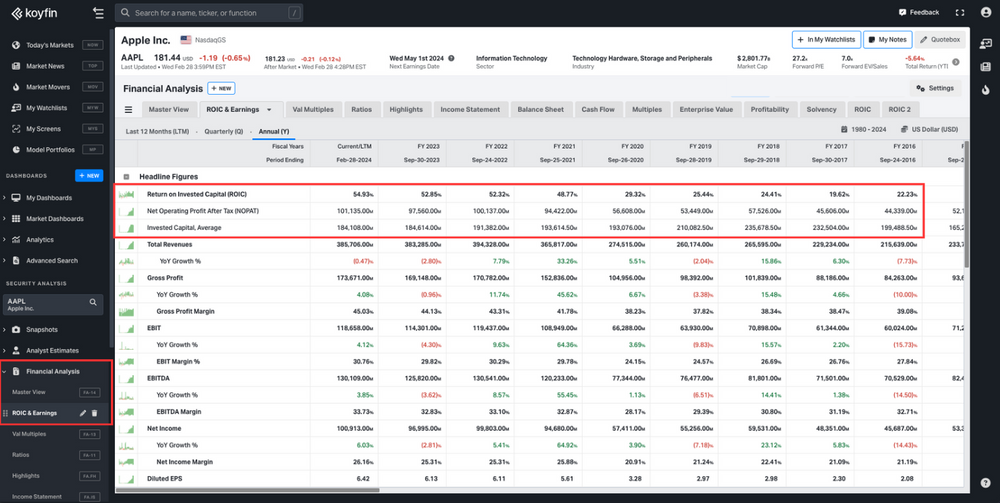
Financial Analysis
The Financial Analysis section will allow you to create FA templates that include a time series breakdown of ROIC, NOPAT, and Invested Capital on a FY and LTM basis.
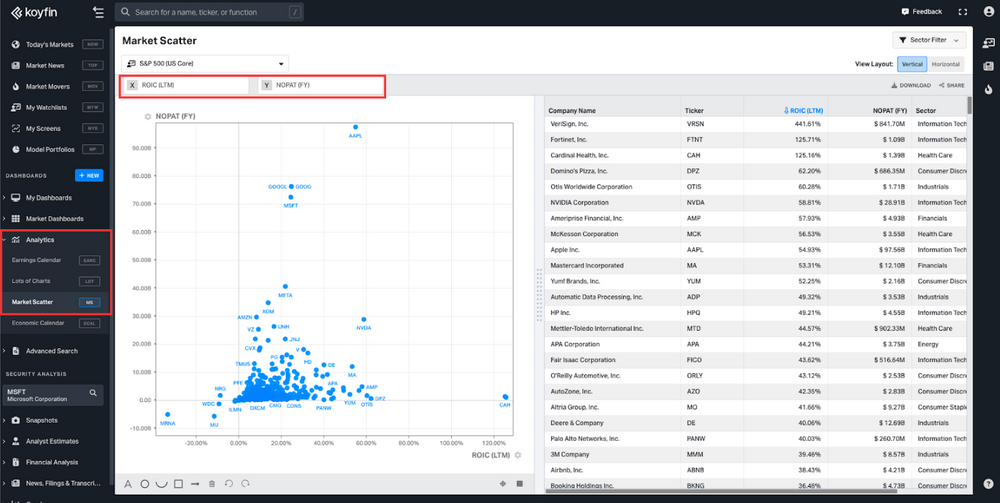
Market Scatter
The market scatter chart will allow you to express the relationship between any two data series (in this case, ROIC and NOPAT) using the constituents of an index, ETF, or watchlist as the population sample.
Calculation
It’s important to note that ROIC has no single source of truth concerning the calculation methodology. The “standard” calculation of ROIC varies, and we chose our method because it focuses on operating profit generated from invested capital.
The methodology Koyfin uses is as follows:
ROIC = NOPAT / Average Invested Capital
Where;
• NOPAT = EBIT less income tax expense.
• Invested Capital = (Long-term debt + short-term debt + shareholder equity + current leases + long-term leases)
• Average Invested Capital = (Invested Capital Y0 + Invested Capital Y-1) / 2
For example, to calculate the ROIC for MSFT in the year 2023, the components are as follows:
- EBIT: $101.49 billion
- Income Tax Expense: $18.67 billion
- Long Term Debt: $44.93 billion
- Short Term Debt: $29.29 billion
- Shareholder Equity: $238.27 billion
- Current Lease: $4.48 billion
- Long-Term Lease: $32.66 billion
NOPAT = $101.49 billion less $18.67 billion = $$82.82 billion
Invested Capital = $44.93 billion + $29.29 billion + $238.27 billion + $4.48 billion + $32.66 billion = $349.63 billion
Microsoft Invested Capital in 2022 was $285.66 billion using the same formula.
Average Invested Capital = ($349.63 billion + $285.66 billion) / 2 = $317.64 billion
ROIC = $82.82 billion / $317.64 billion = 26.07%
Considerations
Some considerations to be aware of; both for our method of ROIC calculation and the concept of ROIC as a whole.
- Non-Operating Assets: The formula doesn't account for non-operating assets, which may not contribute to the core operations of the business but still consume capital.
- Quality of Earnings: NOPAT is based on EBIT less income tax expense. This assumes that the reported EBIT is a true reflection of the company's operational performance, which may not always be the case due to accounting policies and practices that can vary from one firm to another.
- Capital Intensity: Different industries have varying capital requirements. This formula does not differentiate between capital-intensive and non-capital-intensive businesses, which can lead to misleading comparisons across industries.
- Average Invested Capital: Using an average can smooth out fluctuations, but it can also obscure recent capital investments or divestments. This is particularly relevant for fast-growing companies or those in the midst of significant restructuring.
- Leases: The inclusion of leases in the calculation of invested capital reflects a company's long-term obligations, which is useful following the recent accounting changes that require leases to be on the balance sheet. However, it can make comparisons with historical data more challenging.
- Tax Effects: NOPAT is calculated after tax, which means that changes in tax laws or the company’s tax strategies can affect the ROIC, potentially making it less comparable across different tax jurisdictions or over time.
- Intangible Assets: The formula may not fully capture the value of intangible assets like brand value or intellectual property unless they are reflected on the balance sheet, which can understate the true ROIC for companies that are heavily reliant on intangible assets.
- Time Horizon: The formula uses a simple average of invested capital, which may not adequately reflect the timing of capital expenditures and their corresponding returns.