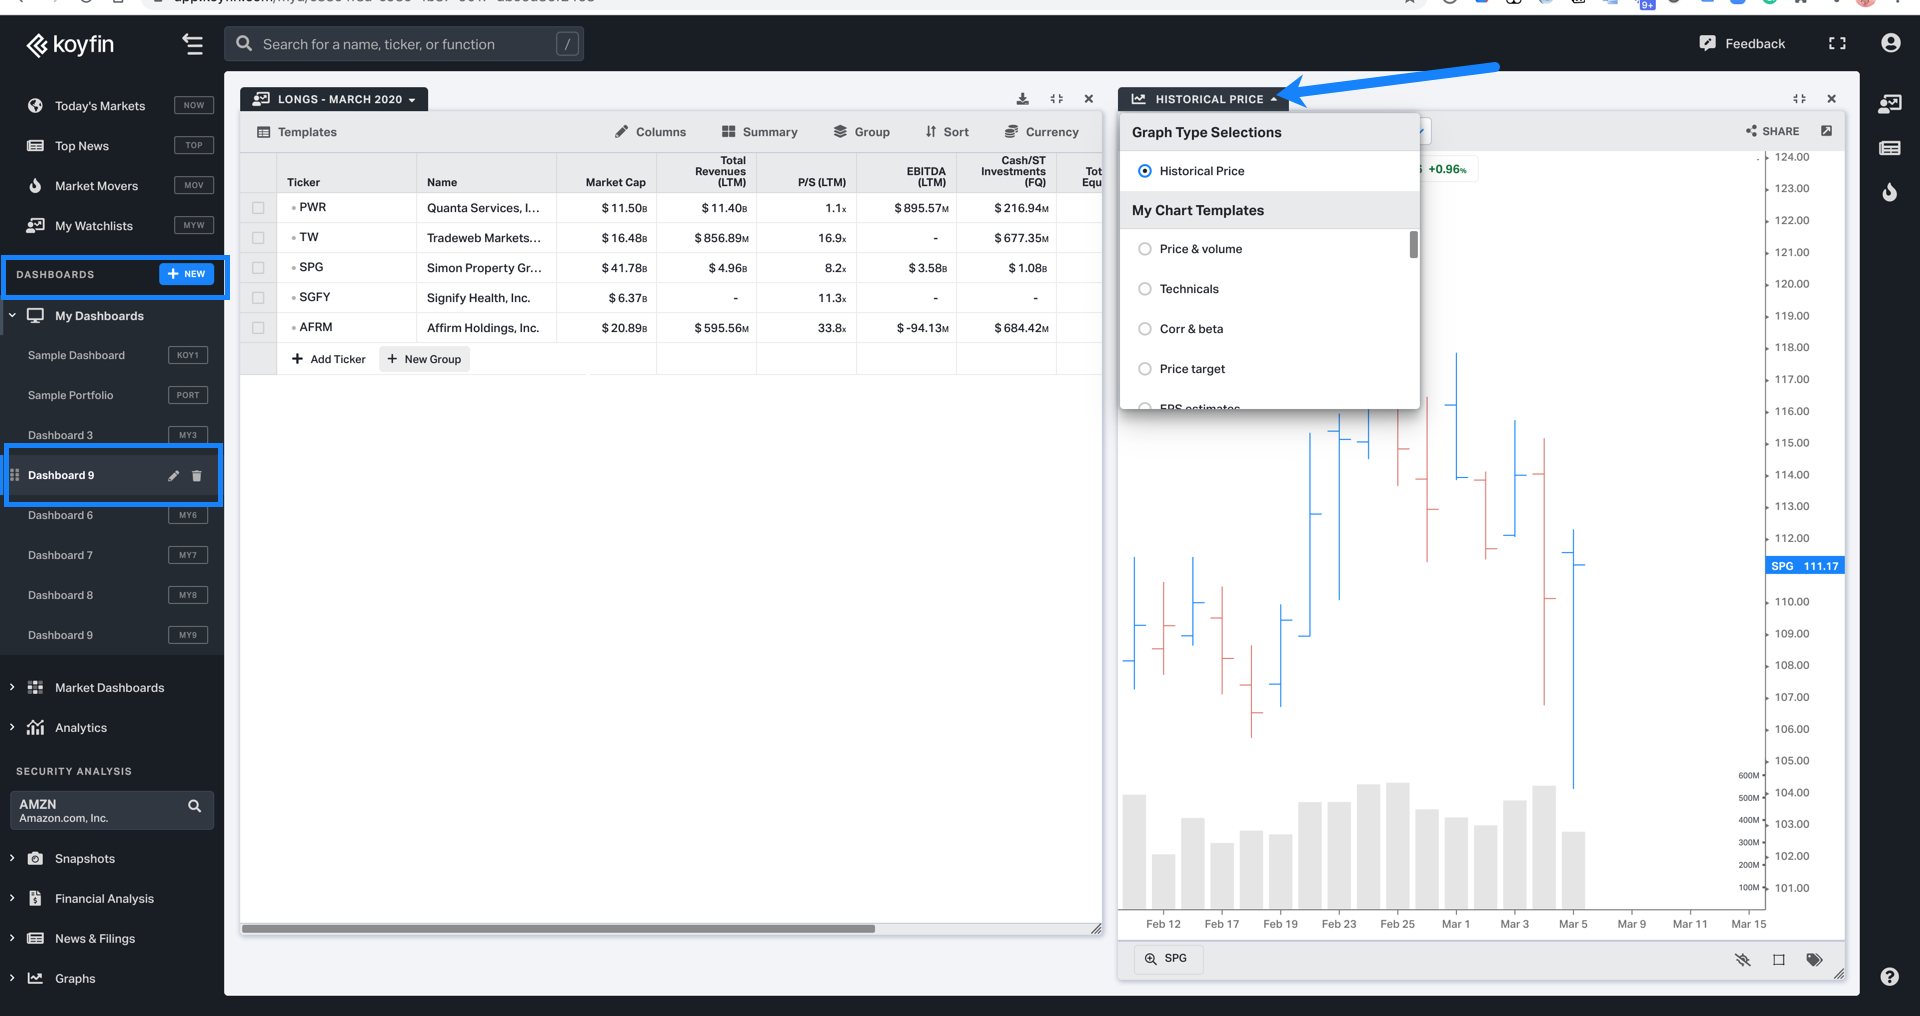
Koyfin offers advanced charting functionality to visualize financial trends. The Historical Graph (G) chart is the most flexible way to create a chart on Koyfin. You can graph any financial series on Koyfin, create chart templates or view data as a table. The chart function has several components.
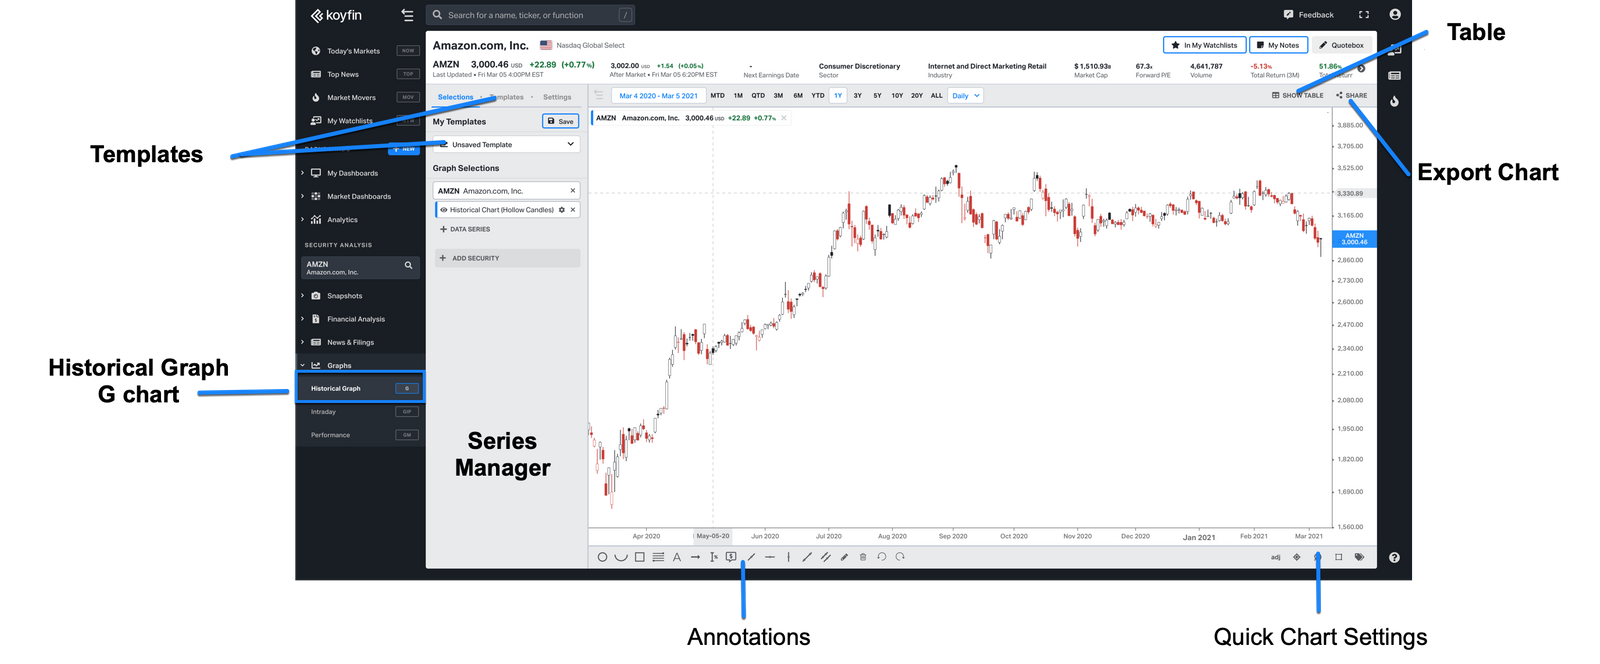
- The Series Manager allows you to add/delete data series for a ticker, or add additional tickers to the chart. Examples of data series are price, moving average, P/E or 300 other fundamental series on Koyfin. The Series Manager also allows you to format a series like changing the line color. Or change the series calculation such as specifying a 150-day window for moving average or changing the correlation window.
- Templates allow you to create a chart with custom settings, and save the chart setting for future use.
- The Show Table function allows you to view the data.
- Annotations allow you to draw on the chart.
Series Manager
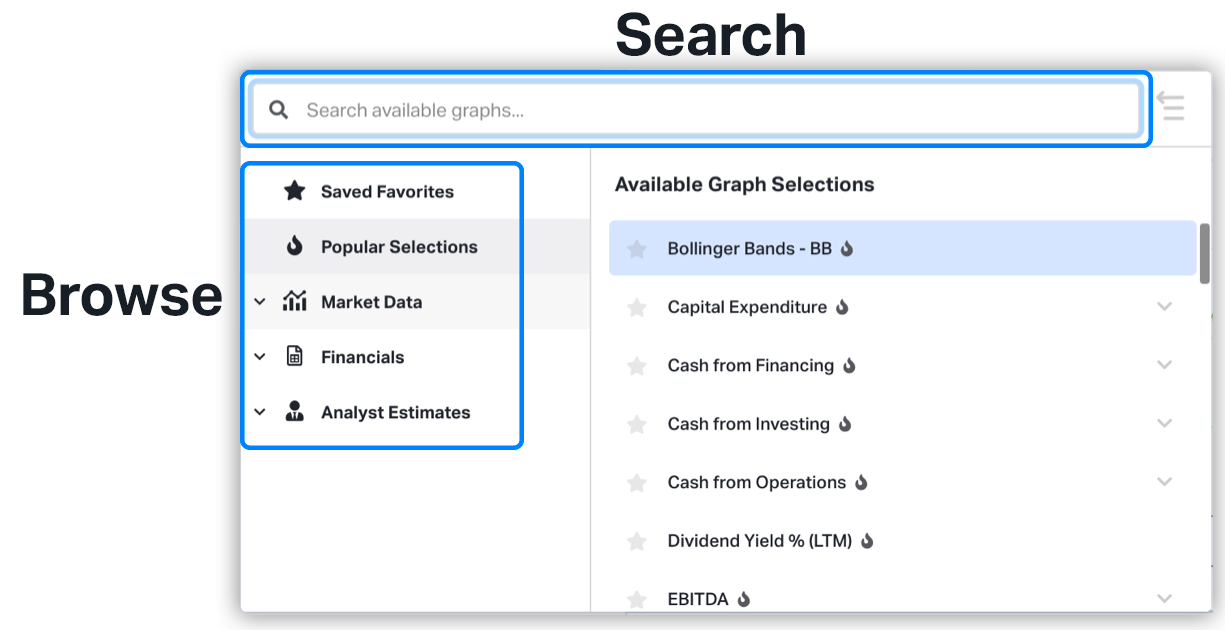
The series manager is the control center to make changes to the chart. The series manager contains Tickers or Securities subsection of data series for that security. Click on the + Add Security button to add additional tickers. Click on the +Add Metric to add a data series to the chart like historical price, moving average, P/E, short interest %, market cap, or any other valuation or fundamental series.
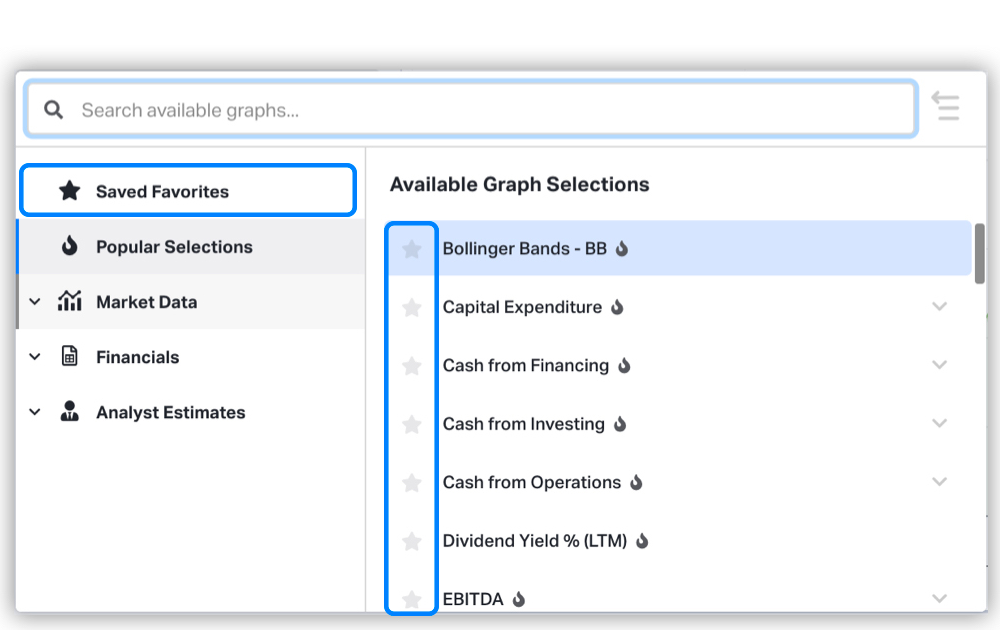
The + Add Metric menu contains all the data or fields available for a specific security. You can browse through the different categories, or search for a specific field.
The Favorites button allows you to save series to your Saved Favorite folder.
The data series are specific to the type of security. An ETF security like SPY will have data fields such as Fund Flows that an equity security will not have.
When you add a 2nd security, all the data fields are copied into the 2nd security. For example, if you have a graph with AAPL price and market cap and add FB, then FB will also have a price and market cap series.
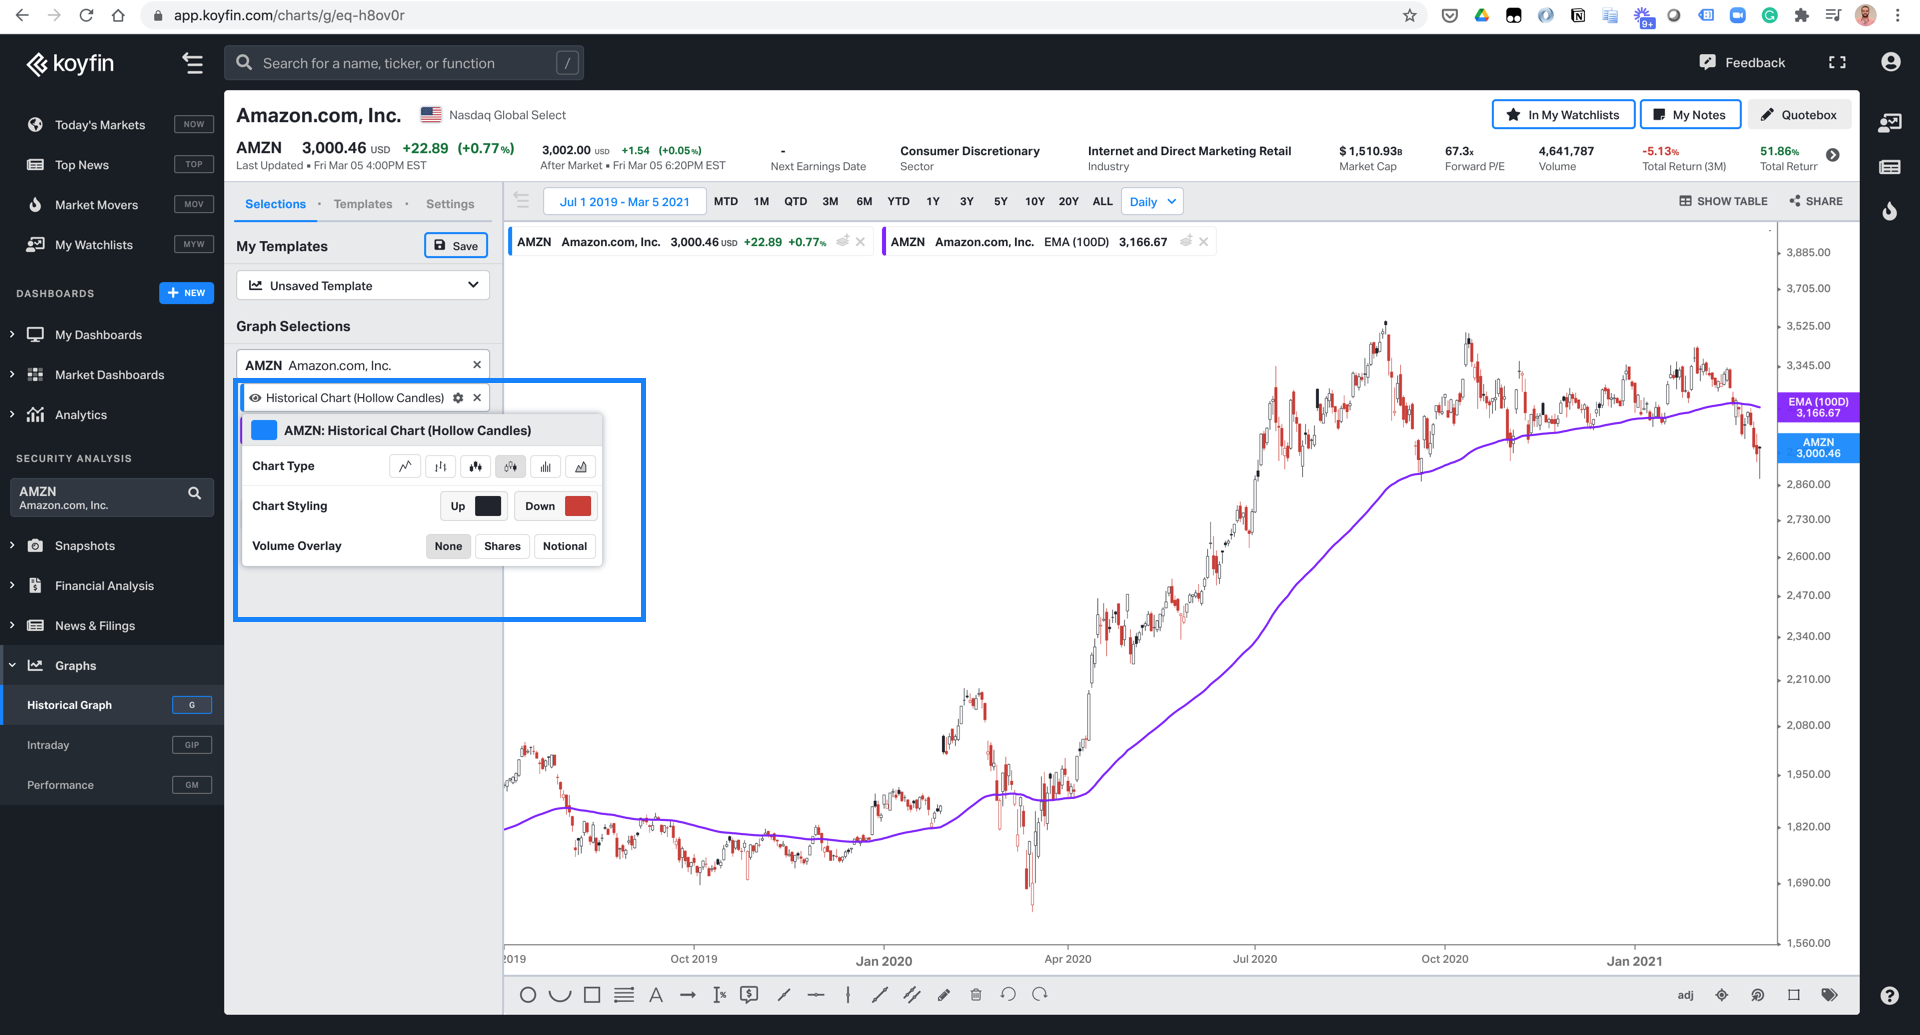
The data series tile contains the settings for the data series. For example, in the Historical Price Graph, you can click on the tile and choose what price graph to display like Line, Candles, OHLC Barchart or Area.
At this time, we don't currently support minute or hourly candles. The shortest period we support is days.
You can also add a volume overlay to display the number of shares or notional volume in the stock's currency.
Using Moving Average settings as another example, you can change the calculation window by clicking on the Moving Average tile in the series manager. Additionally you can change the colour of the line, or change the line format from solid to dotted line.
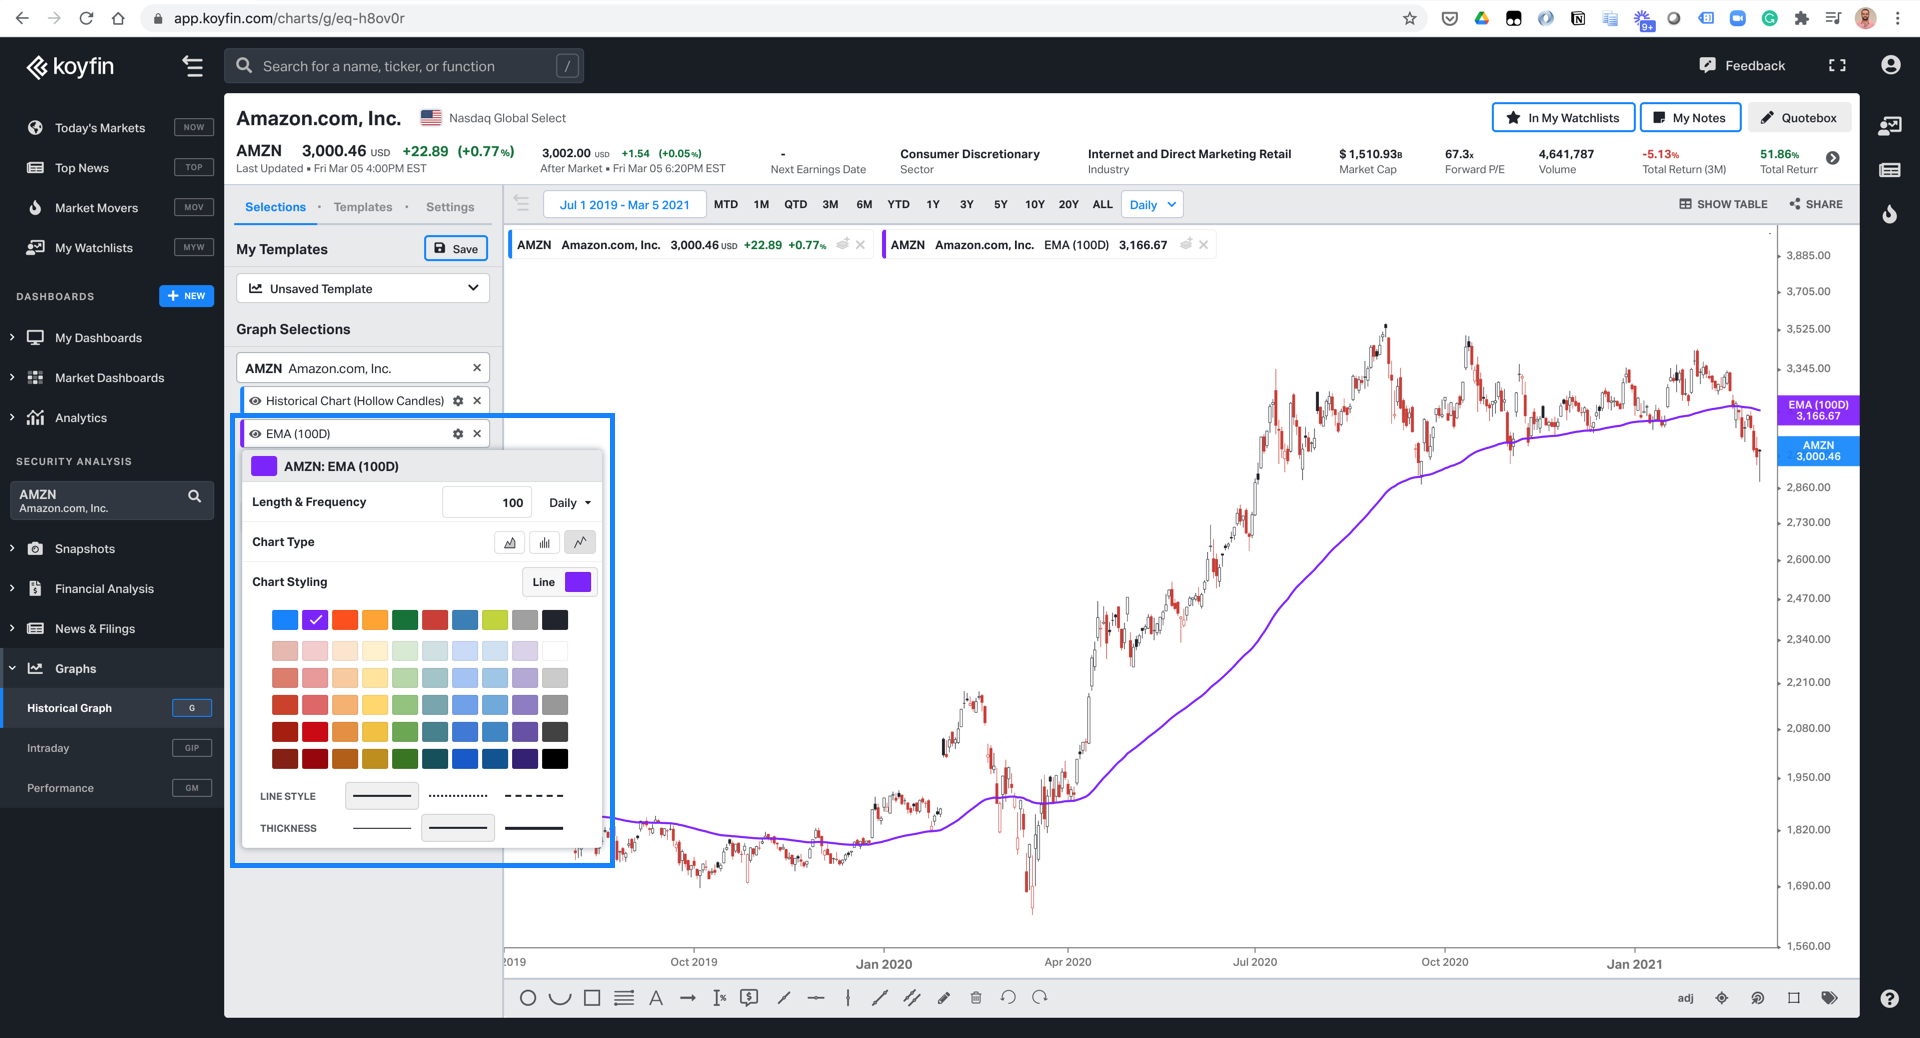
The eye icon on the left of the series tile allows you to hide the series from the graph.
Core charting functionality
After adding all the series to the chart, there are several important chart functions to mention.
You can change the dates displayed by selecting the start and end dates on top of the chart. You can also scroll with your mouse to zoom in or zoom out. When zooming in/out, the end date remains static while the start date changes.
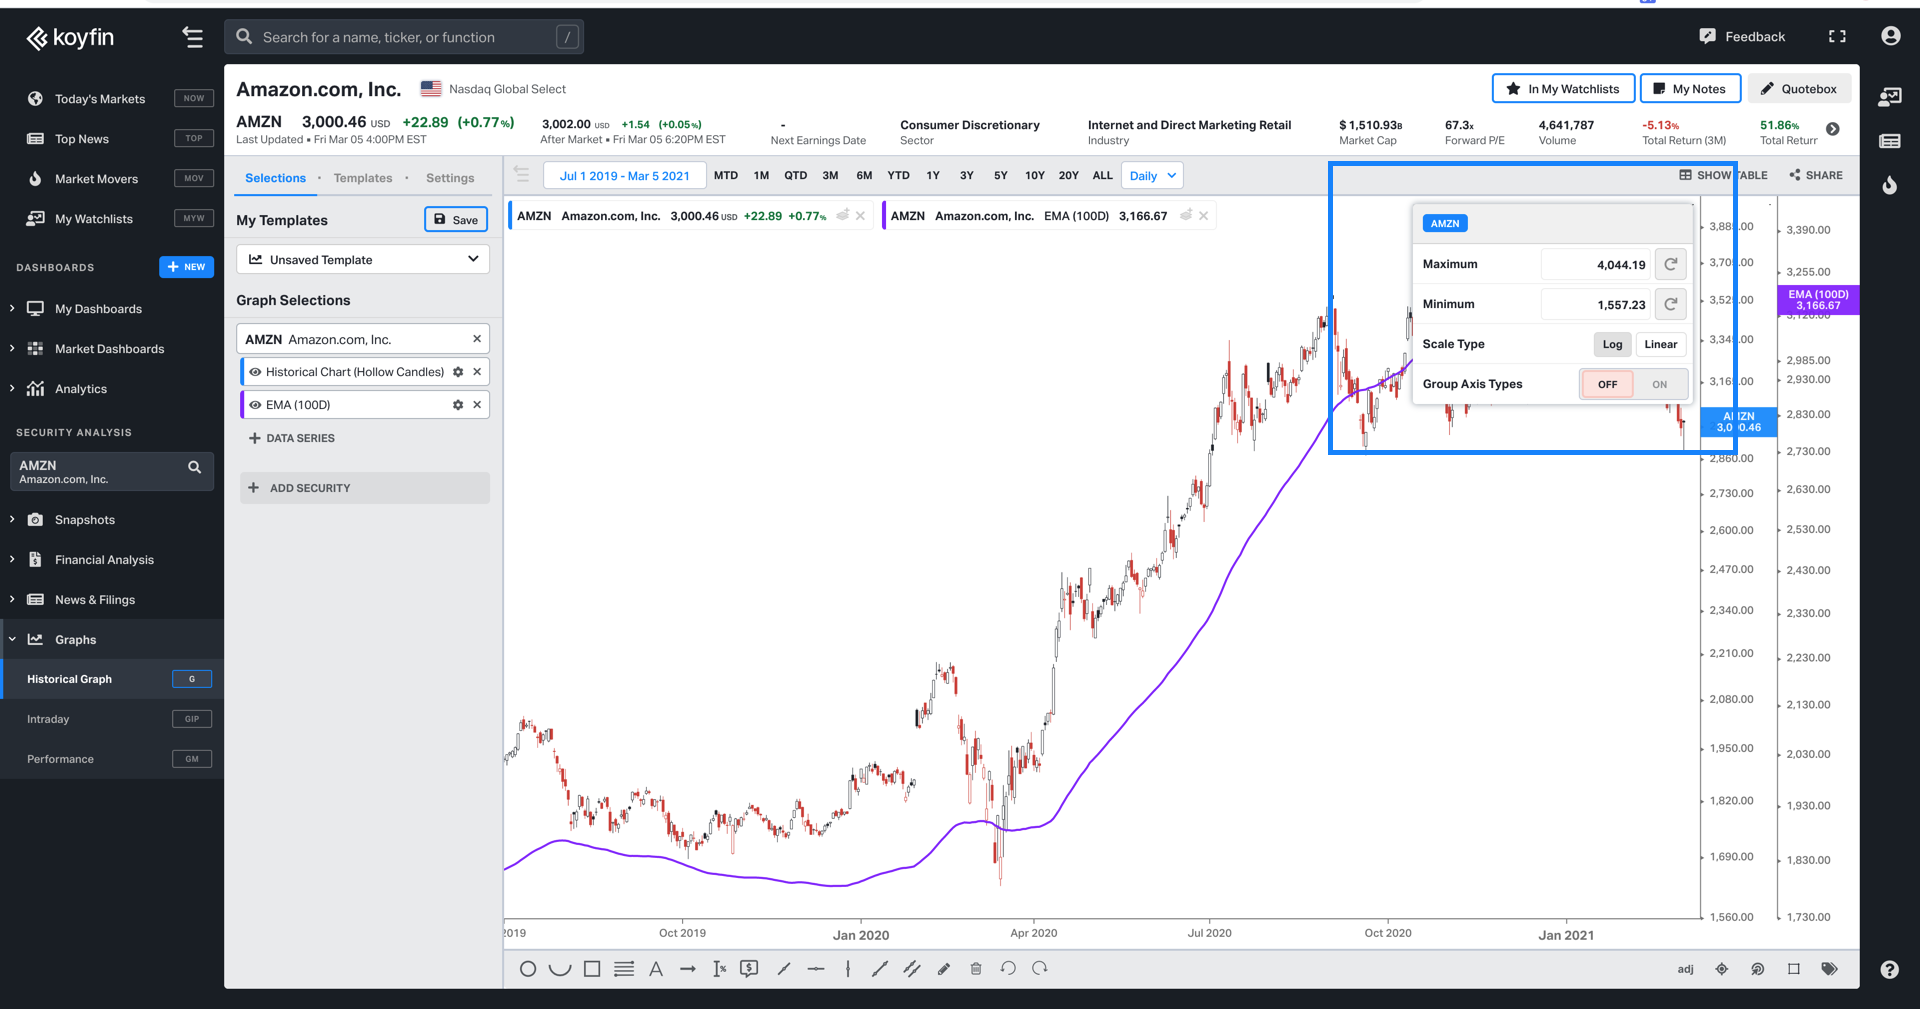
Right-click on the y-axis to access the y-axis menu. The y-axis menu allows you to customize the settings of the y-axis such as series grouping, log/linear and max/min.
Group Axis OFF creates a separate y-axis for each data series.
Group Axis ON will create one y-axis for series which have the same units, such as valuation multiples, and Market Caps.
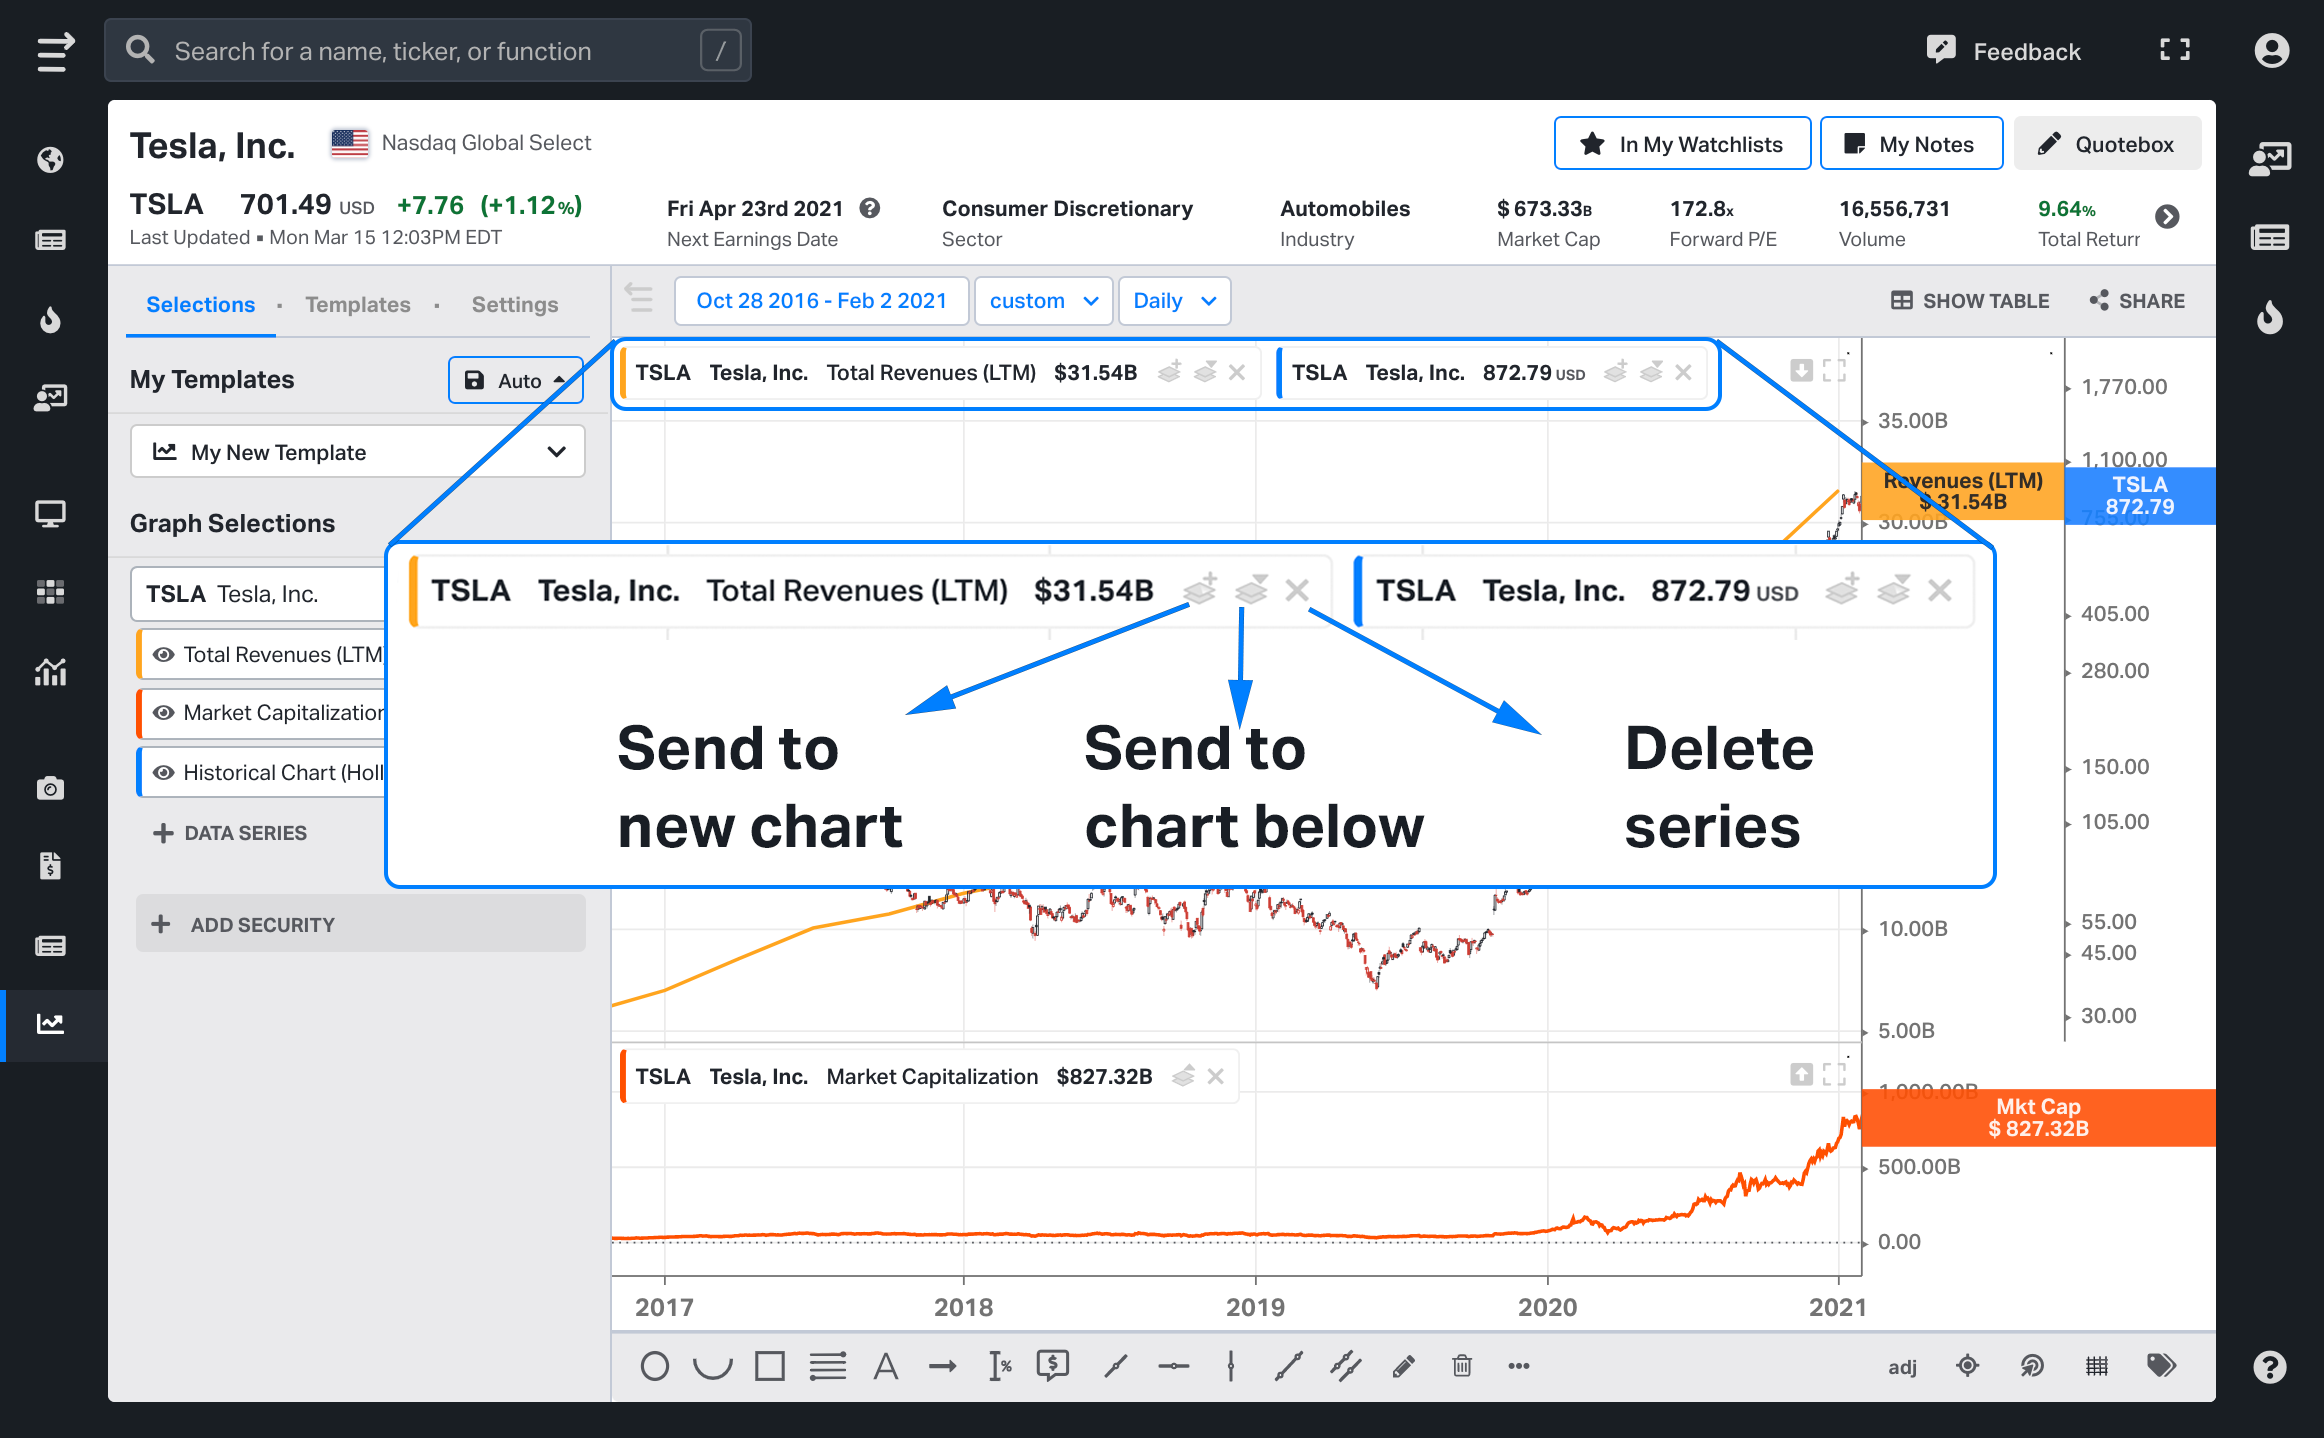
The legend menu allows you to separate data series into new charts, or combine multiple charts into one.
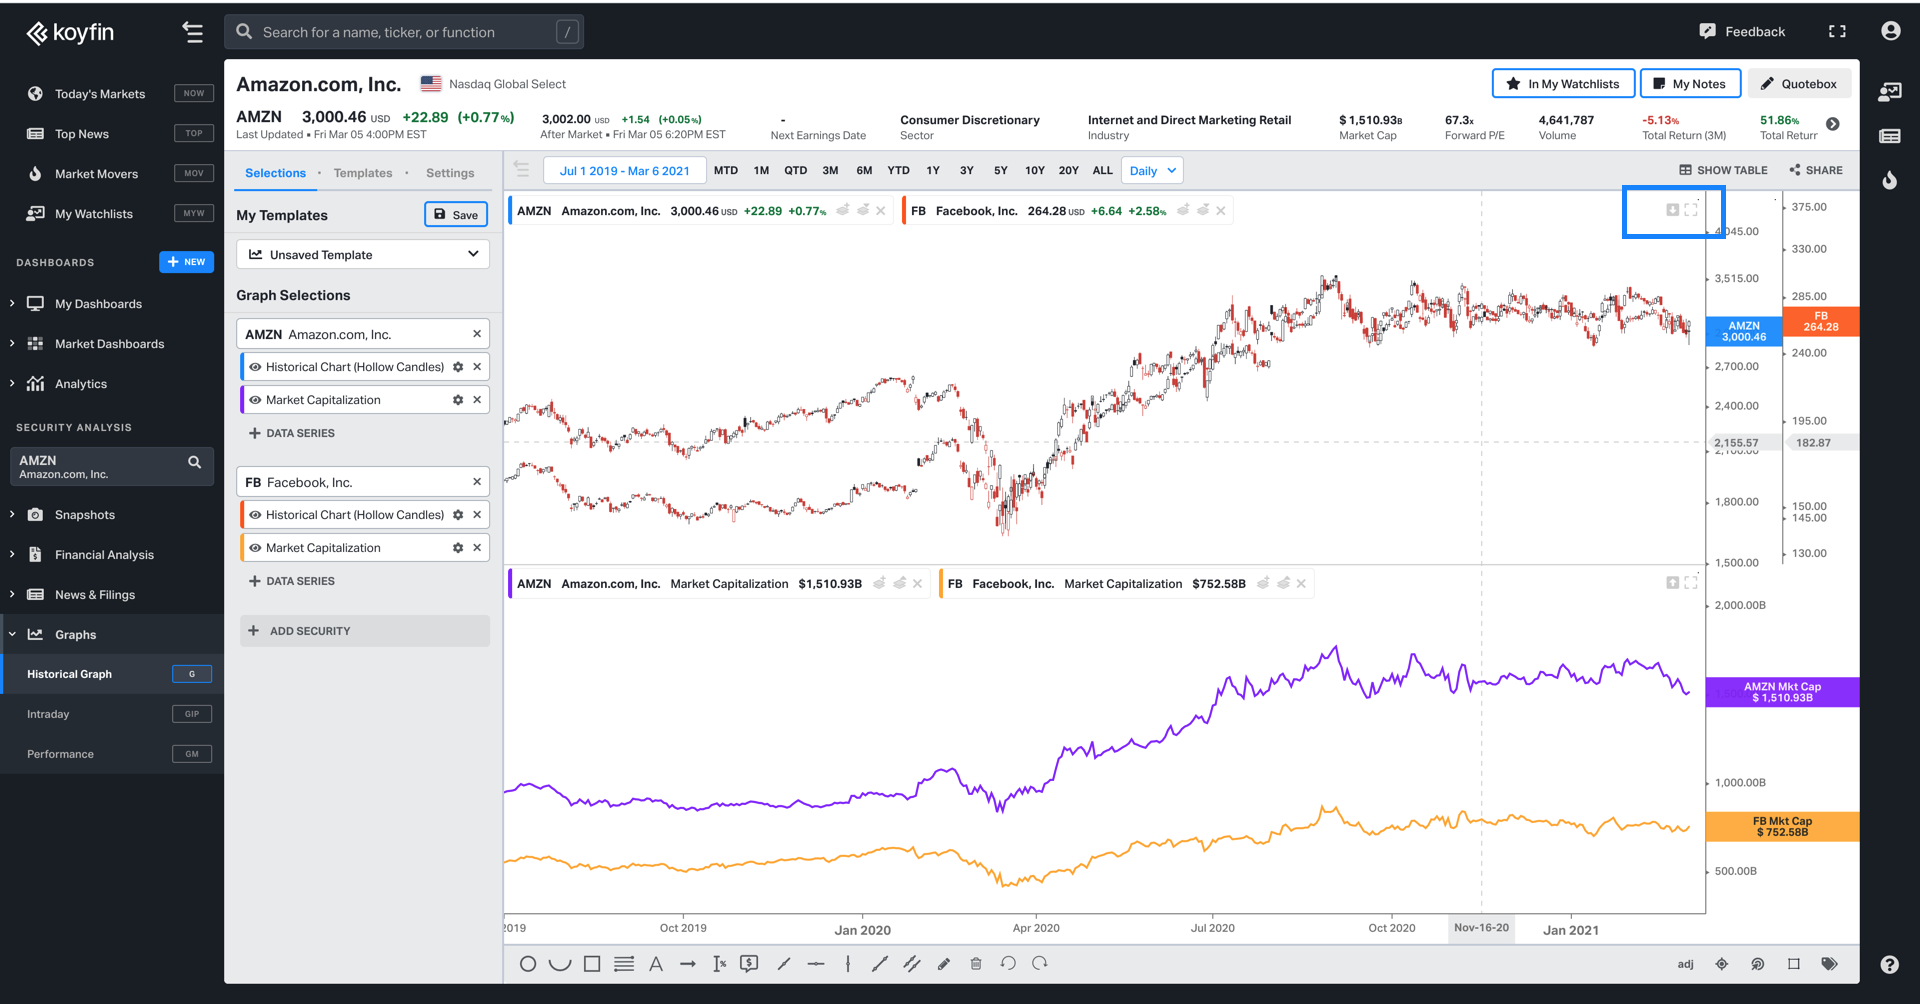
You can change the height of the charts by dragging the horizontal divider between two charts. Additionally, the icons on the top left of each chart allow you to rearrange the order of the charts, or maximize a chart.
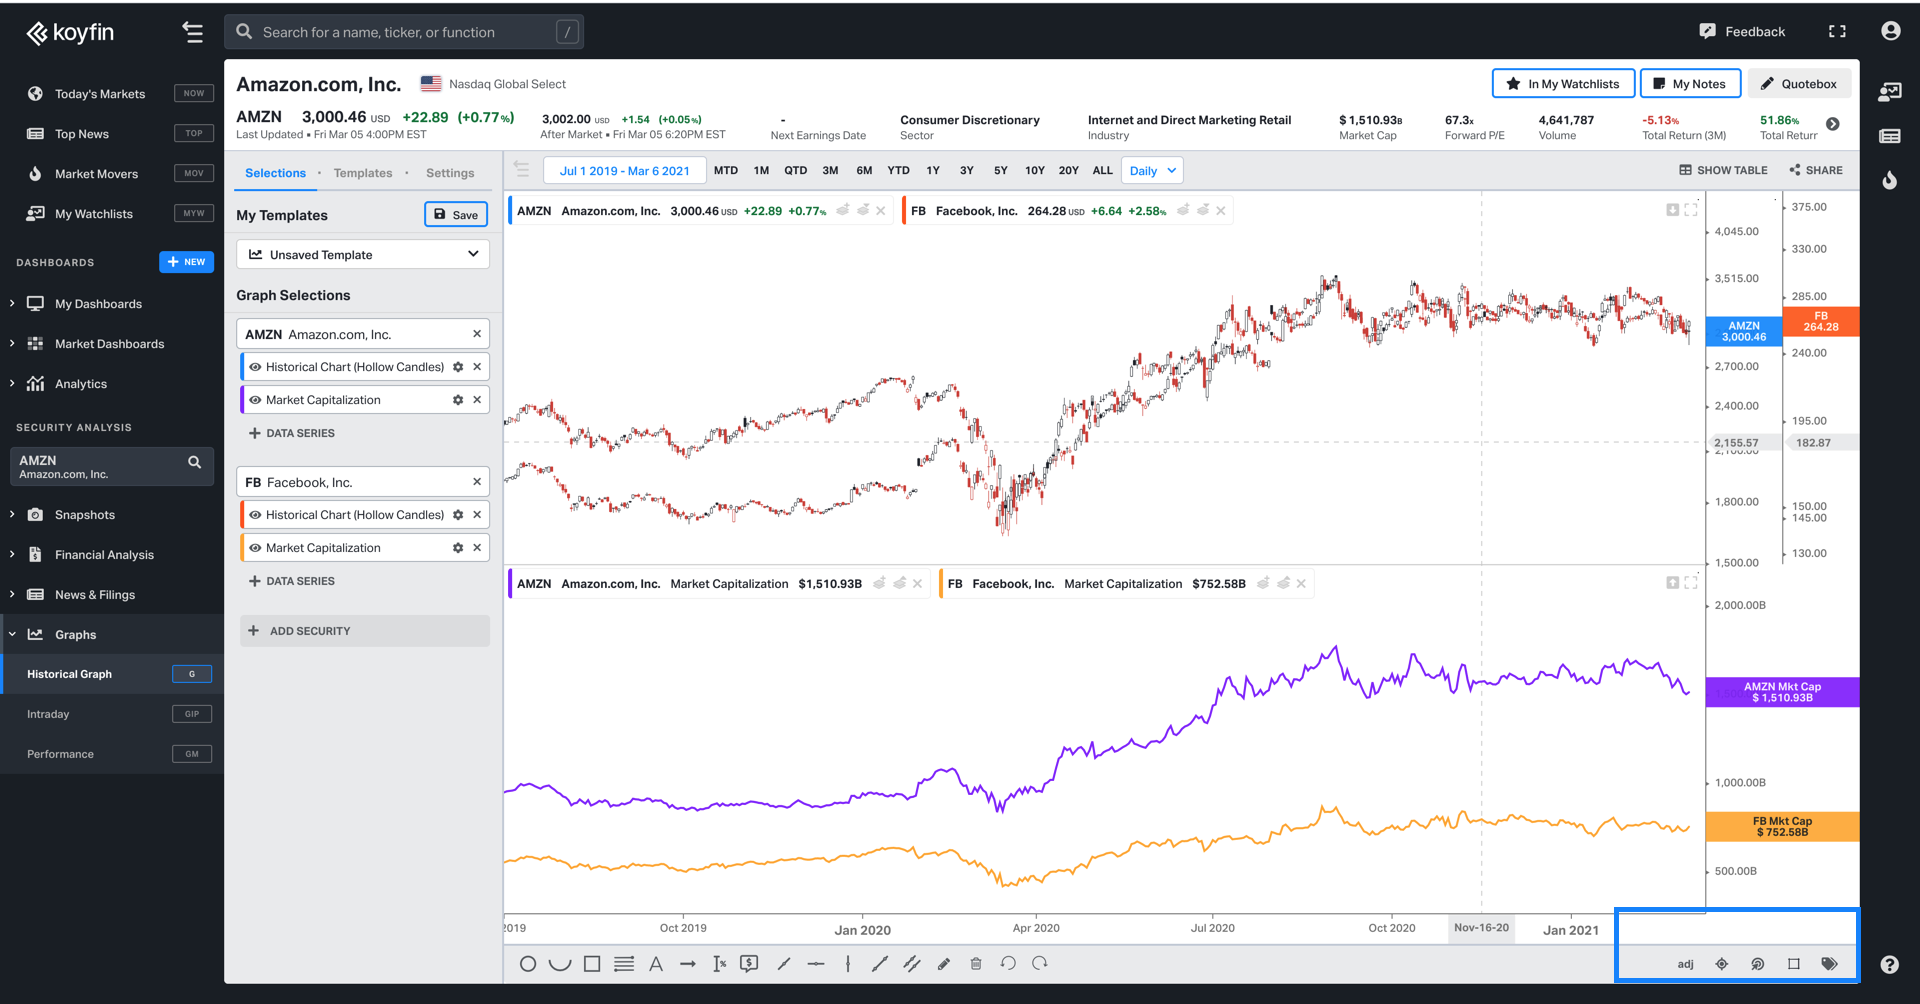
Important chart settings are located on the bottom-right of the chart:
Adjusted/Unadjusted prices on the graph. See more.
Crosshair to display x- and y-axis values
Mouseover which will display data values when hovering over a chart series
Grid lines
Legend labels
Annotation tools at the bottom of the chart allow you to draw on the chart. You can click on the annotation to change its settings like color and line format. You also use CTRL+C and CTRL+V to copy and paste annotations.
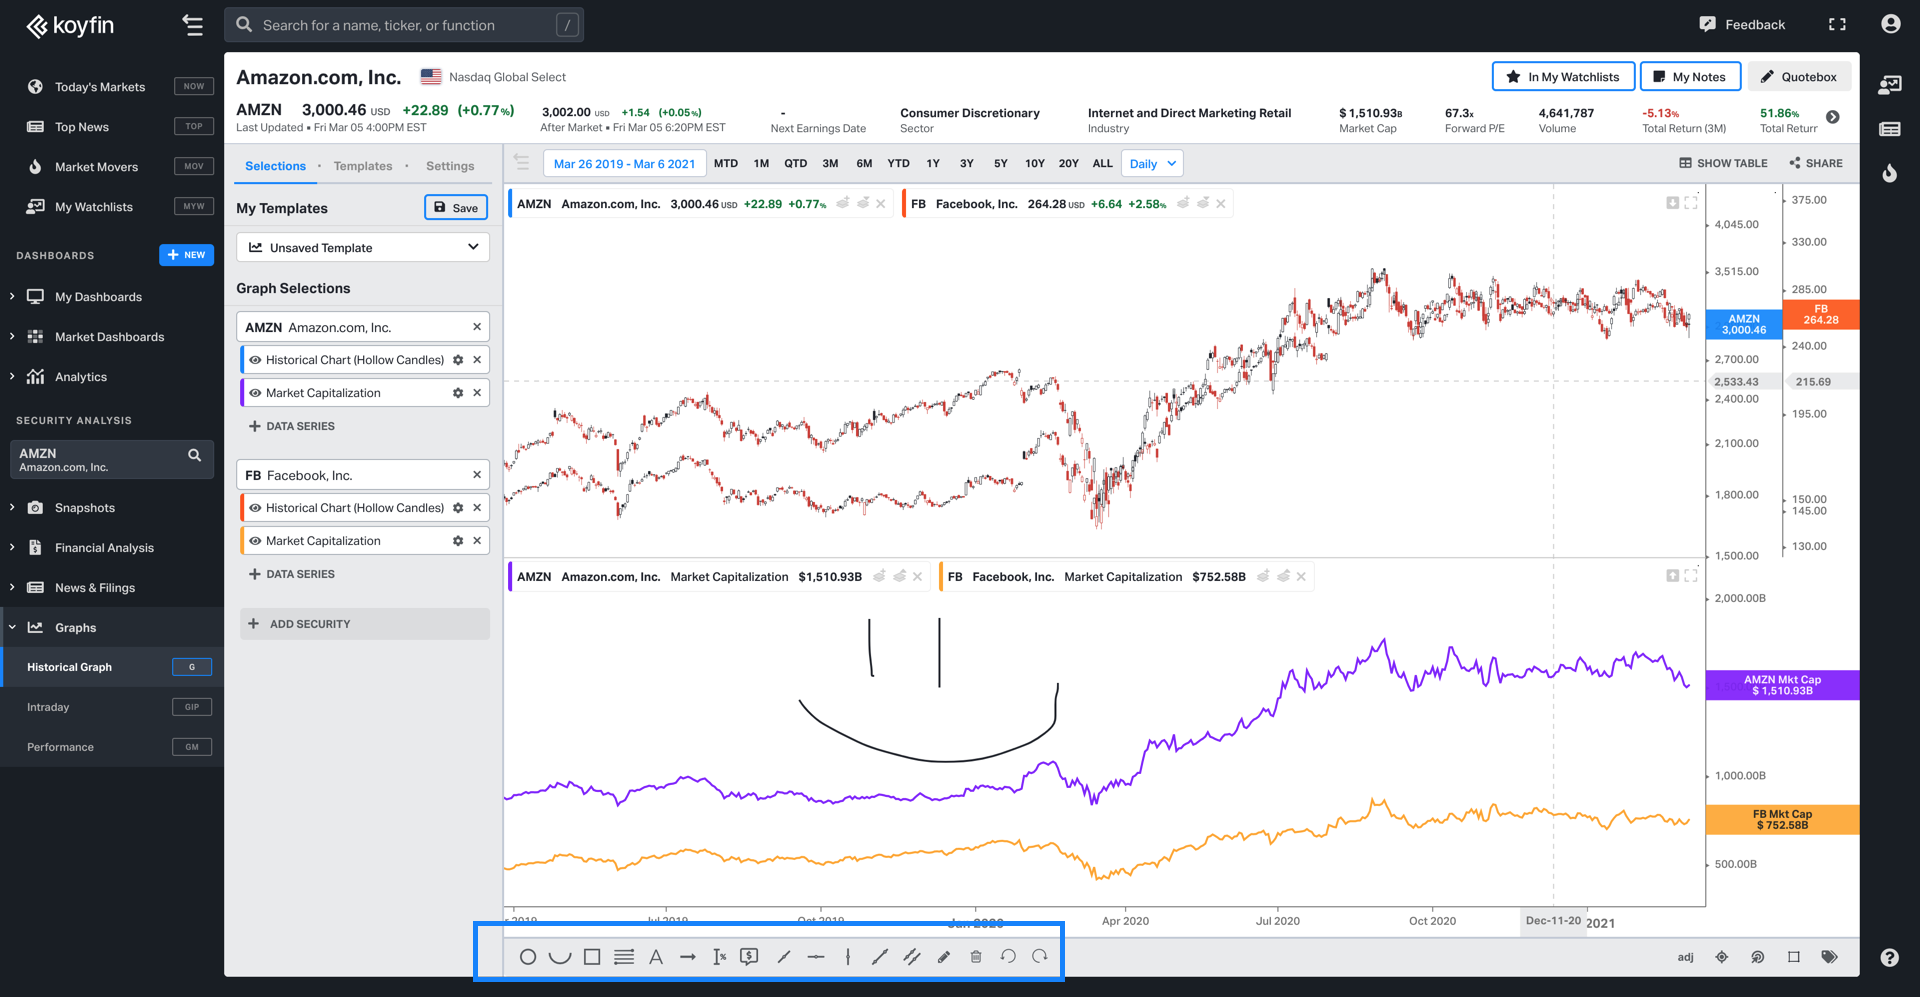
Annotations automatically save for each Template and Ticker combination. For example, if you have FB loaded into the Price & Volume template, any annotation will save for that template. If you select a different template with FB, the annotation you just created won't be there.
Graph Templates
Templates allow you to customize a chart with data series and settings, and use that chart template again with other securities. For example, you can create a chart with a green 100-day moving average line and a red dotted 200-day moving average line. When you save it as a template, you can reuse that graph with other tickers without manually adding the moving averages each time.
Graph templates remember the primary security series and formats, date range and frequency, charts settings such as log, linear and adjusted prices, and chart settings such as mouseover and gridlines. If you save a template with a secondary security, the secondary security will remain static and will load each time.
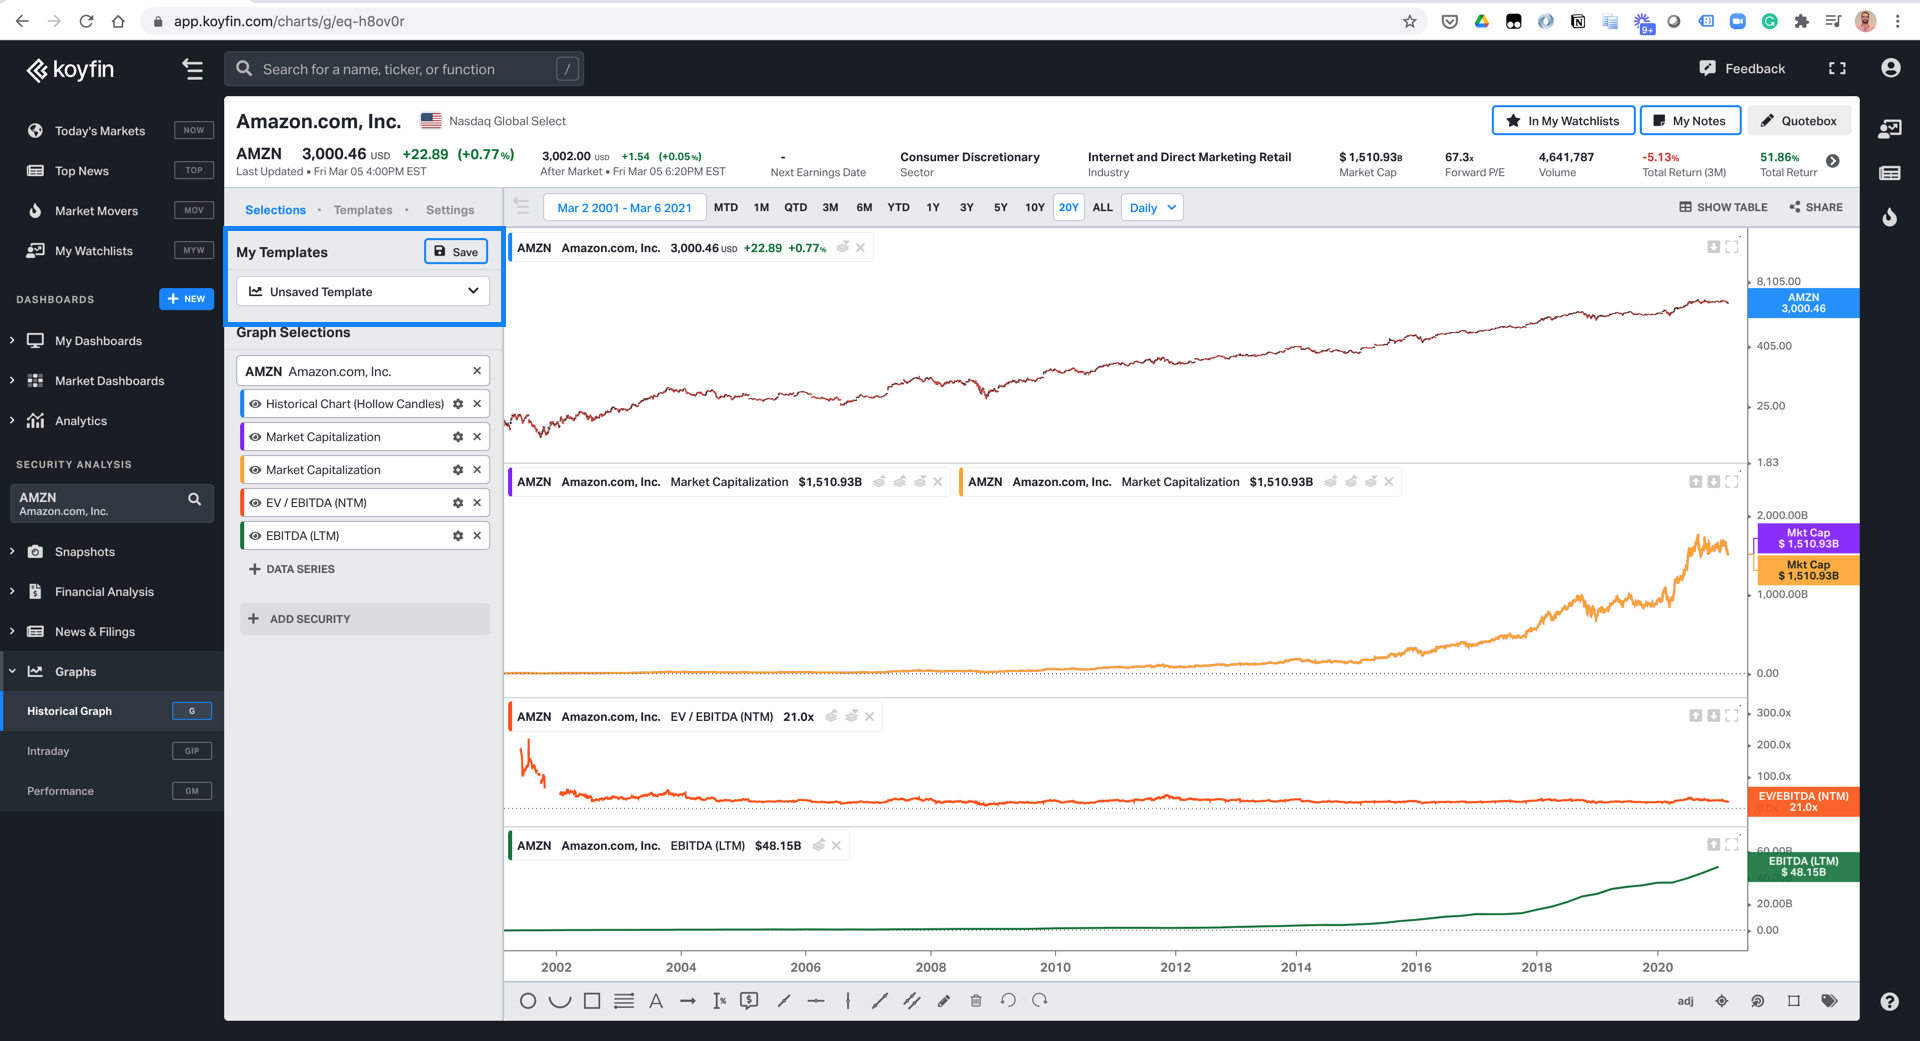
To create a new chart template, start with an unsaved template and customize the chart with additional series. Then click Save at the top of the series manager. Name your chart template and optionally pick a shortcut. The shortcut allows you to quickly pull up the chart template from the command bar. See more.
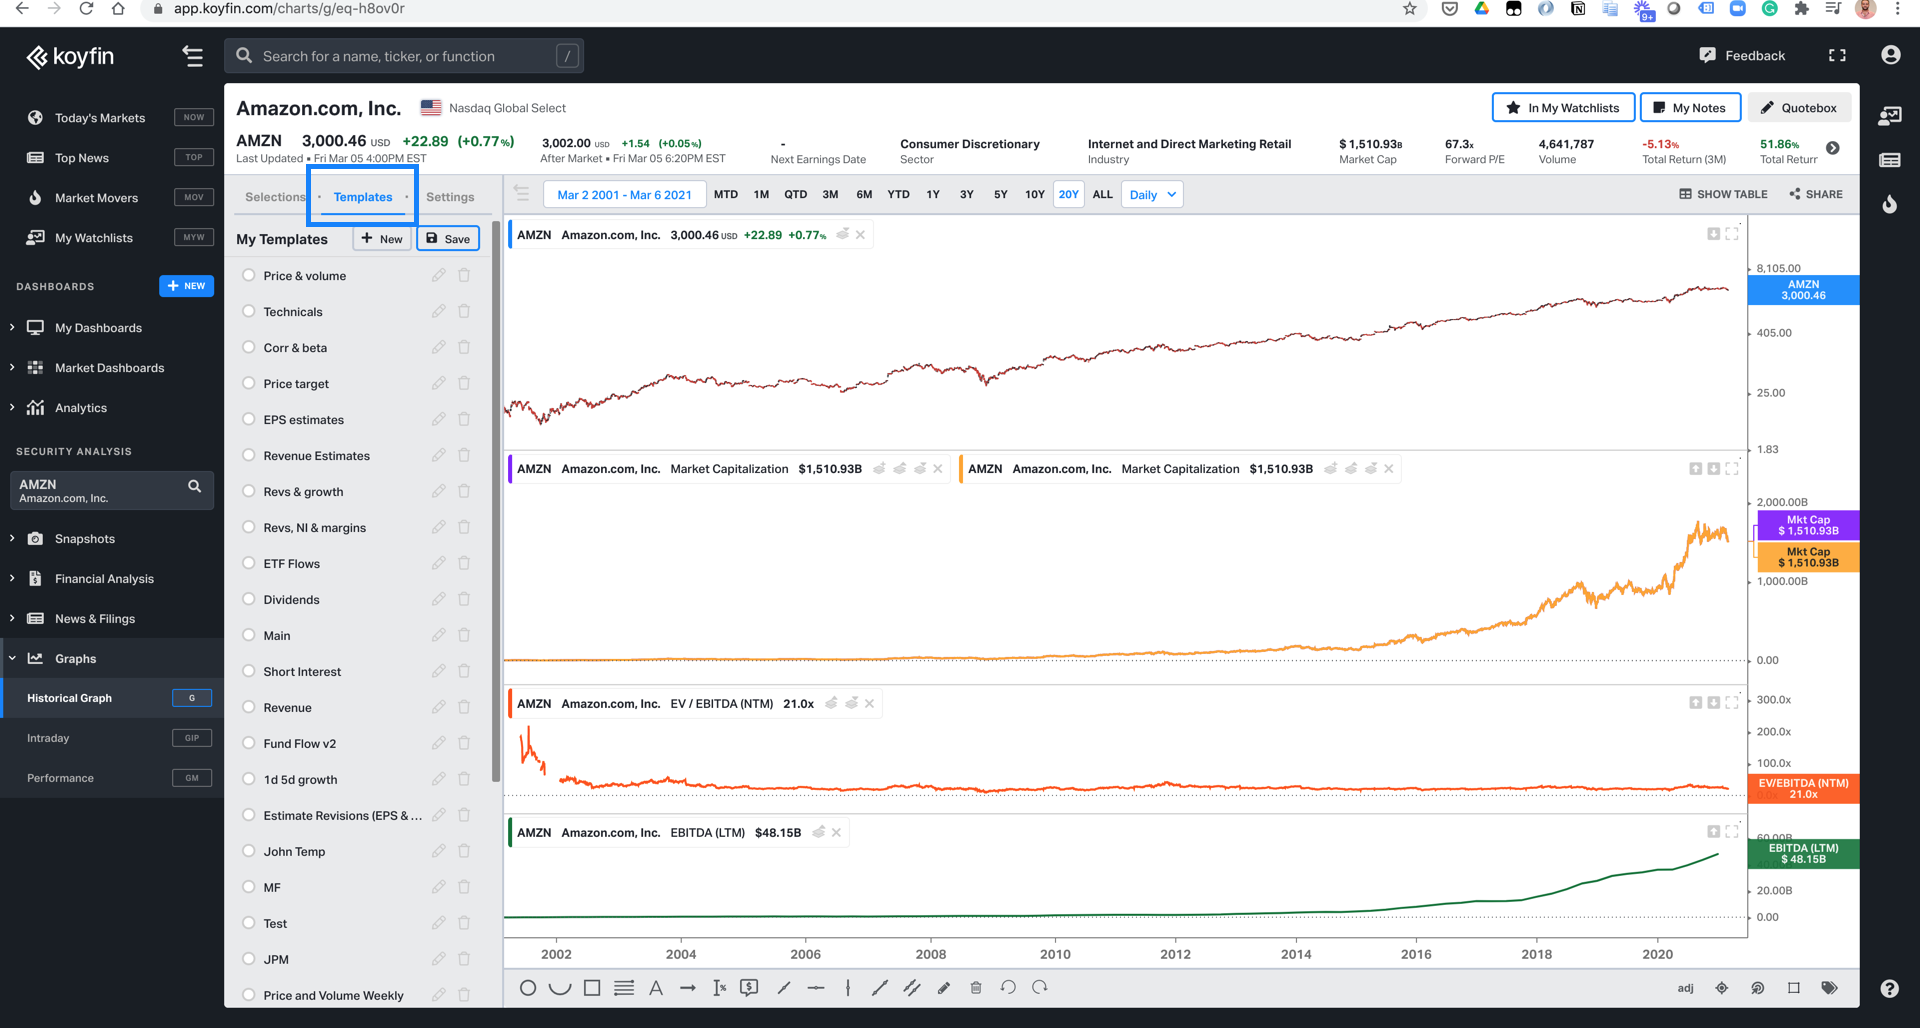
You can select chart templates from your dropdown in the Series Manager, or from the Template Manager by clicking on a Templates tab. In the Template Manager you can edit, delete or change the order of the templates by dragging the move icon to the left of the template name.
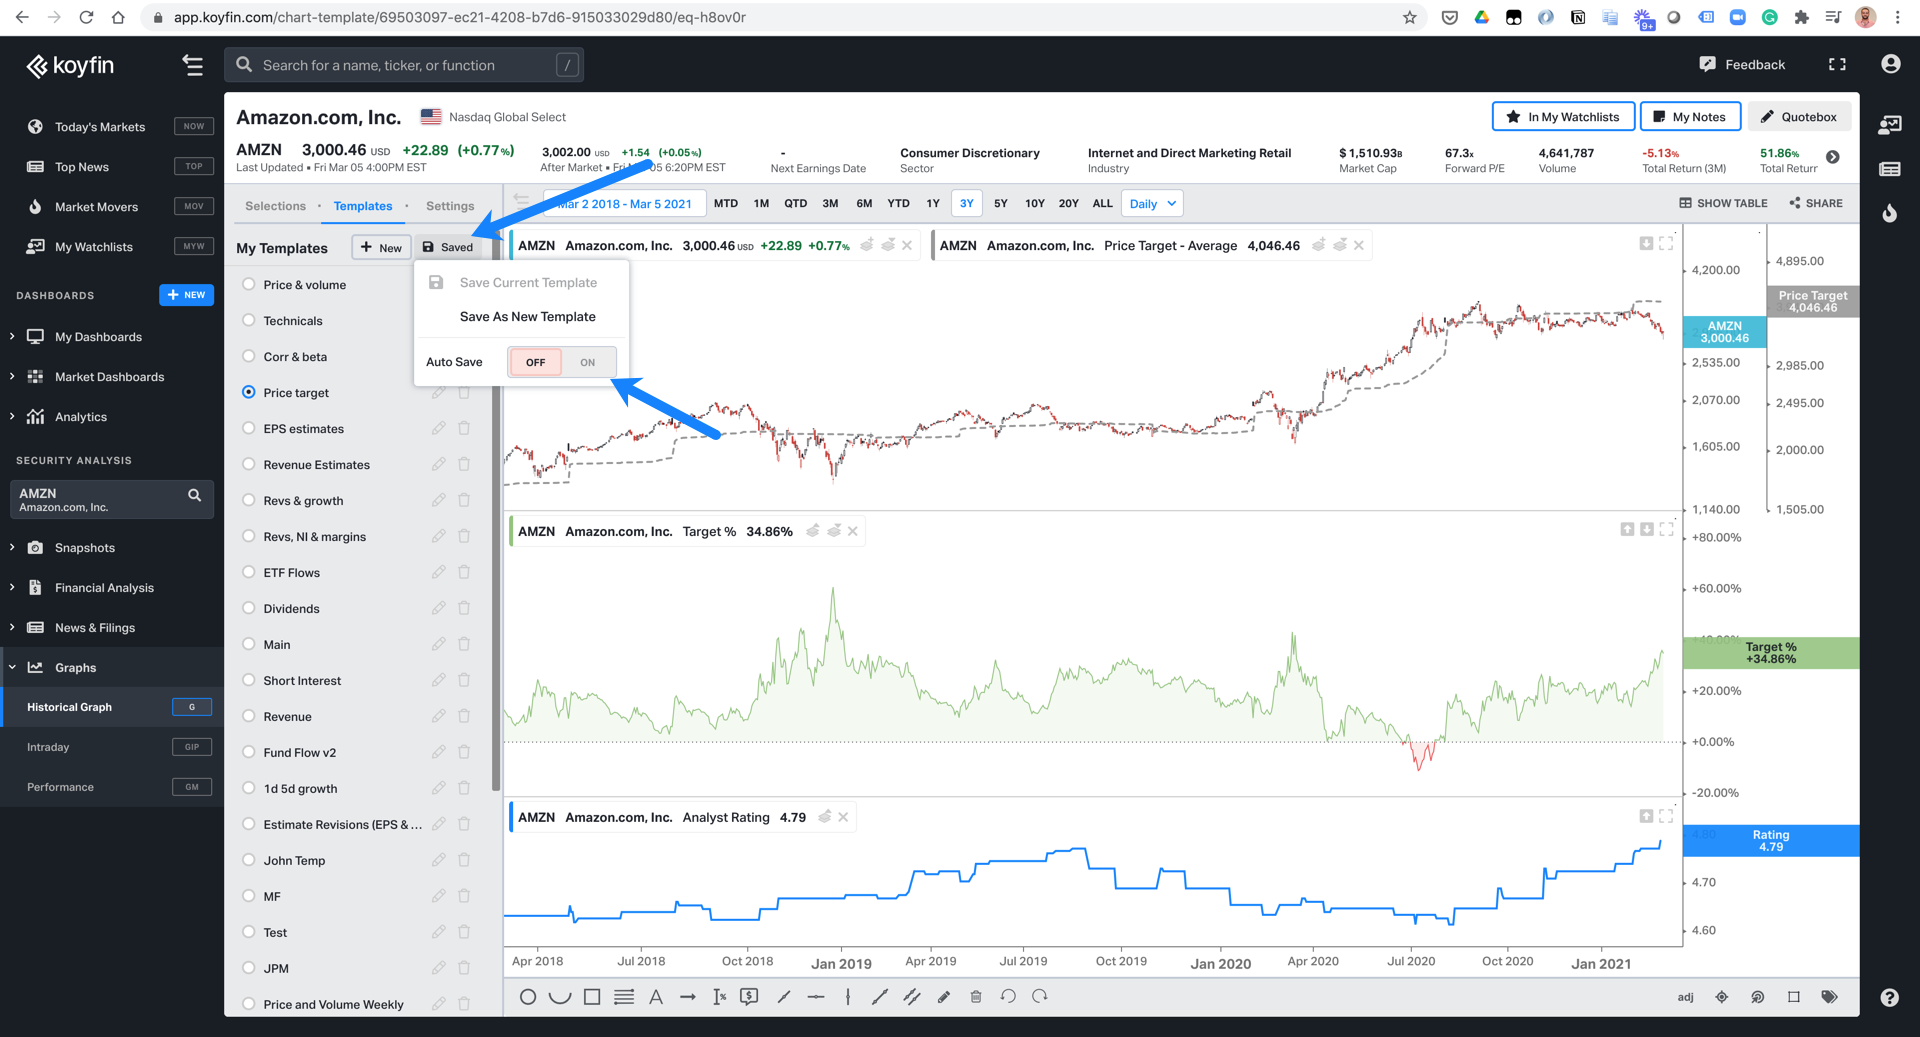
If you have a template loaded and make any chart changes, use the Save button to save changes to the template. For example, adding a new data series or changing the y-axis from log to linear. If you don't explicitly hit save and navigate away from the chart, the new changes will not be saved. You can turn on Autosave if you want any graph changes to be automatically be saved to the template. Click on the Saved button to access the autosave menu.
Note: Graph annotations autosave for any template/ticker combination, even if template autosave is turned off.
You can use your graph templates in MyDashboards. Add a historical graph component and select the graph template from the dropdown menu.