Percentile rank is a measure 0-100 for a particular metric like P/E and tells you what percentage of companies in a cohort have lower or higher values. It provides context around performance, valuation and financials by comparing a company vs. a cohort of stocks. Percentile rank is available as a column in Watchlists, Screener or as a field in Market Scatter (MS).
Users can select different cohorts as the comparison including:
County: Stocks in the same country as the security analyzed.
Country Sector: Stocks in the same sector and country as the security analyzed.
Region - Stocks in the same region as the security analyzed. There are five regions including (1) US & Canada (2) Latin America & Caribbean (3) Europe & UK (4) Asia Pacific, and (5) Africa & Middle East.
Region Sector - Stocks in the same sector and region as the security analyzed.
Global: All stocks in the world.
Global Sector: Global stocks in the same sector as the security analyzed.
Example Of Using Percentile Rank In A Watchlist
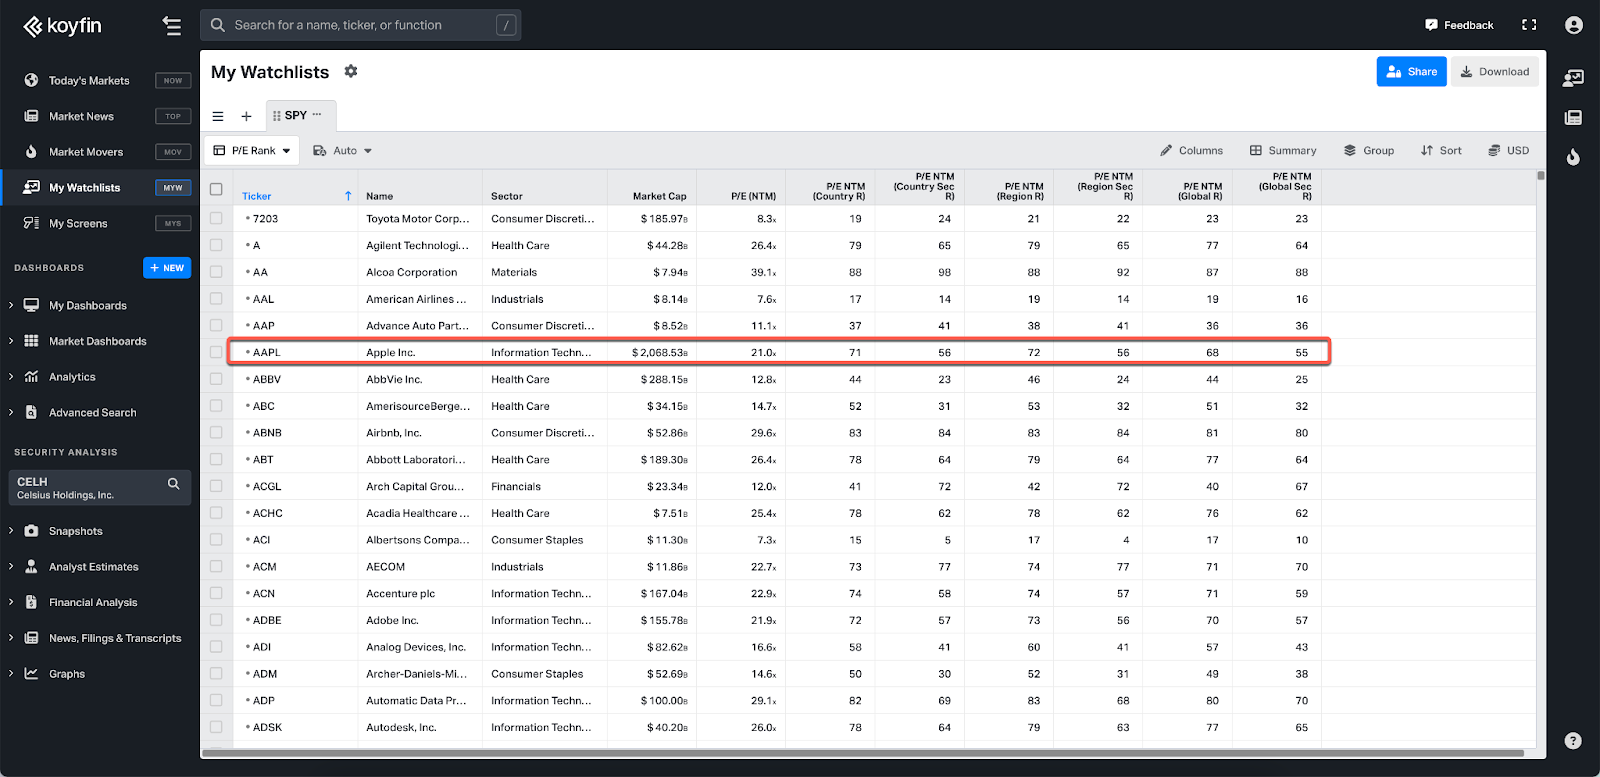
In the screenshot above, Apple (AAPL) has an NTM P/E of 21.0x. However, that doesn’t tell us whether Apple is cheap or expensive vs. other stocks. An investor might want to know how that P/E compares with different cohorts. The percent rank columns shed some light on this question.
Country: Apple has a percentile rank of 71 vs. all other stocks in the US, suggesting that the stock is slightly expensive based on a relative P/E. 71% of stocks in the US have a lower P/E, and 29% of stocks in the US have a higher P/E.
Country Sector: Apple has a percentile rank of 56 vs. all of the Information Technology stocks in the US.
Region: Apple has a percentile rank of 72 vs. all stocks in US & Canada.
Region Sector: Apple has a percentile rank of 56 vs. all of the Information Technology stocks in US & Canada.
Global: Apple has a percentile rank of 72 vs. all stocks in US & Canada.
Region Sector: Apple has a percentile rank of 55 vs. all of the Information Technology stocks in the world.
Technical Notes
Data Frequency
Percentile Rank values are calculated at the end each trading day US markets time (EST). Percentile Ranks for live data fields like performance will be updated at the end of each day.
Excluded metrics
Percentile Rank is calculated for a select group of popular metrics, and some financial metrics will not have a percentile rank.
Small companies are excluded
If a company's market cap is less than 20 million, then the company will not have corresponding ranks. These small companies are also excluded from all cohorts.
Primary vs. secondary securities
Percentile rank and cohorts for financial and valuation ratios (e.g. P/E) are calculated for the parent and the secondary securities inherit the values from the parent. For example, when analyzing the P/E of Tencent, the Country percentile rank for ticker TCTZF is calculated using the ticker 700 in Hong Kong against other Chinese stocks.
Percentile rank and cohorts for price change & performance (e.g. 1-year % change) are calculated separately for the parent and for the secondary securities. For example, when analyzing the 1-year % change of Tencent, the Country percentile rank for ticker TCTZF is calculated against all other US stocks. The percentile rank for ticker 700 in Hong Kong is calculated against all other stocks in China.