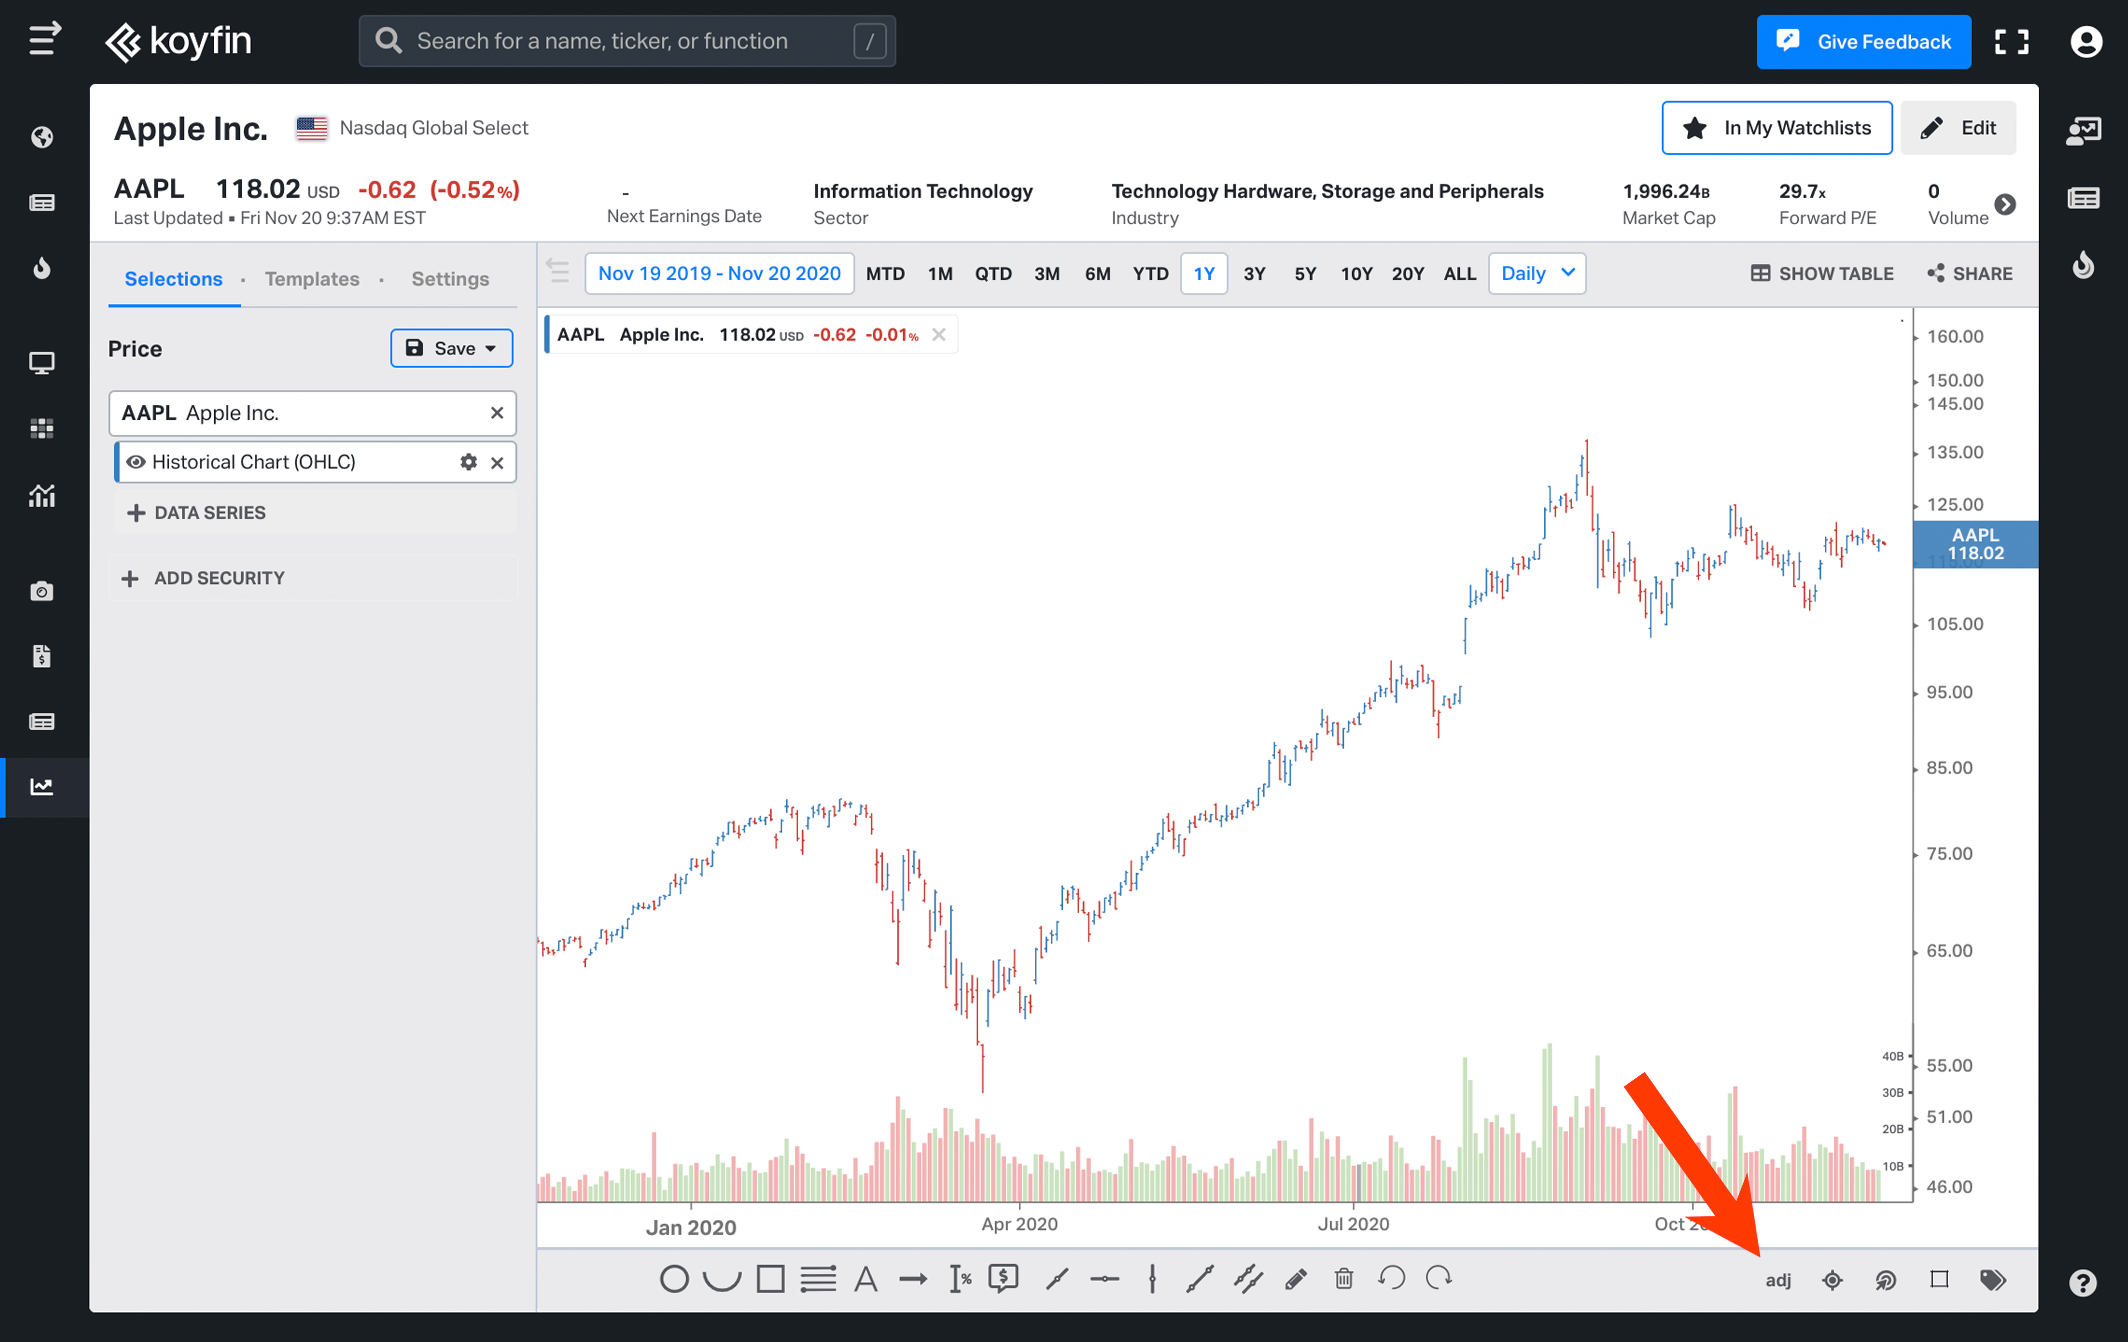
Koyfin allows users to show dividend-adjusted or unadjusted historical price data. You can select which option to display at the bottom of the G chart. Note that this option is only available for equities and ETFs. All other asset classes show exclusively unadjusted price data.
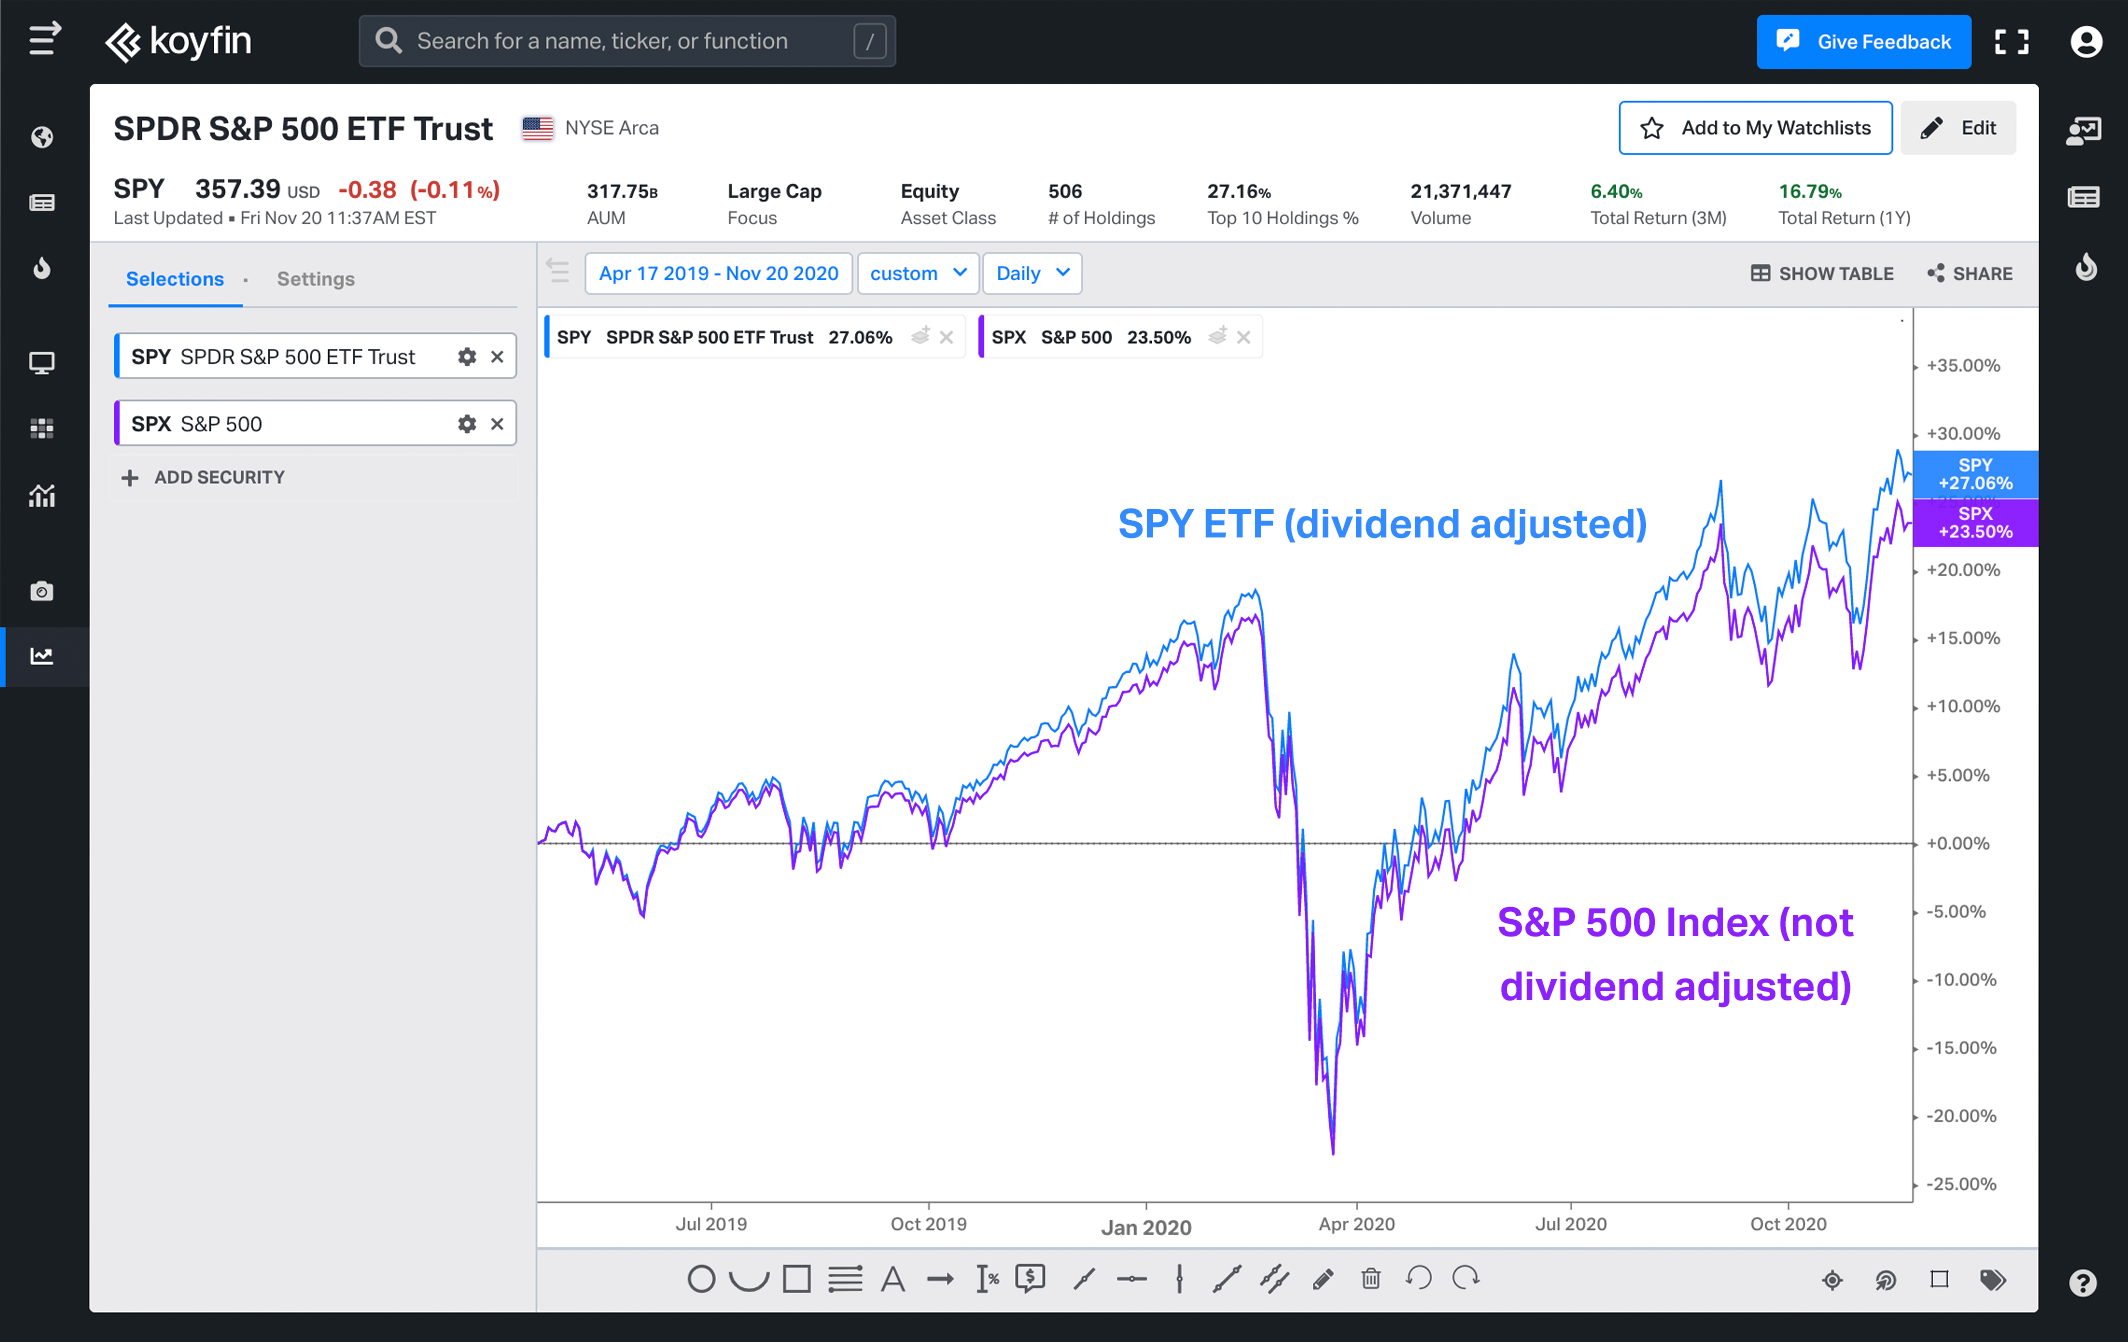
In the Normalized Performance Graph (GM), the historical % change on Koyfin shows the total return of a stock or ETF using adjusted price history. Equity indices on Koyfin like S&P 500 (SPX) are not adjusted for dividends and the GM graph shows the price change (not total return).
In the example below showing a GM normalized chart, the SPY ETF tracks the total return of the S&P 500, while the SPX index shows the price change of the S&P 500.
Should you use adjusted or unadjusted prices?
In short, we believe using adjusted prices is a more appropriate way to look at the historical price. However, there is no “correct” way to look at historical prices. Many investors look at historical price dividend unadjusted because the default on popular websites like Yahoo is to use an unadjusted price.
During the lifecycle of a stock, certain corporate actions impact the stock price per share which doesn’t impact the intrinsic value of a company. The easiest example is a stock split. If stock ABC was $100 per share on Jan 1, 2019 and has a 2-1 stock split on Jan 2, 2019, the majority of investors expect the historical stock chart to show an adjusted price of $50 on Jan 1 so that there's not a big decline from $100 to $50 on the chart. Even though an old newspaper from Jan 1 would show the stock price of $100.
This same logic applies to dividends. When a company pays a dividend on its ex-dividend date, the price per share declines by the dividend amount because a payment is made from the company to the shareholders. Importantly, this decline is “automatic” and enforced by arbitrageurs. It is not determined by investor sentiment or view of the dividend.
In the previous example, if ABC paid a $10 dividend and the ex-dividend date was Jan 2, the stock would decline to $90 per share on Jan 2, all else equal. An investor holding the stock on Jan 1 at $100 would have a $90 stock on Jan 2 and $10 in dividends. Note that the stock price declined by $10 but the value of the investor's holding did not change. This logic is similar to a stock split. Even though the stock price per share changes, the value of the investment does not.
How do stock prices react to dividends?
Determining whether dividend payments are good, bad or inconsequential for a company's intrinsic value is a complex topic. Generally the stock price will go up after an unexpected dividend increase. However for growth companies, investors may believe that a dividend announcement may signal that management is confident in the future fundamentals, or they may be disappointed that the company doesn't have enough growth opportunities. Regardless, the stock market reaction to a dividend happens when the dividend is announced, not when it's paid on the ex-dividend date.
Following the announcement, the stock price declines by the dividend amount on the ex-dividend date because that's when the stock exchange records who receives the dividend. If you purchase a stock on its ex-dividend date or after, you will not receive the next dividend payment. Instead, the seller gets the dividend. If you purchase before the ex-dividend date, you get the dividend. The price movement of the stock on the ex-dividend date is driven by accounting rather than market forces.
Historical prices on Koyfin vs. other sites
Many websites do not adjust by default for dividends though some technically focused sites do like stockcharts.com. We're not sure why most sites don't but it's probably because adjusting for dividends is a difficult process to implement. Many data providers do not provide consistent data to adjust for dividends. We've spent significant resources to implement a process that adjusts for dividends. Some sites use dividend-adjusted prices for equities but not ETFs. This is also because corporate actions for ETFs are difficult to find and maintain.