Appearance
You can adjust the zoom on your browser to fit more content into the browser window. This is especially useful for users with smaller screens like on a laptop.
You can also switch to dark mode.
Data
Koyfin has over one million data points including global equities, fundamentals, estimates, ETFs, mutual funds, fx, economic data, news and Twitter.
Read this article about Koyfin's broad data from various sources.
To see a timestamp of the last price update, you can hover over the time dot to the left of the ticker.
Explore our Data Dictionary to get detailed information about metrics.
Left-side Navigation Menu
Koyfin is organized into several sections that you can access via the left side menu.
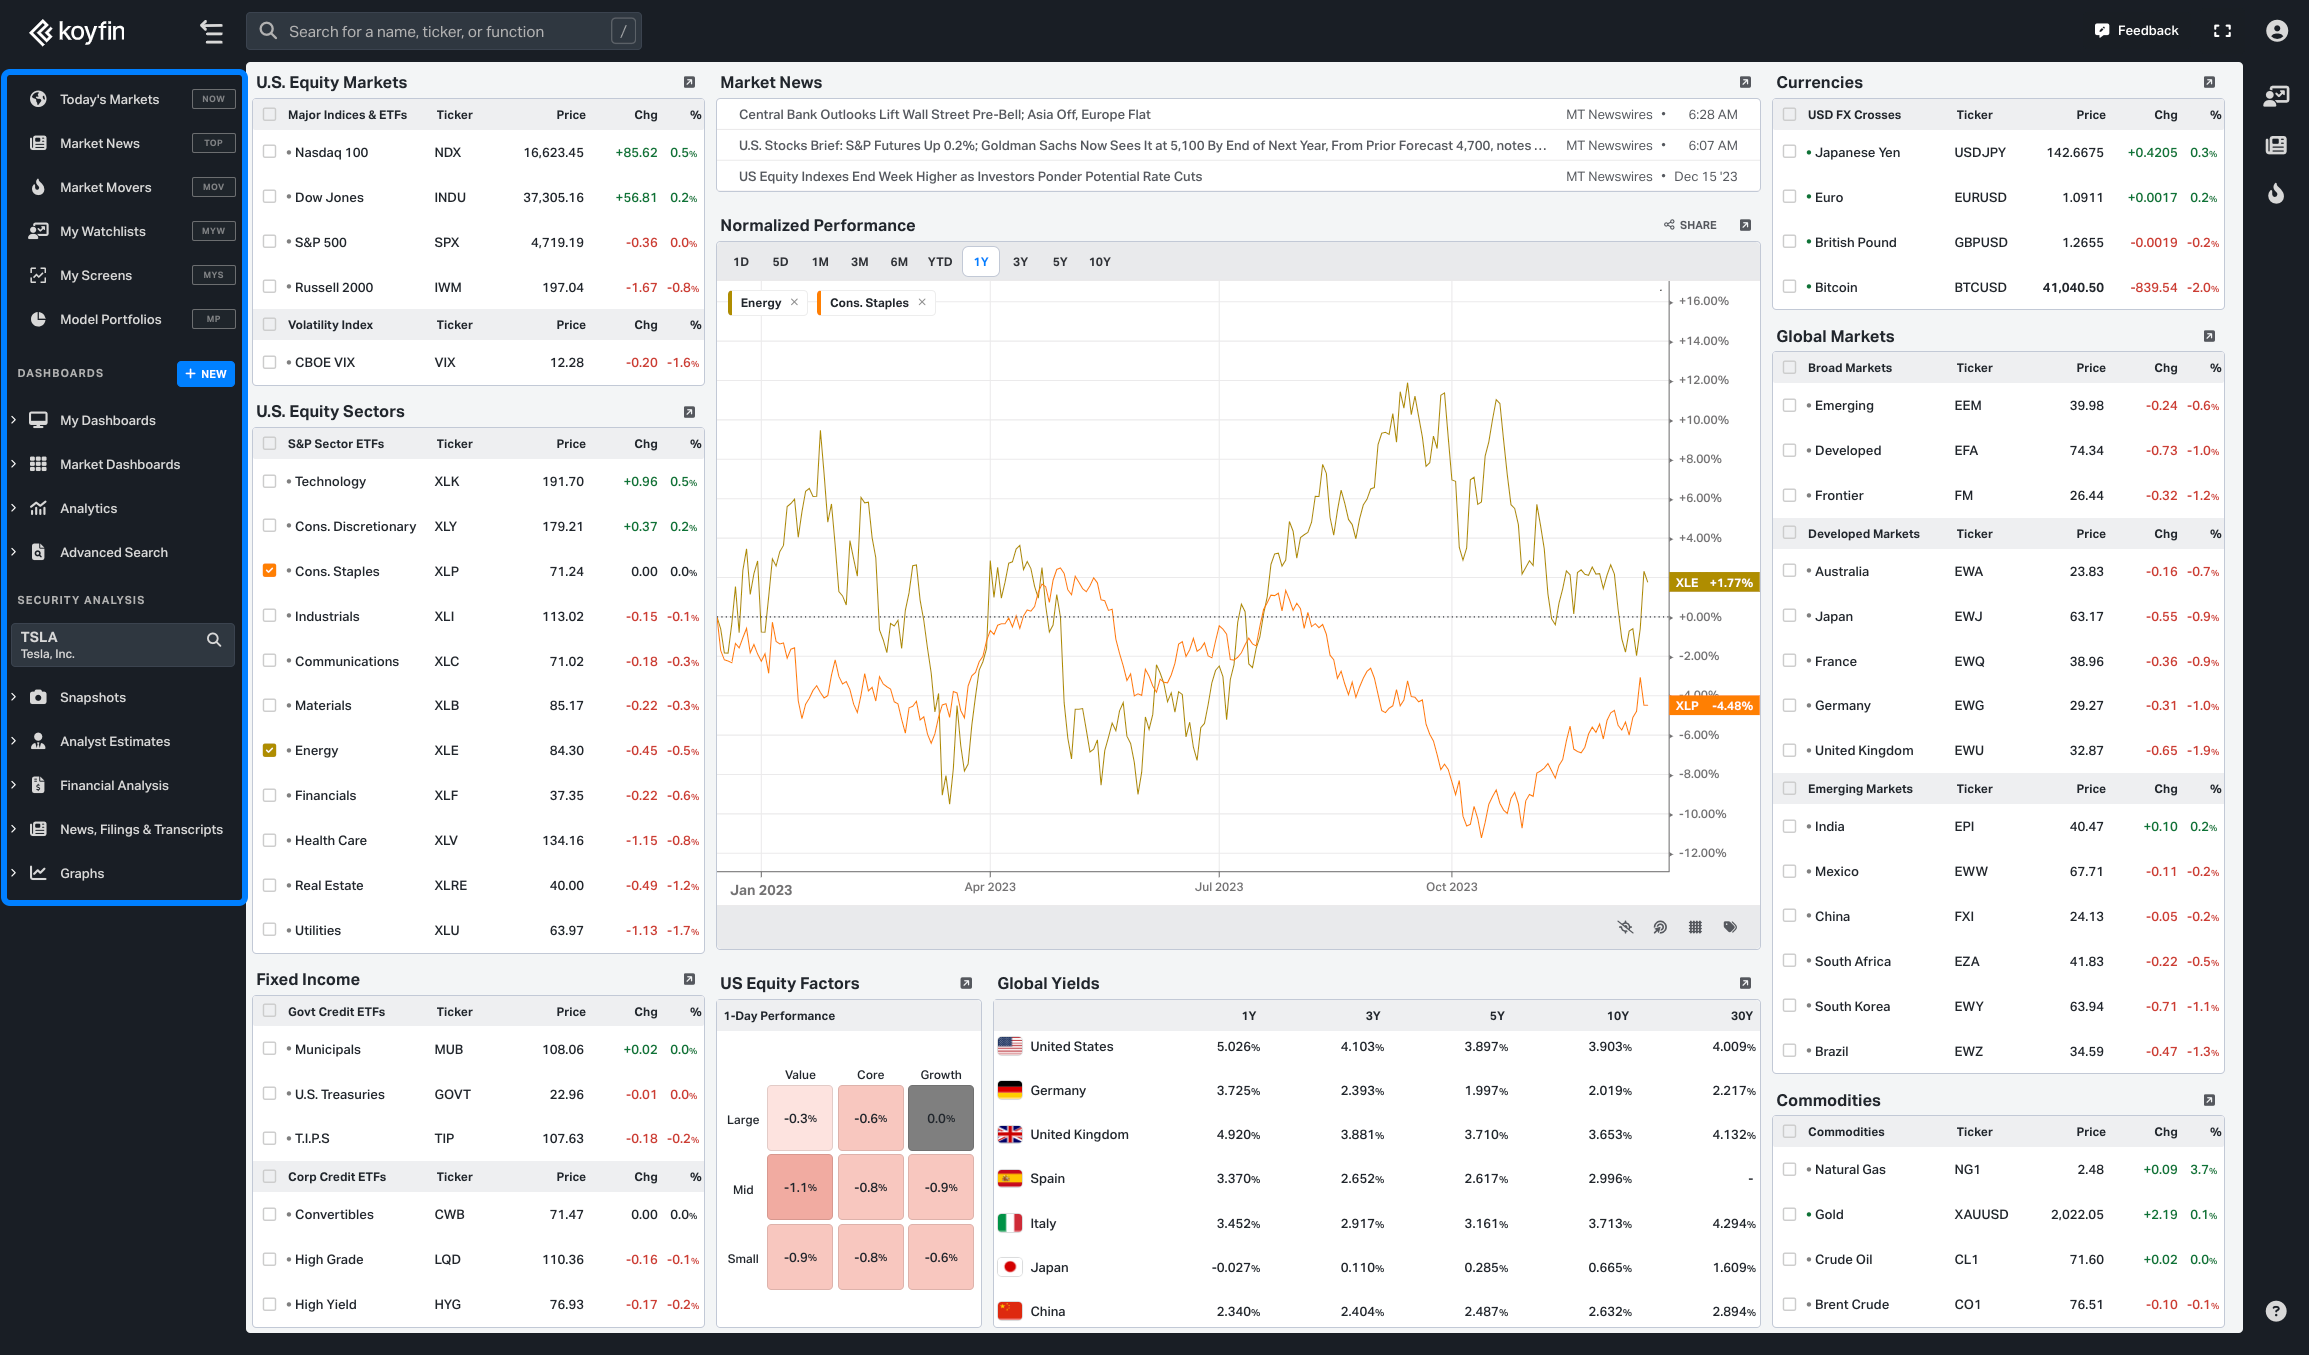
Right Sidebar
The right sidebar contains watchlists, movers and news which you can open and close by clicking on the icons. You can click on a stock in the right sidebar menu to load it into Koyfin. Learn more.
Key Features
My Watchlists
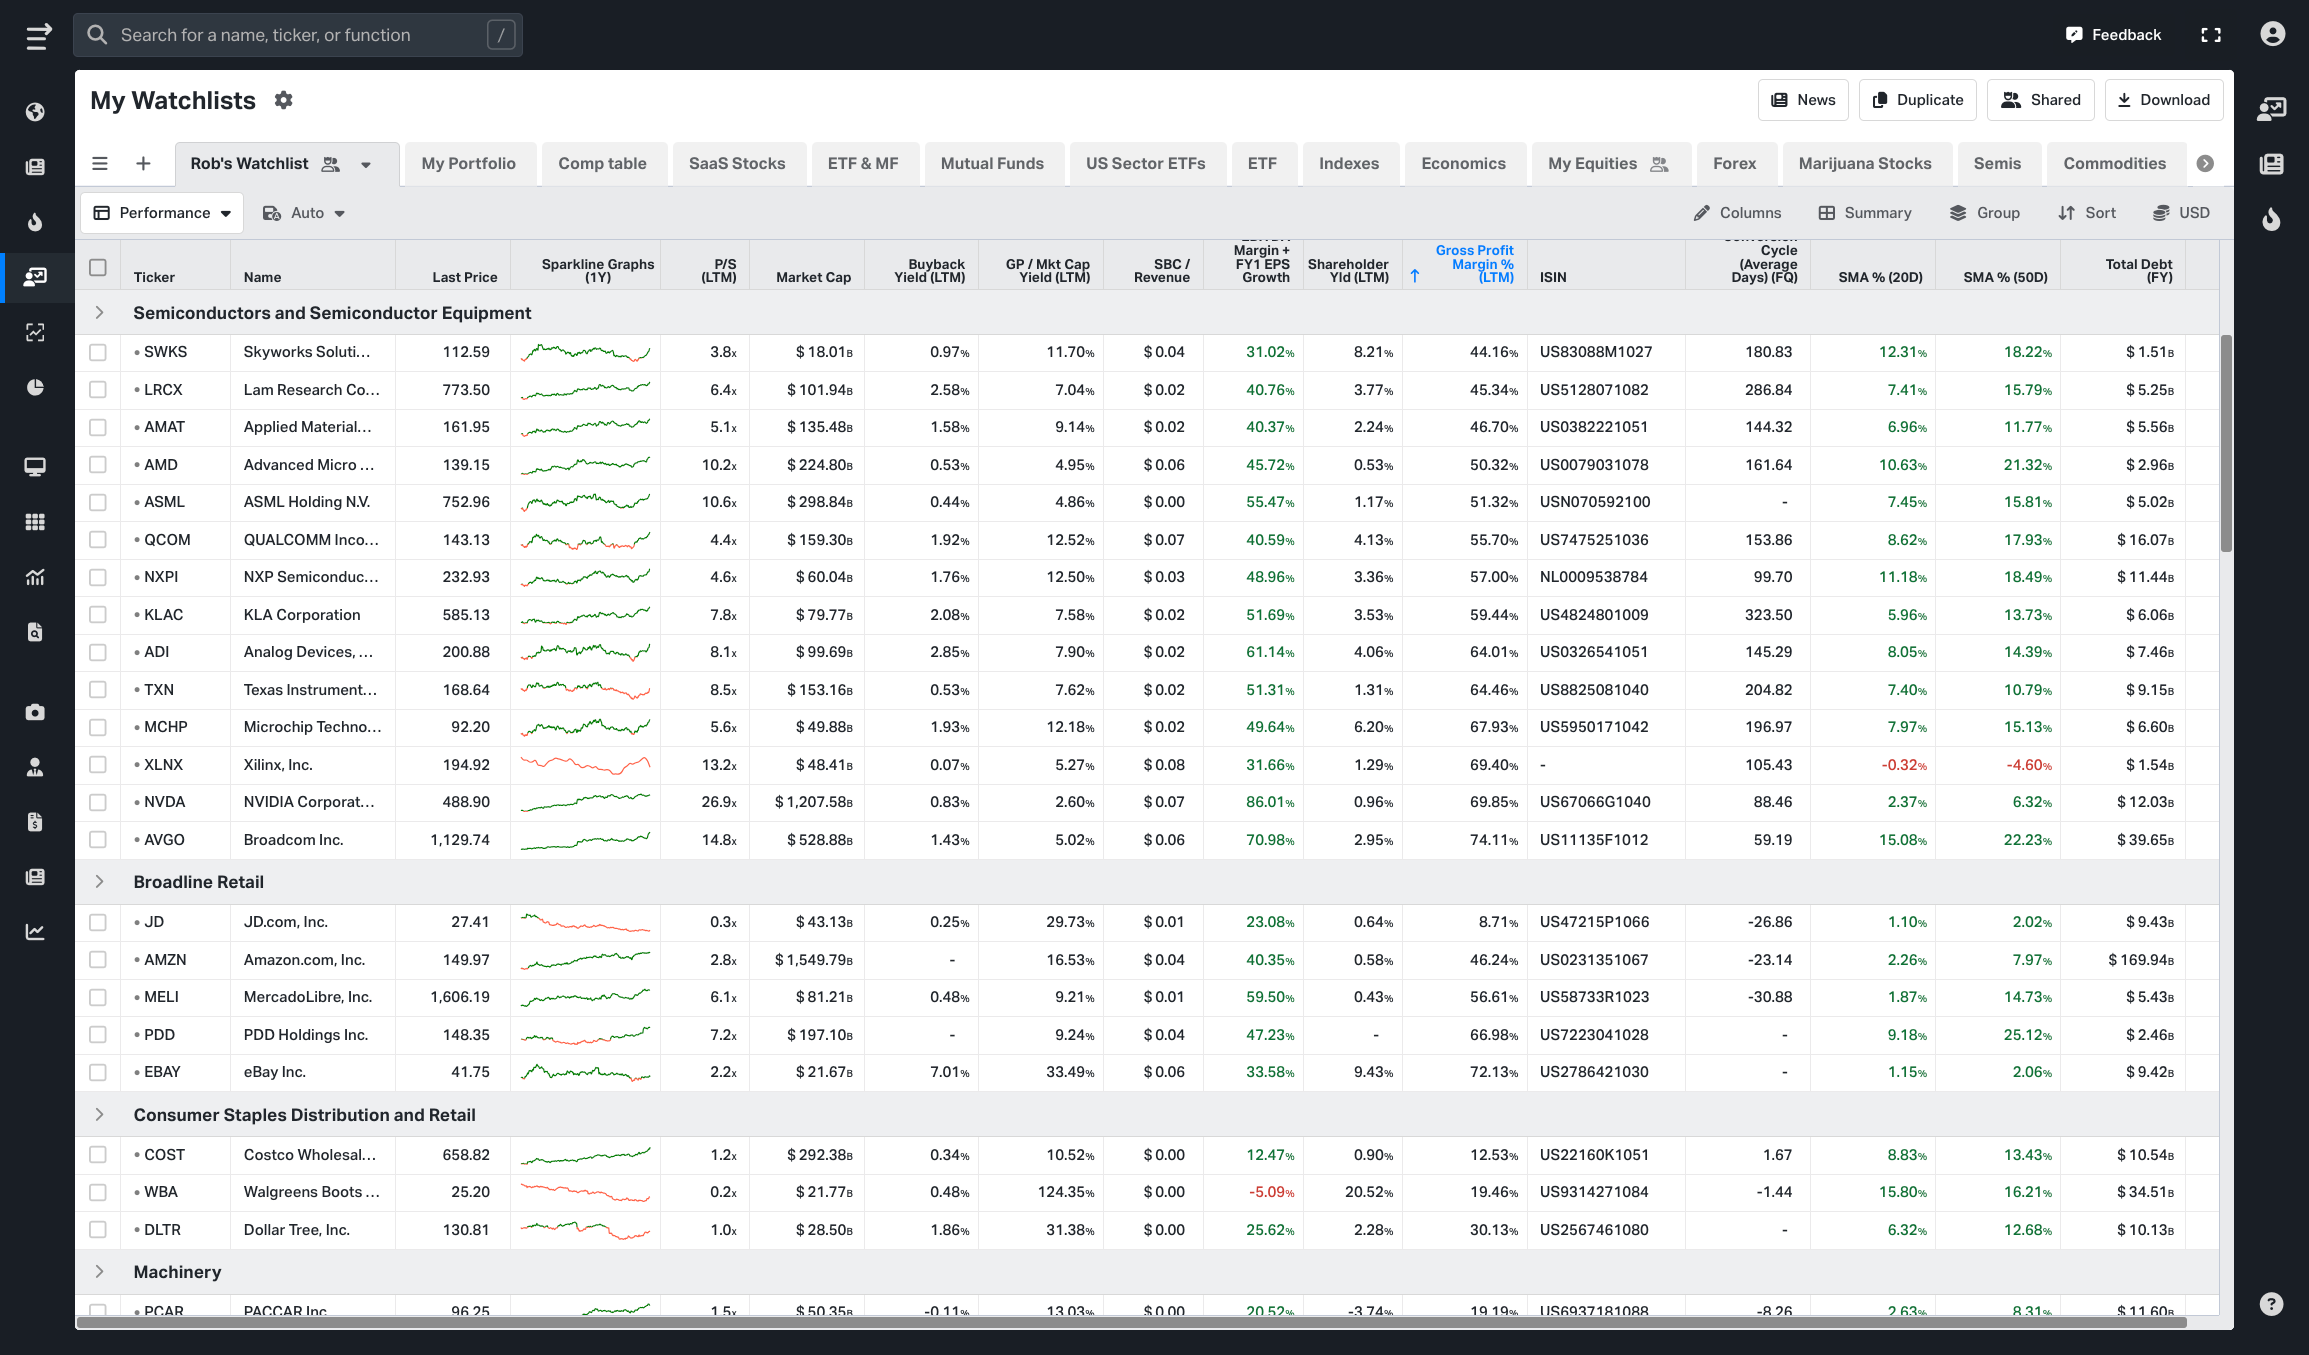
The My Watchlists feature streamlines portfolio management by allowing users to create personalized lists of their selected tickers and adding all necessary financial metrics for a comprehensive overview. Learn more.
My Screens
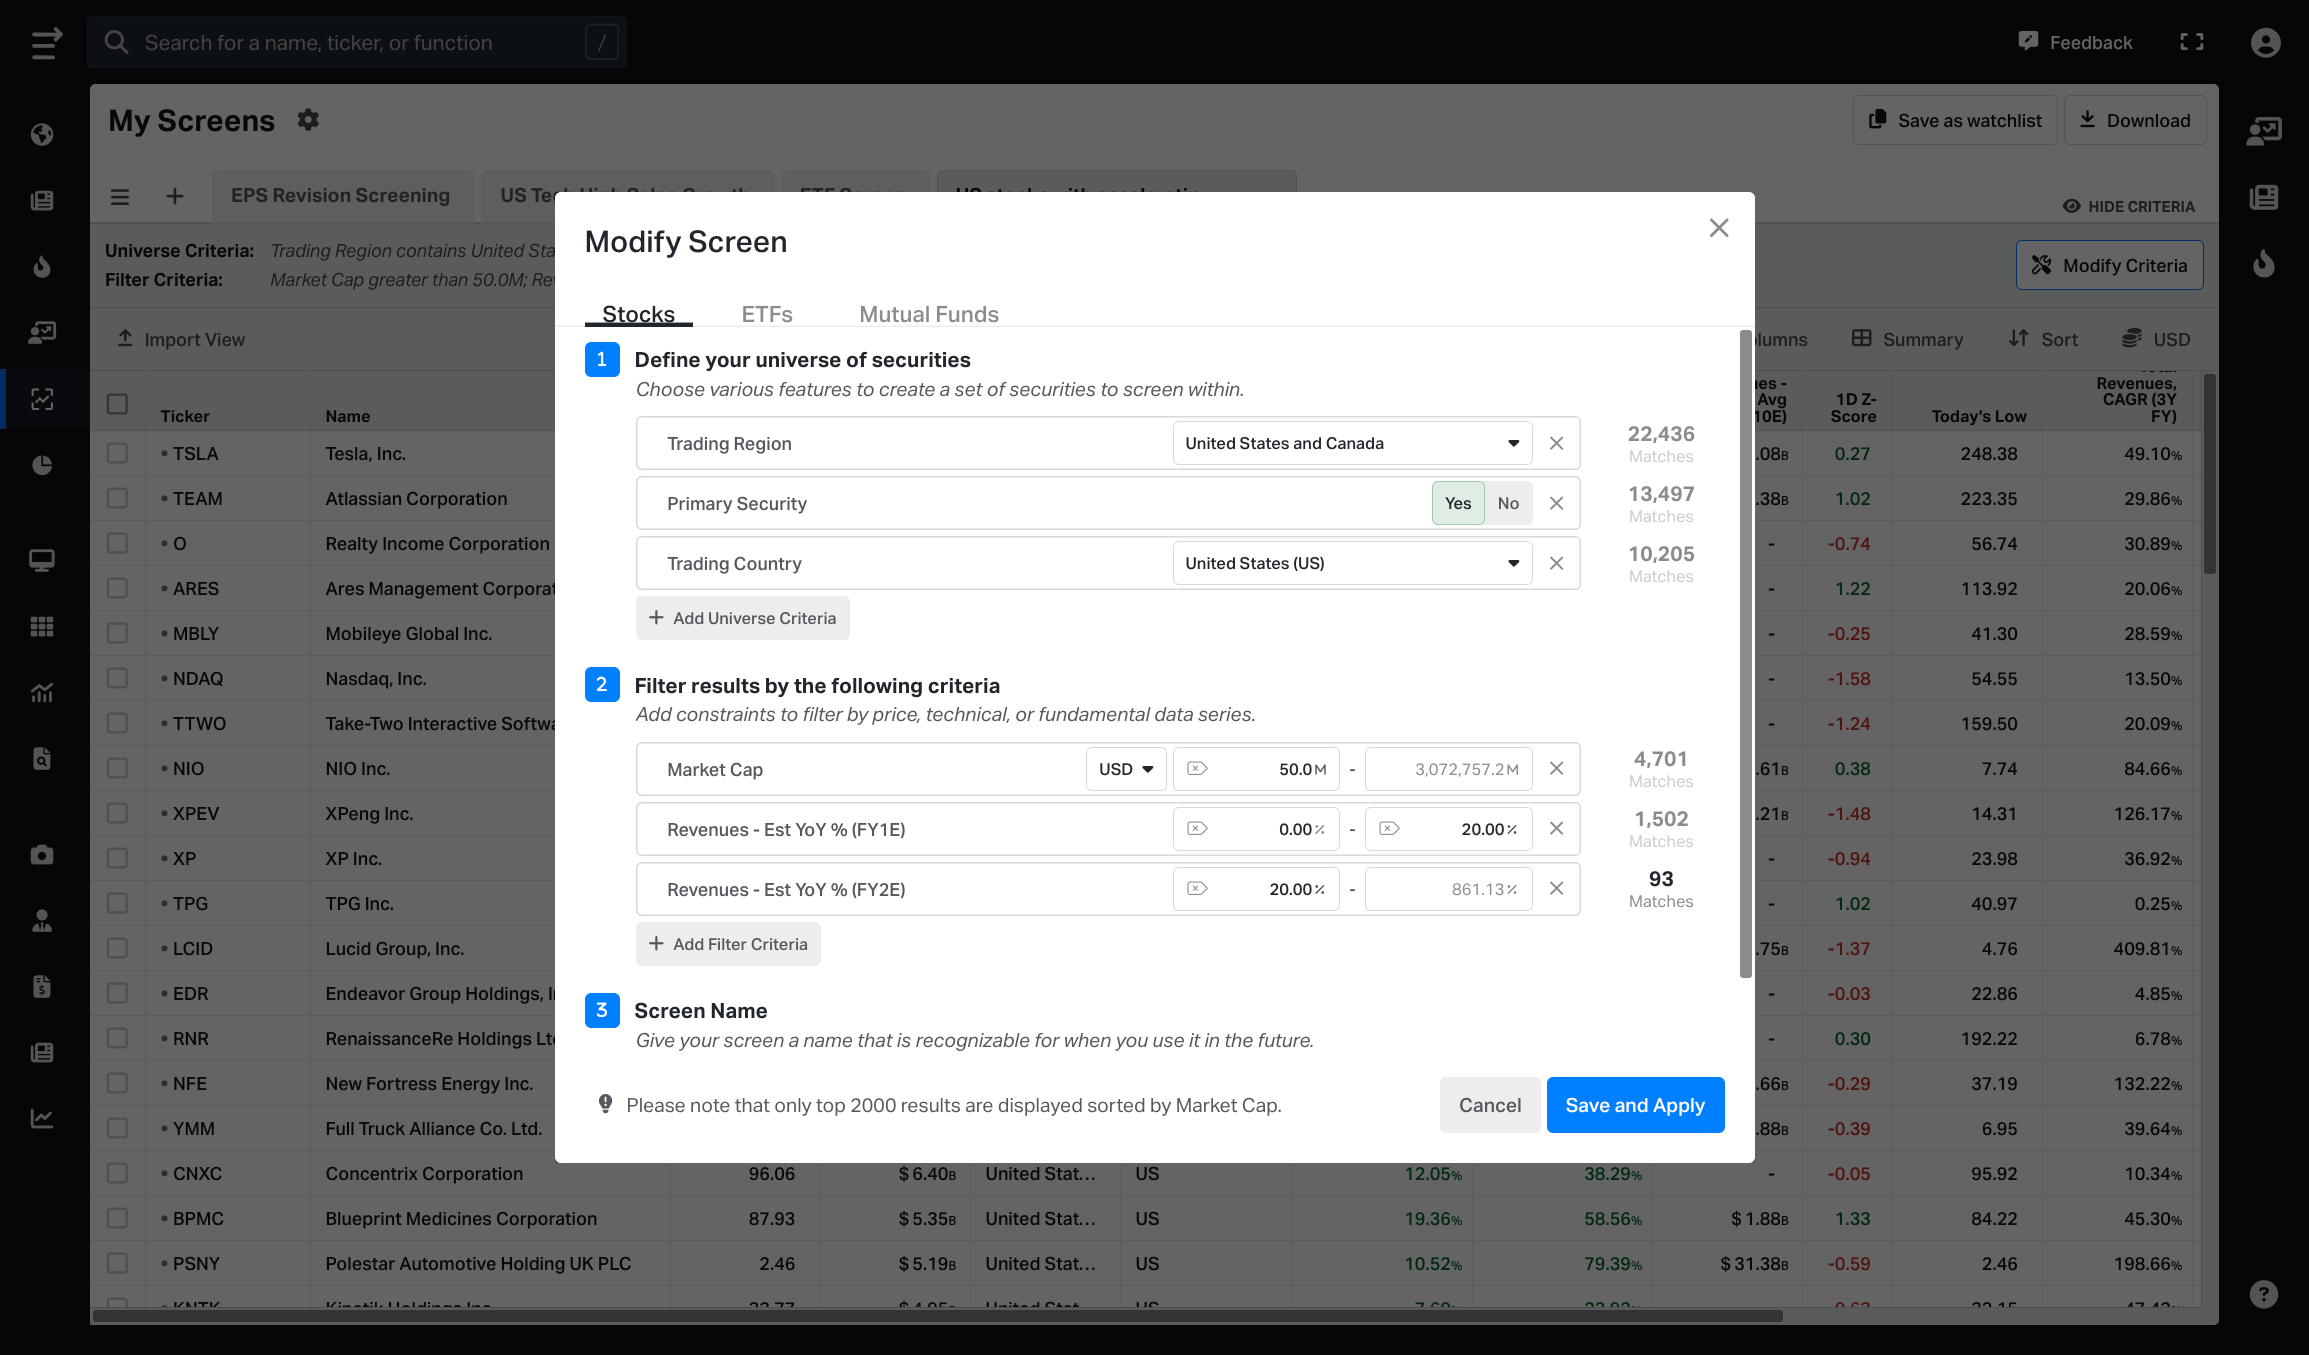
Equity screener is a tool that allows scanning through over 100K global securities using 5,900+ filter criteria to find your target companies. Add some filters and find securities that fit your style and criteria. Screen for stocks, ETFs or Mutual Funds to quickly and effectively grasp what is driving the market and spot potential opportunities. Learn more.
My Portfolio
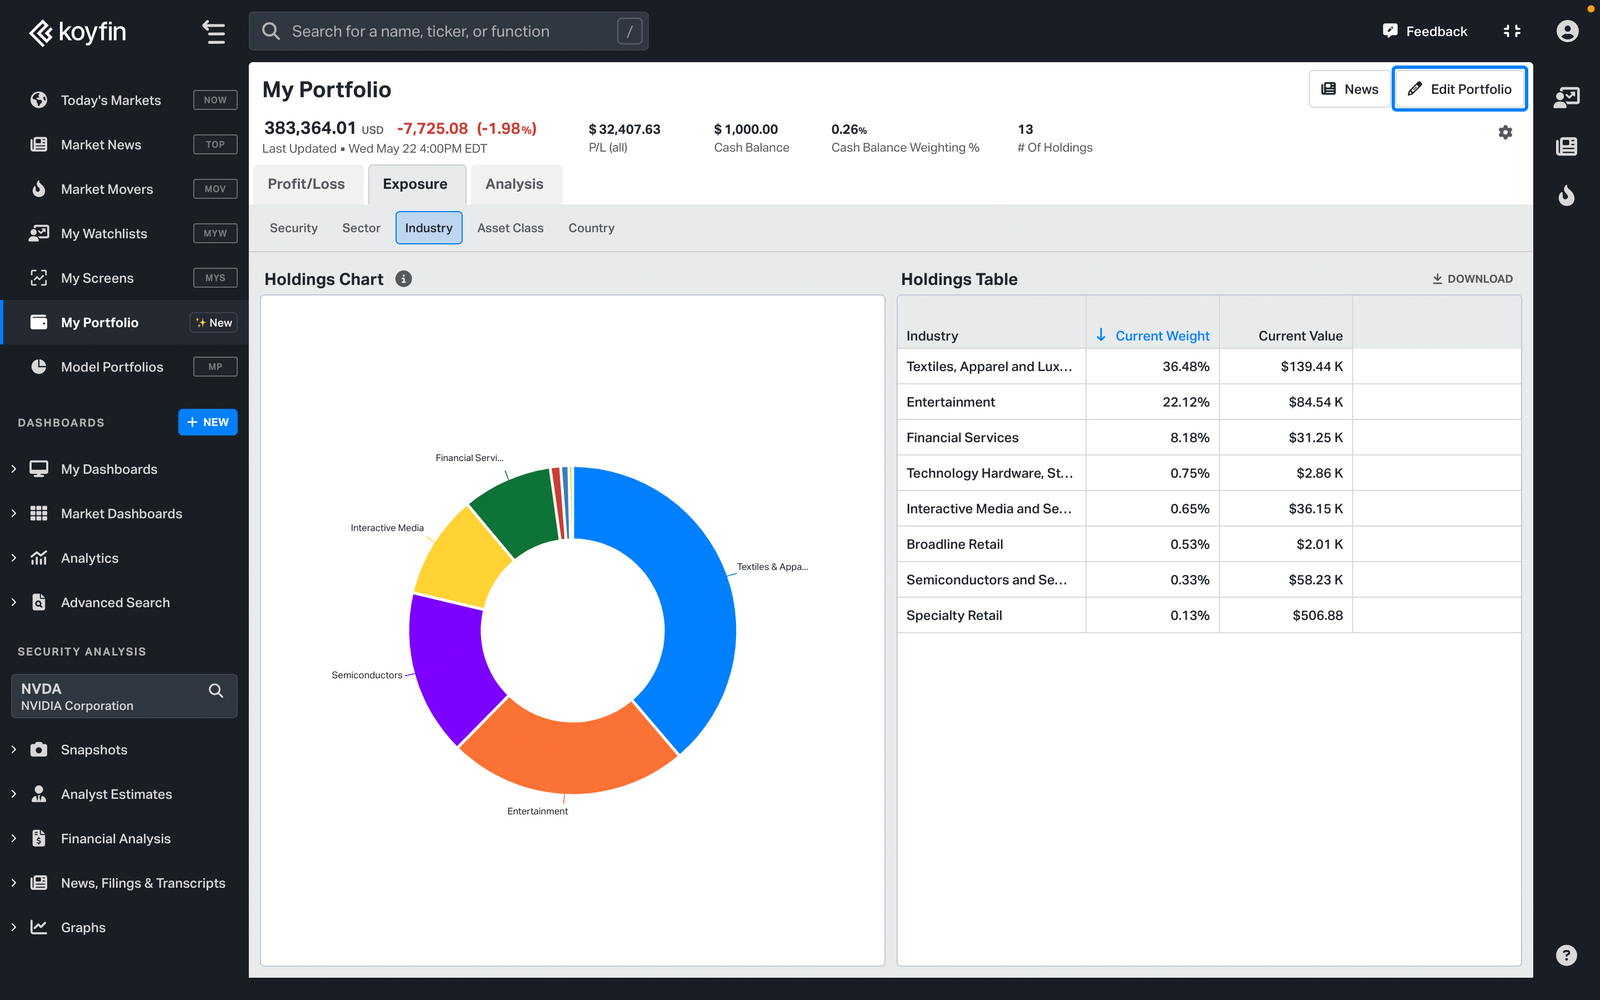
This powerful feature allows users to build a portfolio and track current holdings. Users can manage multiple accounts and track purchase date, quantity and average cost, as well as individual lots.
My Portfolio combines all holdings and displays P/L breakdowns by lot and parent, converted into a single portfolio currency and includes the impact of FX rate changes over time. Learn more.
Model Portfolios
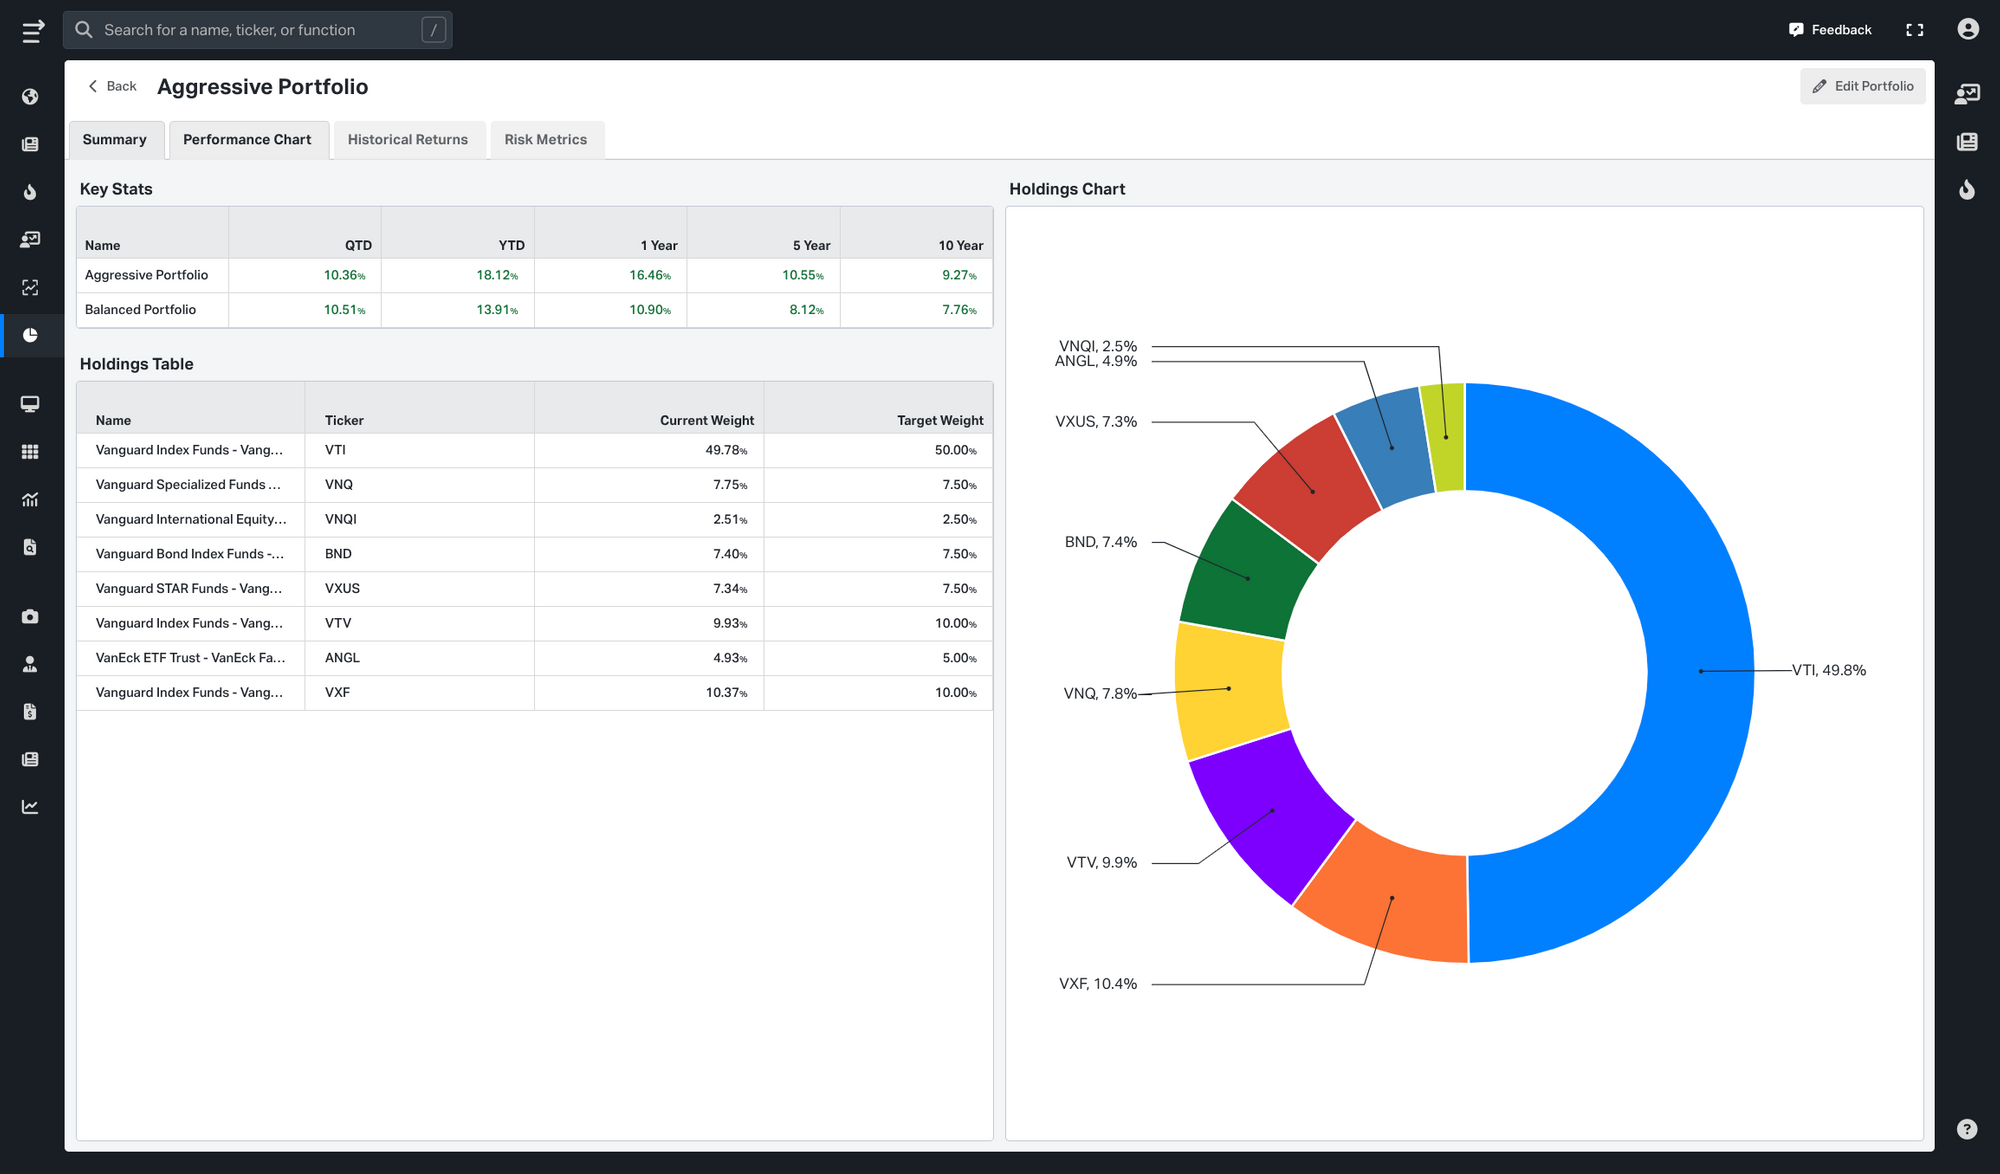
This powerful feature empowers users to build, analyze, and manage Model Portfolios. You can visualize portfolio performance, analyze risk metrics, and iterate on your target allocation. Learn more.
News
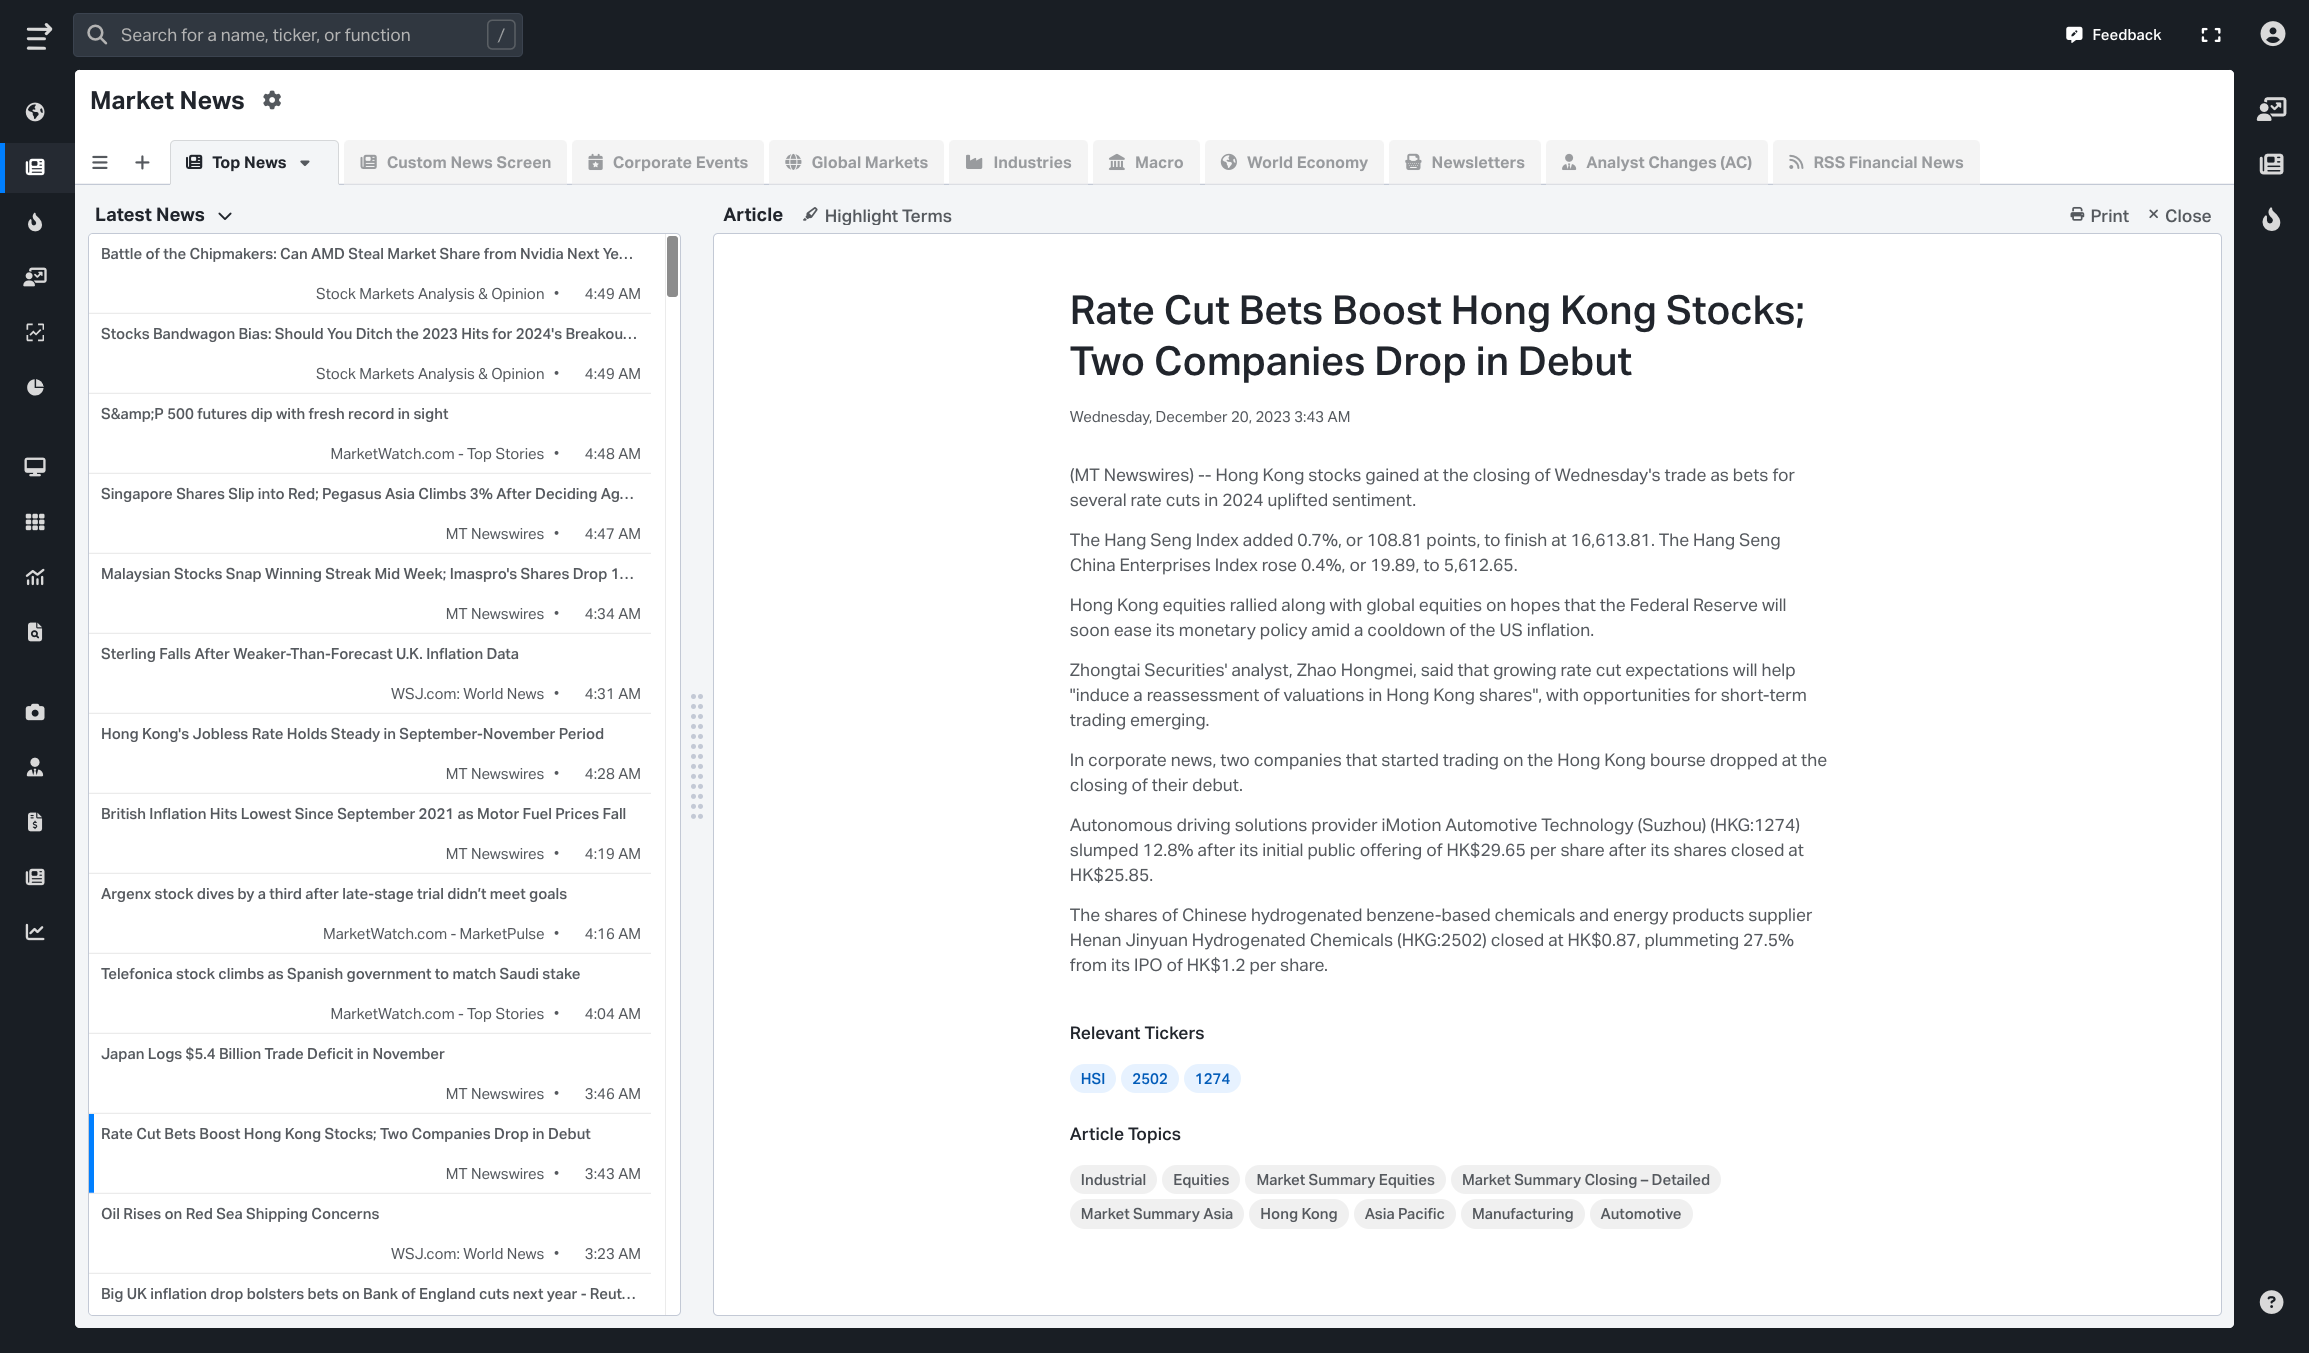
Explore our feature for timely updates on insider trading, analysts' recommendations, global economics, forex, and market trends. Access comprehensive market summaries, reliable corporate news analysis, and uninterrupted coverage across a variety of assets in North America, Europe, and Asia, all delivered with a global economic context. Learn more.
Graphs
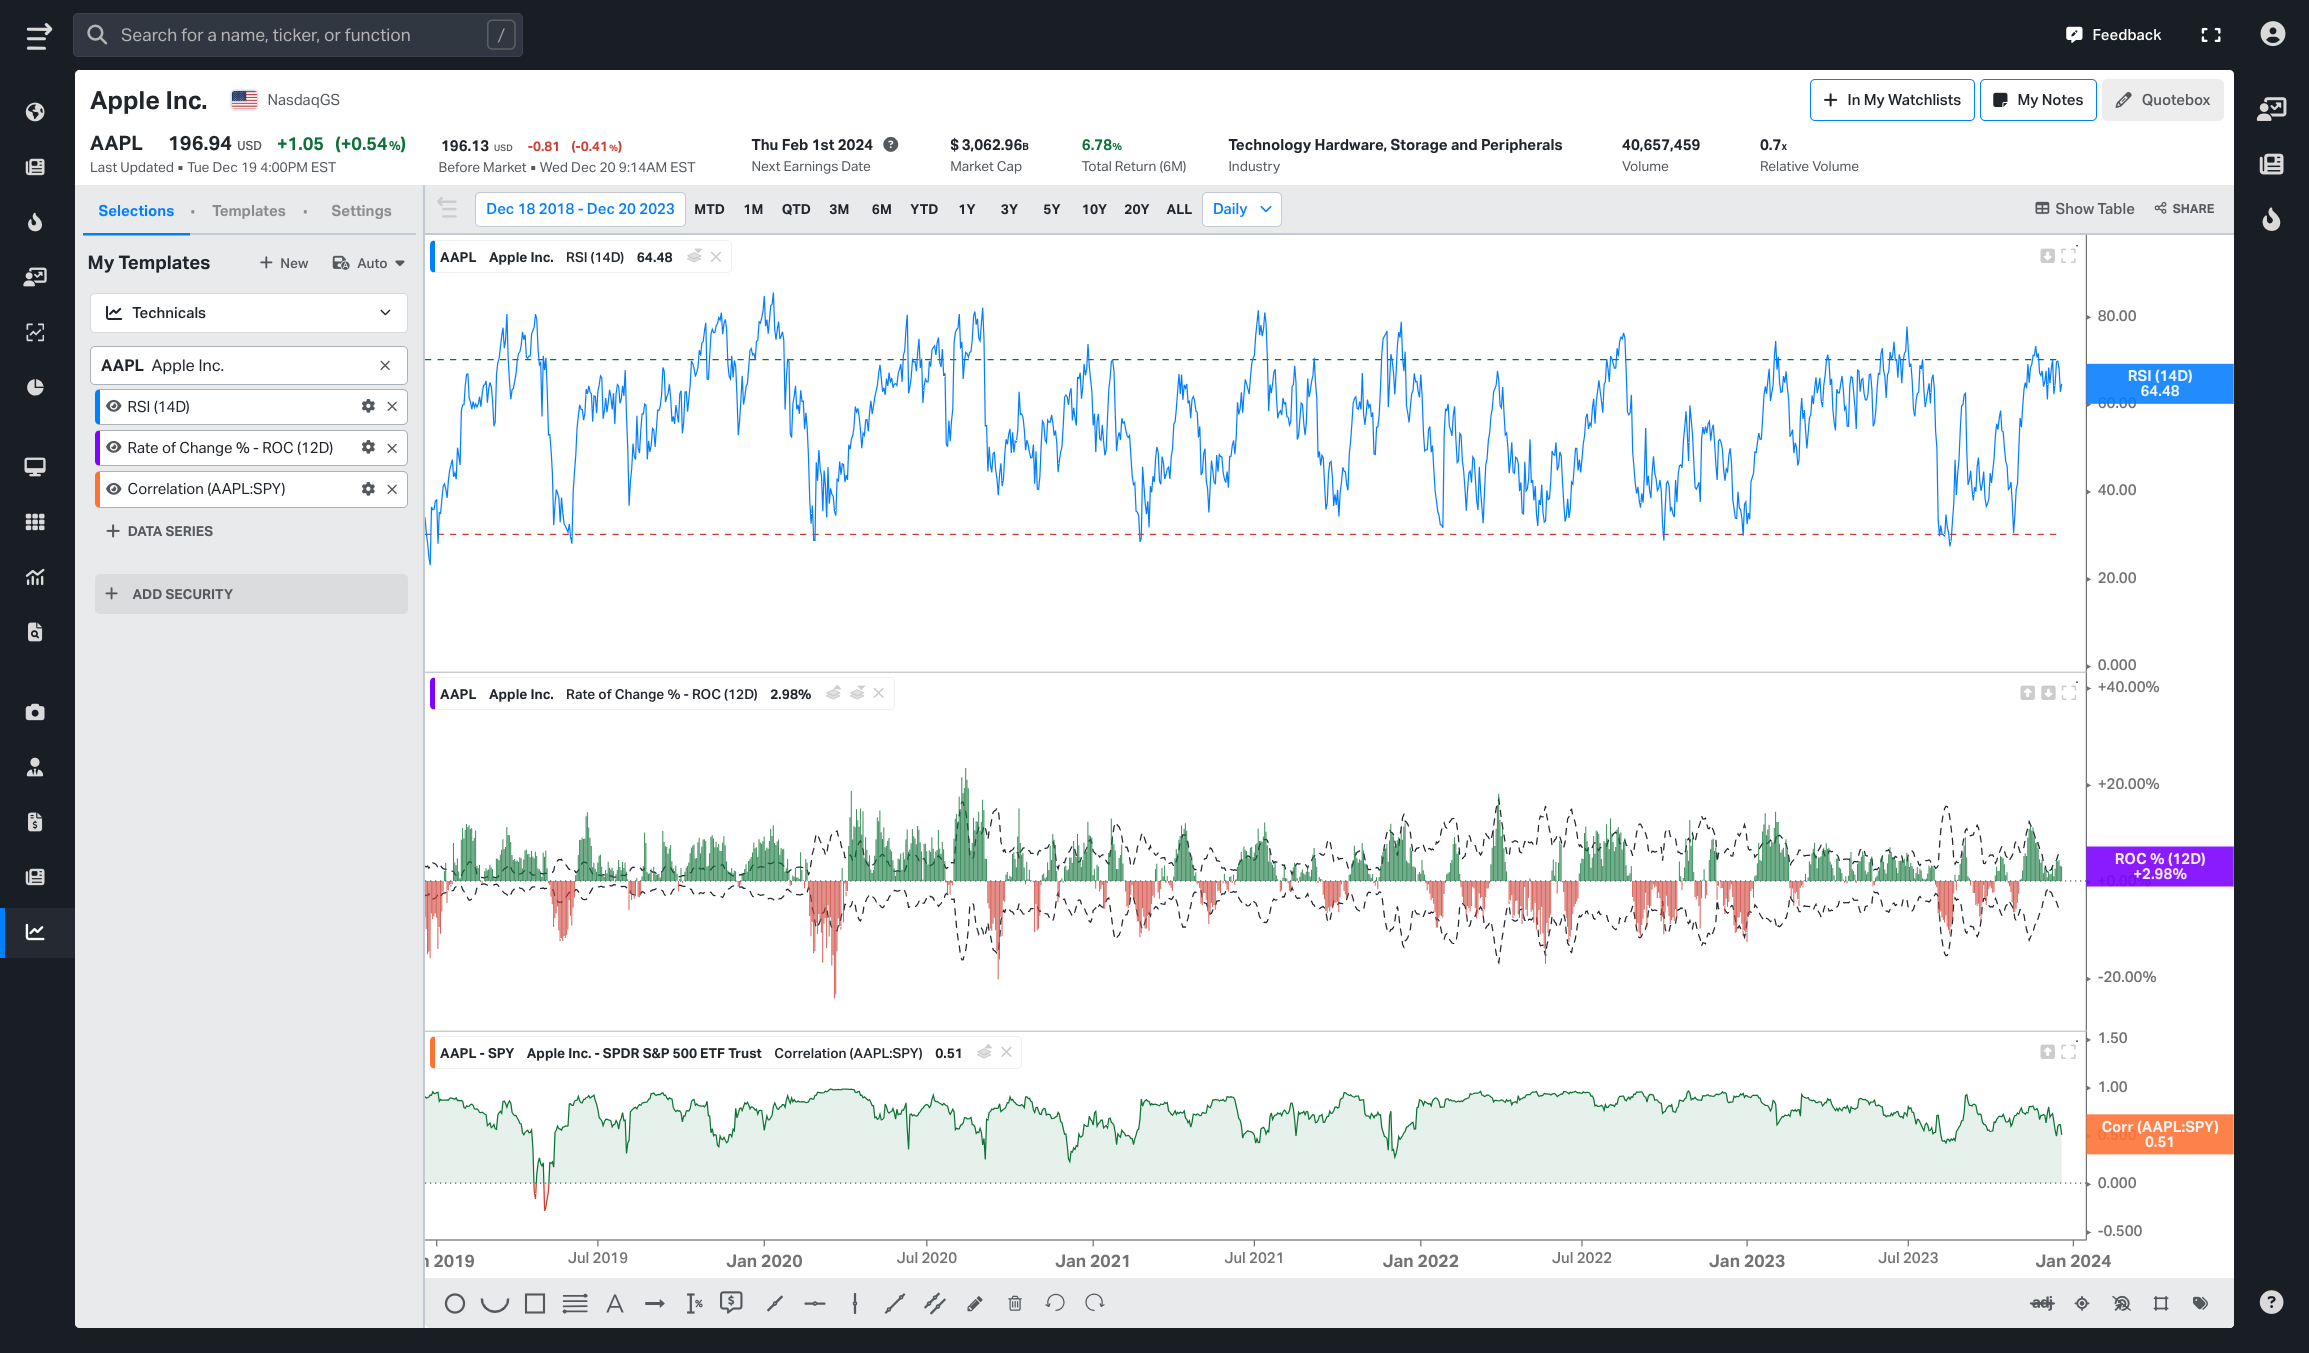
Koyfin offers advanced charting functionality to visualize financial trends. The Historical Graph (G) chart is the most flexible way to create a chart on Koyfin. You can graph any financial series on Koyfin, create chart templates or view data as a table. Learn more.
My Dashboards
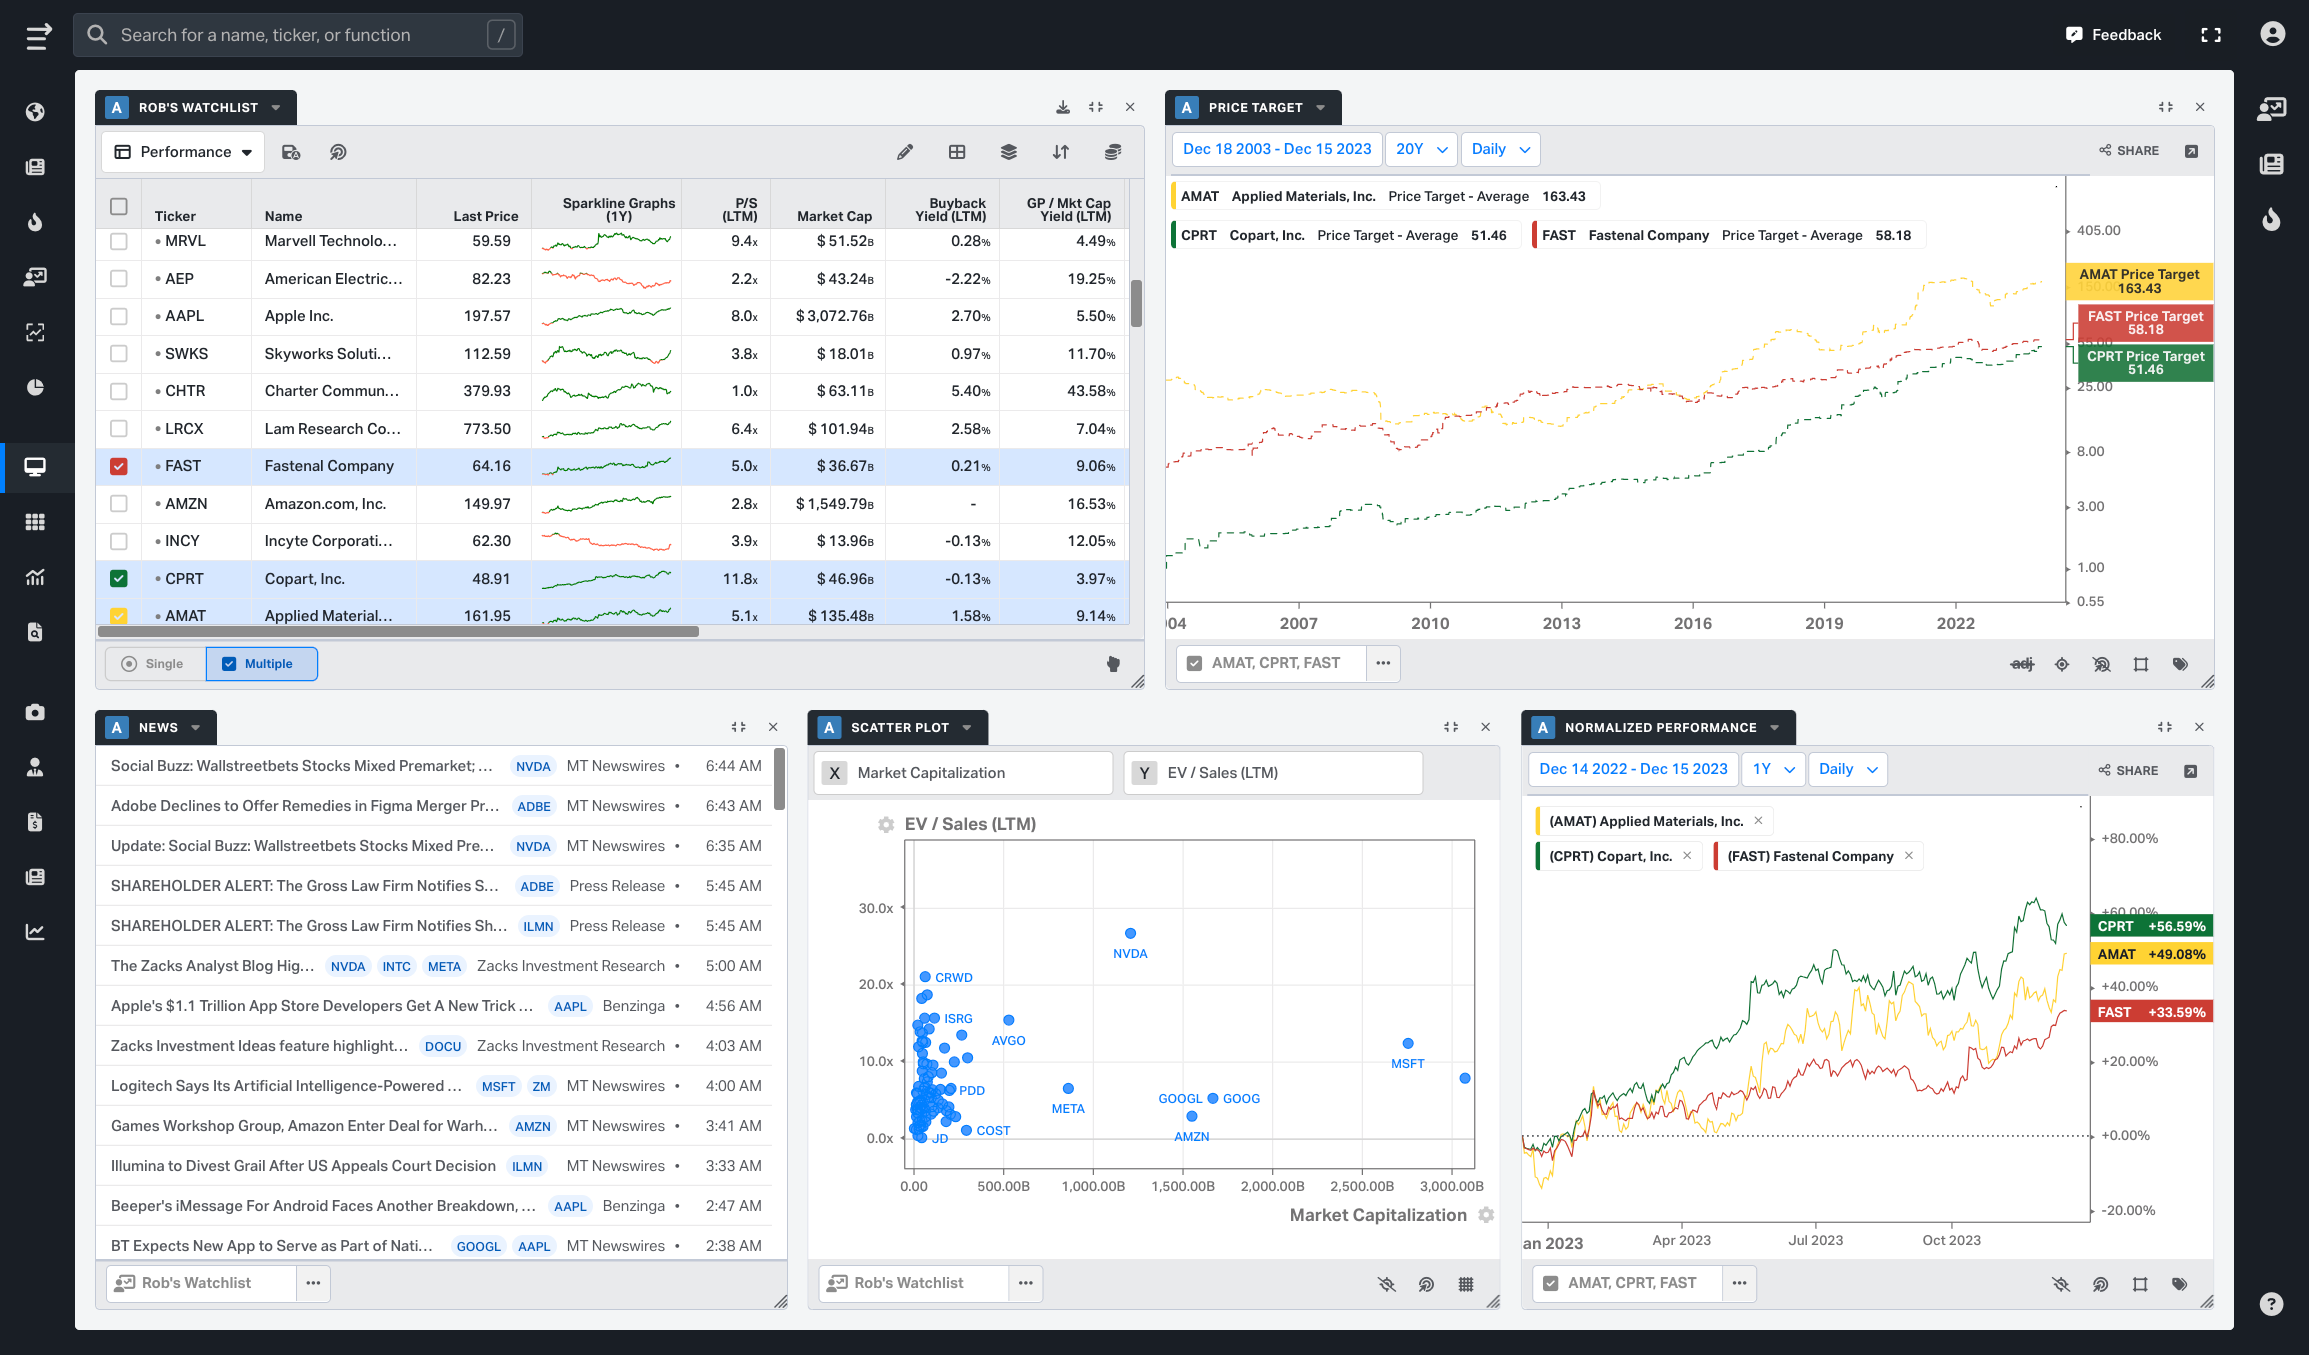
This feature is designed with user customization in mind. It offers the flexibility to create a personalized dashboard that meets individual requirements. You can add elements like watchlists, graphs, news feeds, and scatter plots to tailor your experience and access the information that matters most to them. Learn more
Market Dashboards - Browse cross-market dashboards created by Koyfin to explore market themes.
Analytics - Various tools to analyze financial data.
Security Analysis - Snapshots and charts to analyze individual securities like a stock, ETF, mutual fund, fx, or other data series.
Command & Search Bar
The command bar on top is a quick way to use shortcuts to find securities and charts instead of navigating through the side menu. Professional terminals such as Bloomberg and Reuters also have shortcut navigation to allow users to move quickly through the system. To quickly activate the command bar, use the “/” key on your keyboard. Learn more.