Koyfin offers professional-grade mutual fund data sourced from Morningstar and analytics to research performance, trends, and risks. You can access mutual fund snapshots, historical price and performance graphs, track the performance of your own mutual fund portfolio, and customize your mutual fund watchlists with over 50 data points such as AUM, asset type, expense ratio valuation, distribution frequency, etc.
Note: US & Canadian mutual fund data in the Advisor Core and Advisor Pro plans.
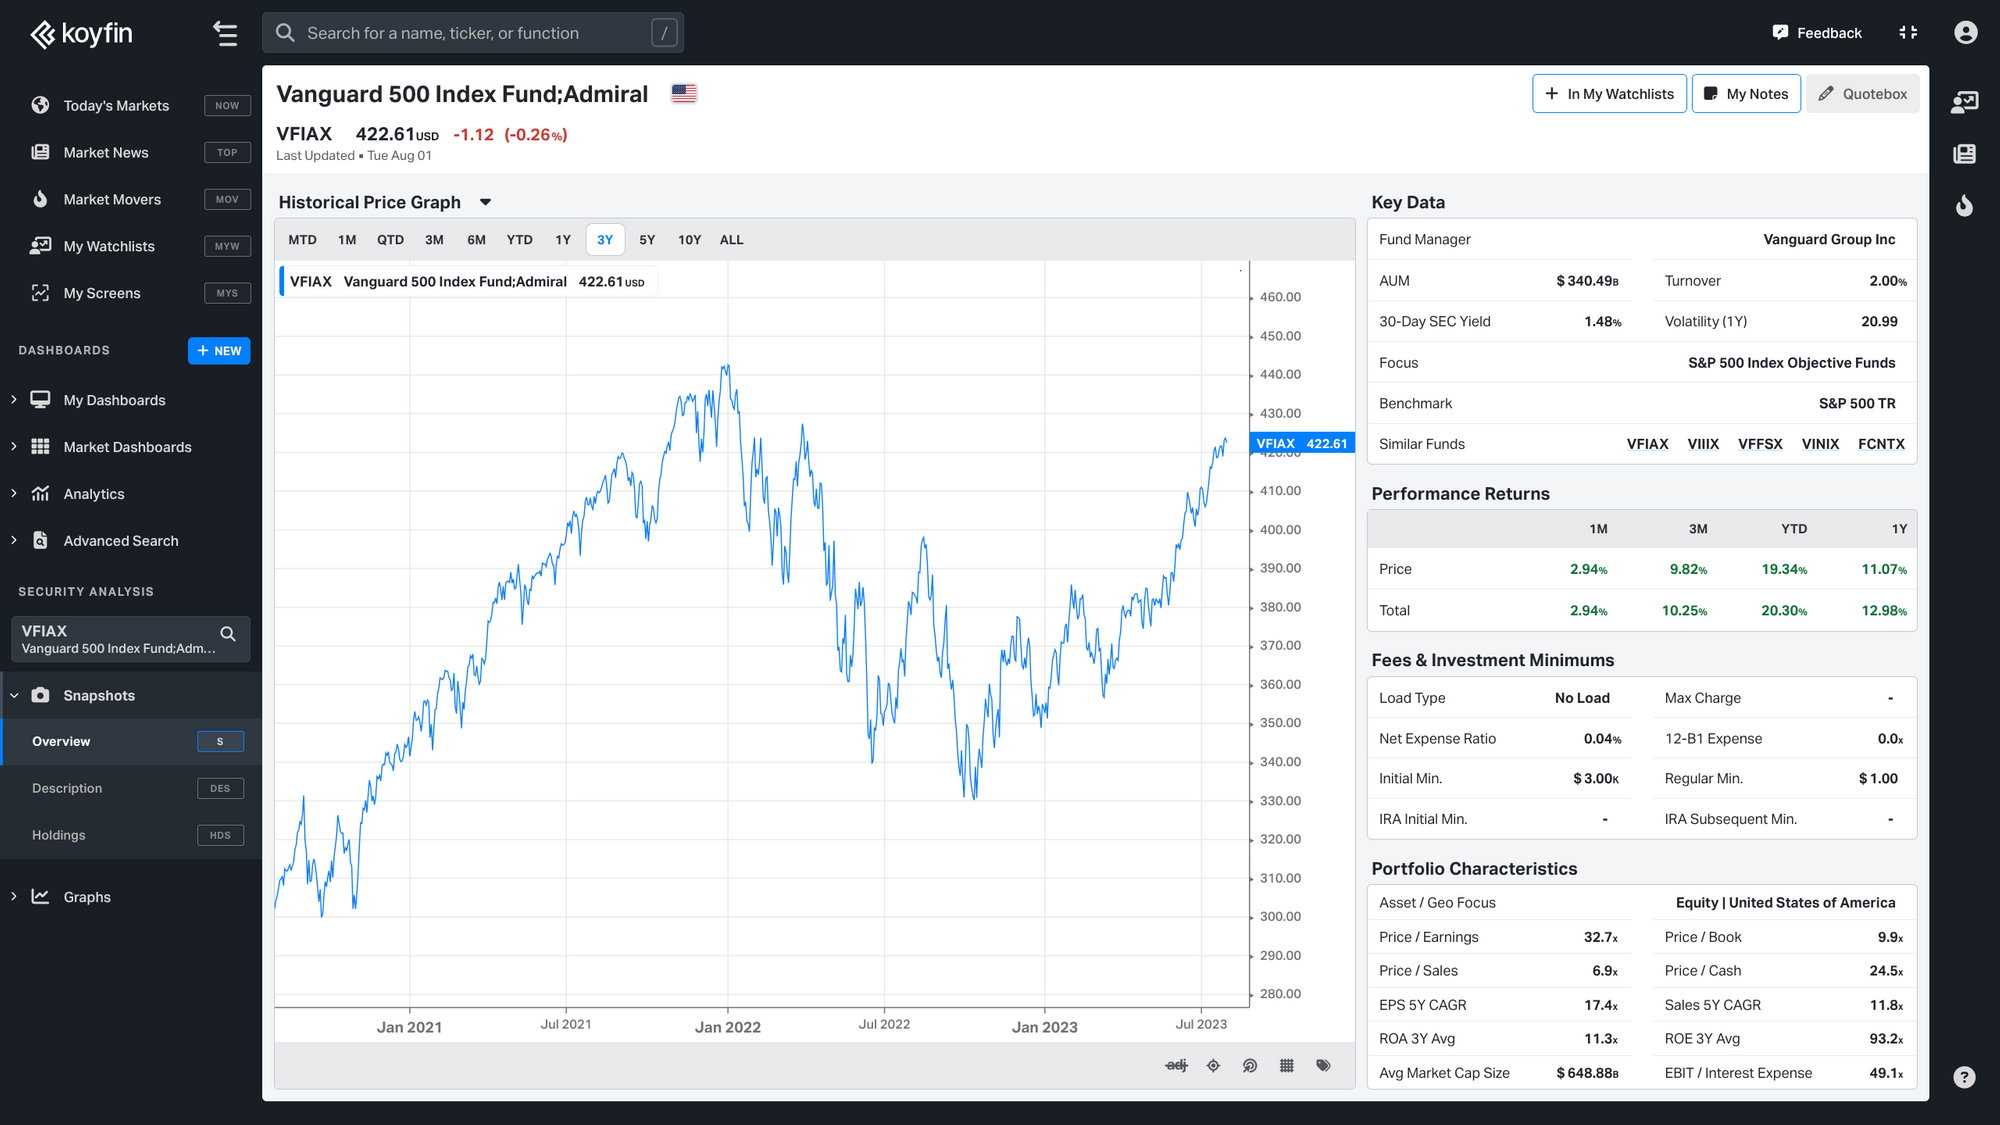
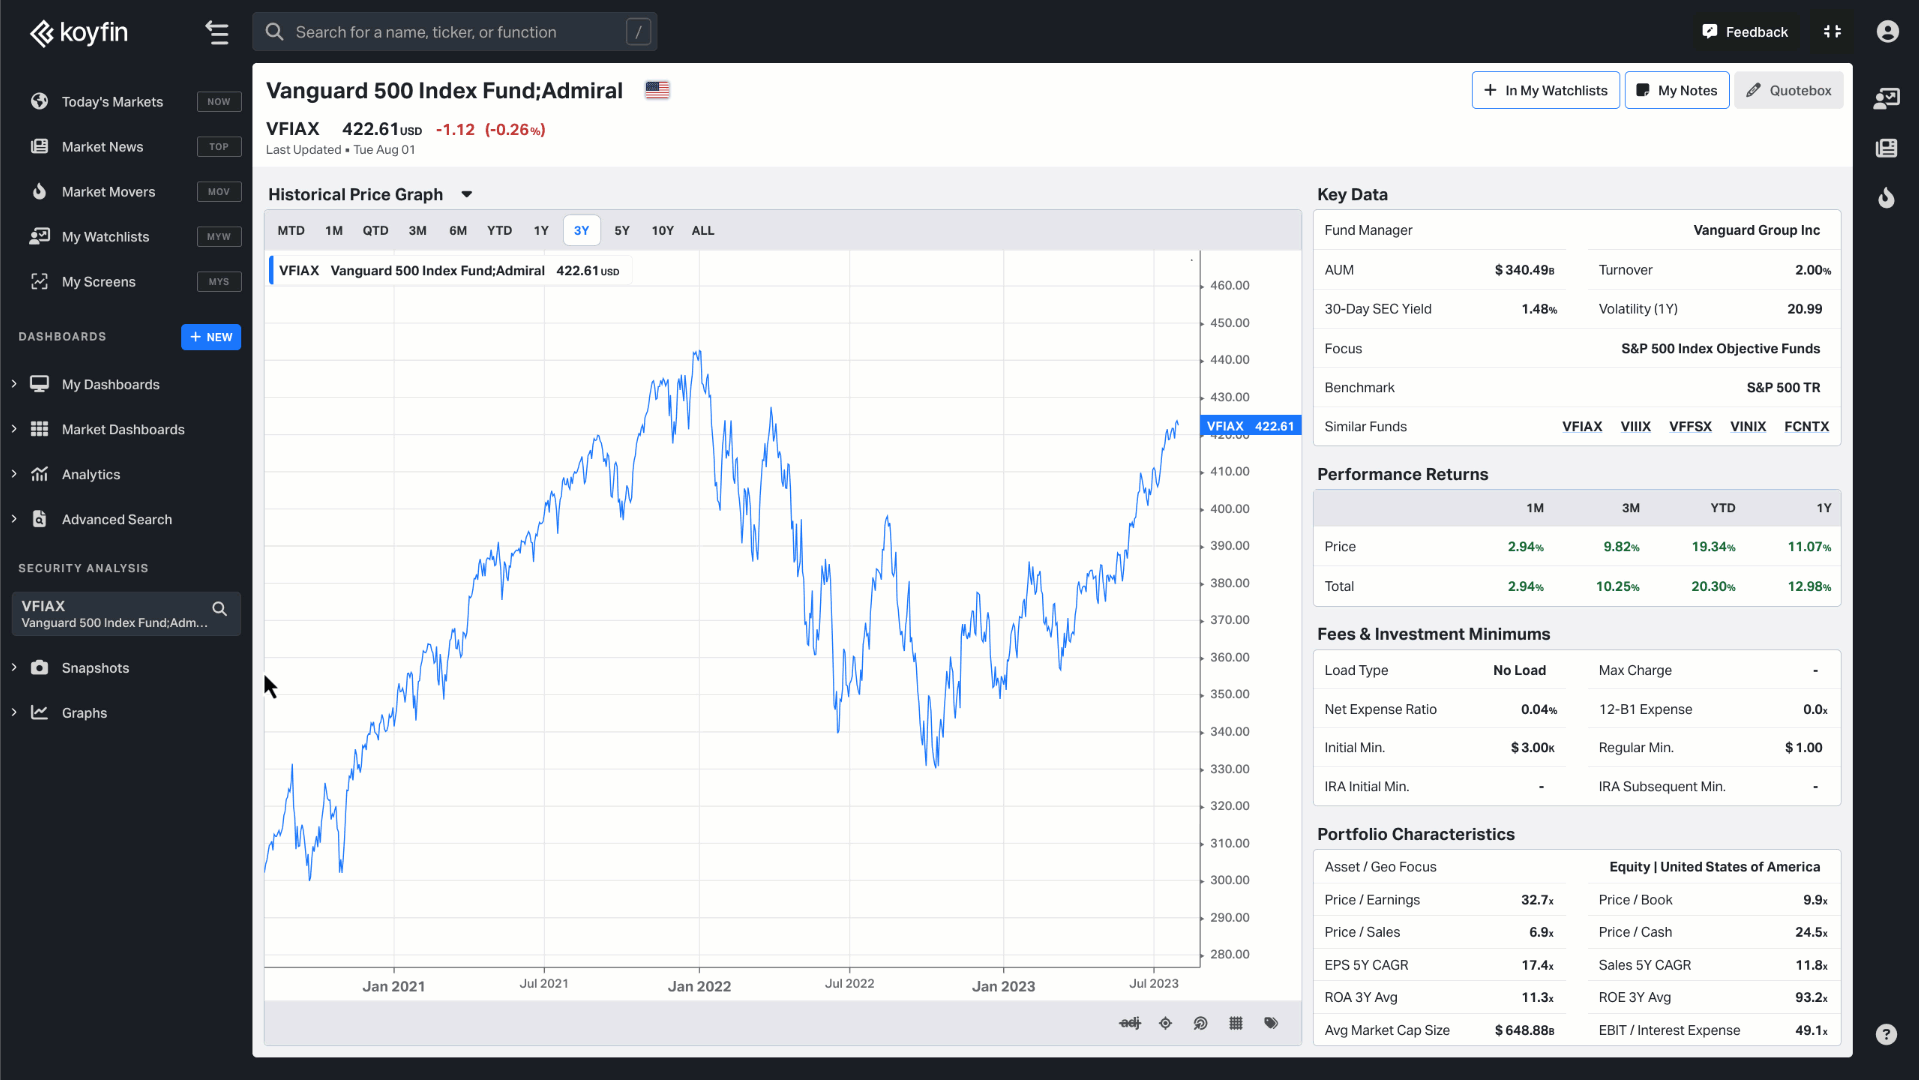
Mutual Fund Snapshots
Overview and Description snapshots provide you with the key data on the mutual funds of your choice all on one screen.
You can access mutual fund snapshots either from the left-side search box or the top command bar.
I. In the left-side bar, select the search box, and type in a mutual fund ticker or name. Then click on Snapshots → Overview (S) or Description (DES).

II. The other way is to click on the top command bar or enable it with the backslash “/” key on your keyboard. Then type a mutual fund name → press <enter> → type S or DES → press <enter> again.
For example:
VTSAX <enter> S <enter> opens the Overview snapshot for Vanguard Total Stock Market Index Fund
VFIAX <enter> DES <enter> pulls up the Description snapshot for Vanguard 500 Index Fund

The Snapshot page shows a graph of historical performance starting at $10,000 and the quarterly returns below that. The right-hand side shows key data, performance statistics, fees, and portfolio characteristics like P/E and average market cap.
Mutual Fund Graphs
Historical price
Track the historical price and other historical series in the G chart. By default, the price is adjusted for dividend payments so that the total return performance is reflected in the price chart. You can also add other series to the G chart.
- Investment Growth — The simulated performance if you invested $10,000 at the start of the graph
- Total Return — The cumulative % change over the time period selected, starting with 0% at the beginning of the graph
- Total Return, Periodic — The total return for a given period (for example, the total return every month or every quarter)
- Beta — The 1-year beta of the mutual fund vs. the selected benchmark (SPY by default). To change the benchmark, click on the settings tile with the Mutual Fund ticker.
- Correlation — The 1-month correlation with the selected benchmark (SPY by default). To change the benchmark or correlation window, click on the settings tile with the Mutual Fund ticker.
- Volatility — The realized volatility over the selected time period
Performance graph
Use the Performance Graph function to compare the performance of the mutual fund vs. other mutual funds or other assets like equities and ETFs.
To pull up the mutual fund graphs, repeat the similar actions as with snapshots:
I. In the left-side bar, type the mutual fund name into the search box and open Graphs → Historical Graph (G) or Performance (GM).
II. Alternatively, on the top command bar, type a mutual fund name or ticker → press <enter> → type G for a historical graph or GM for performance graph→ press <enter> again.
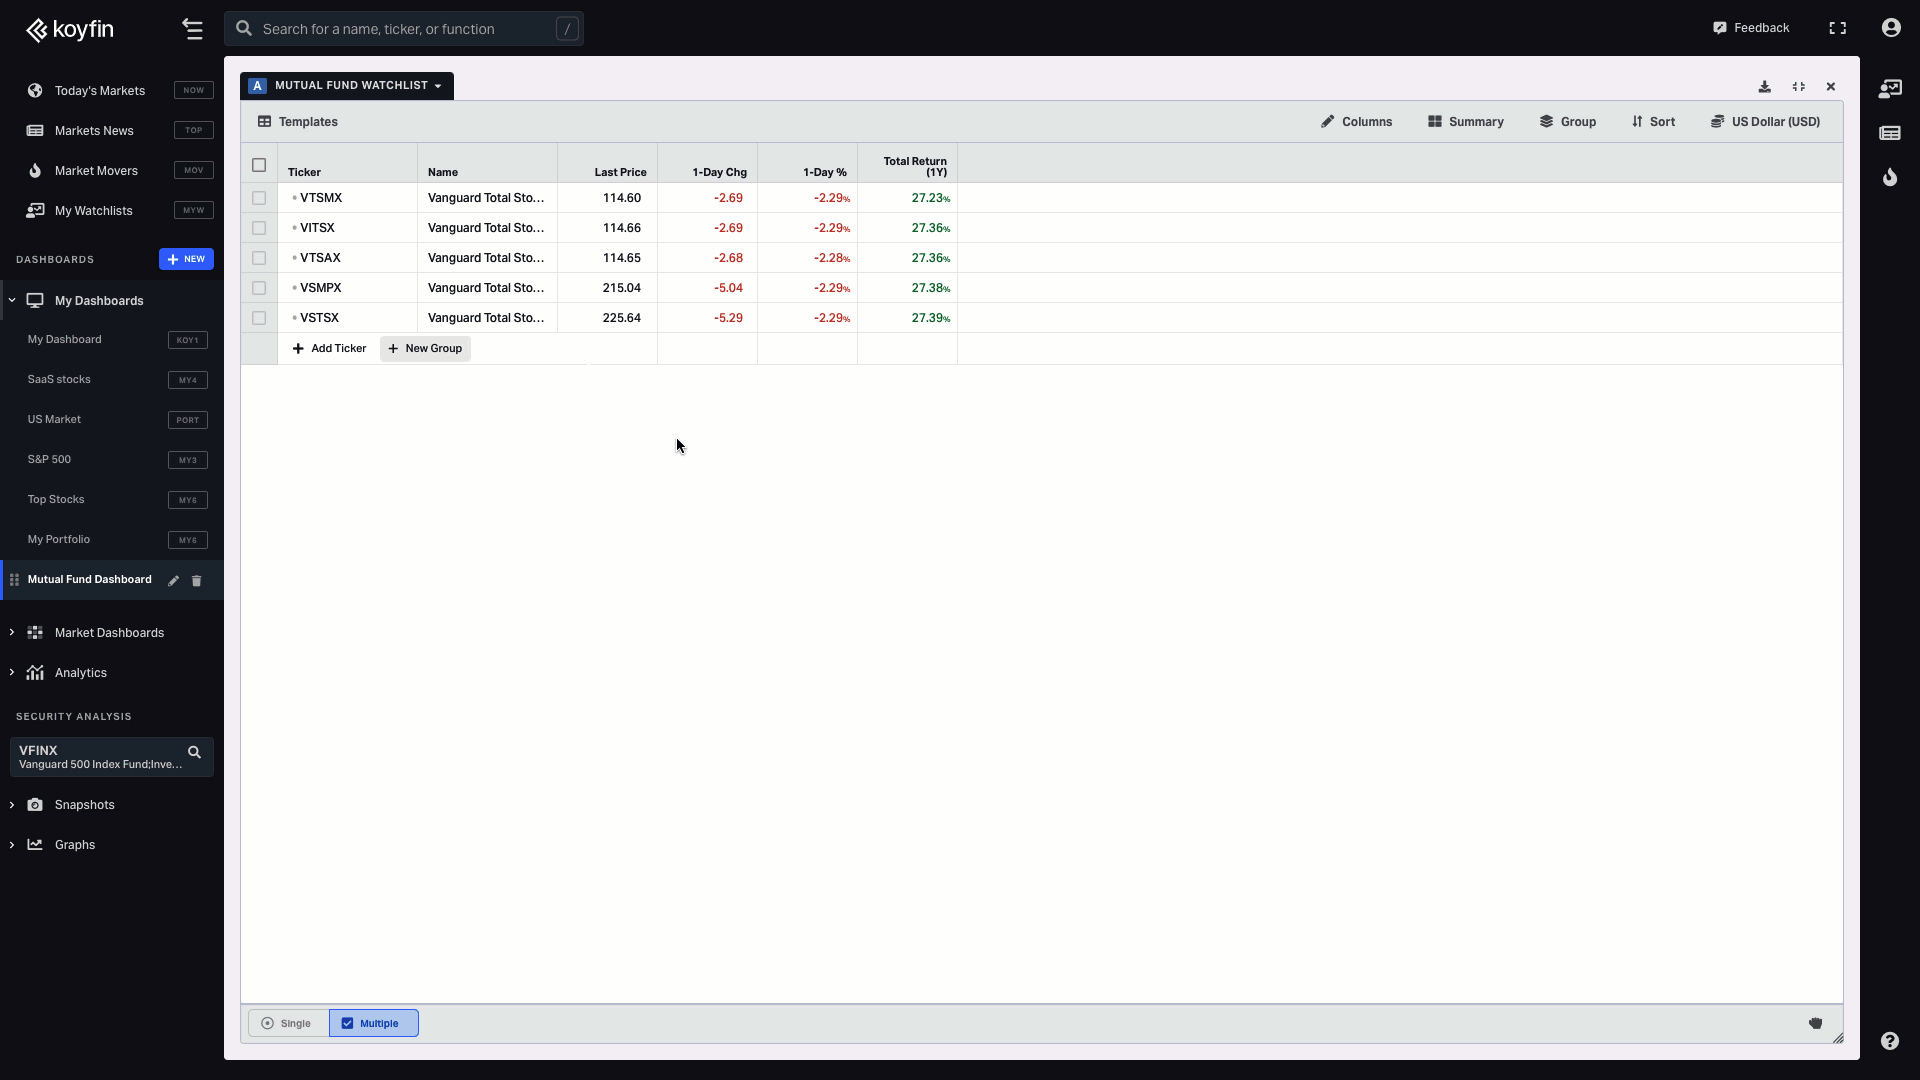
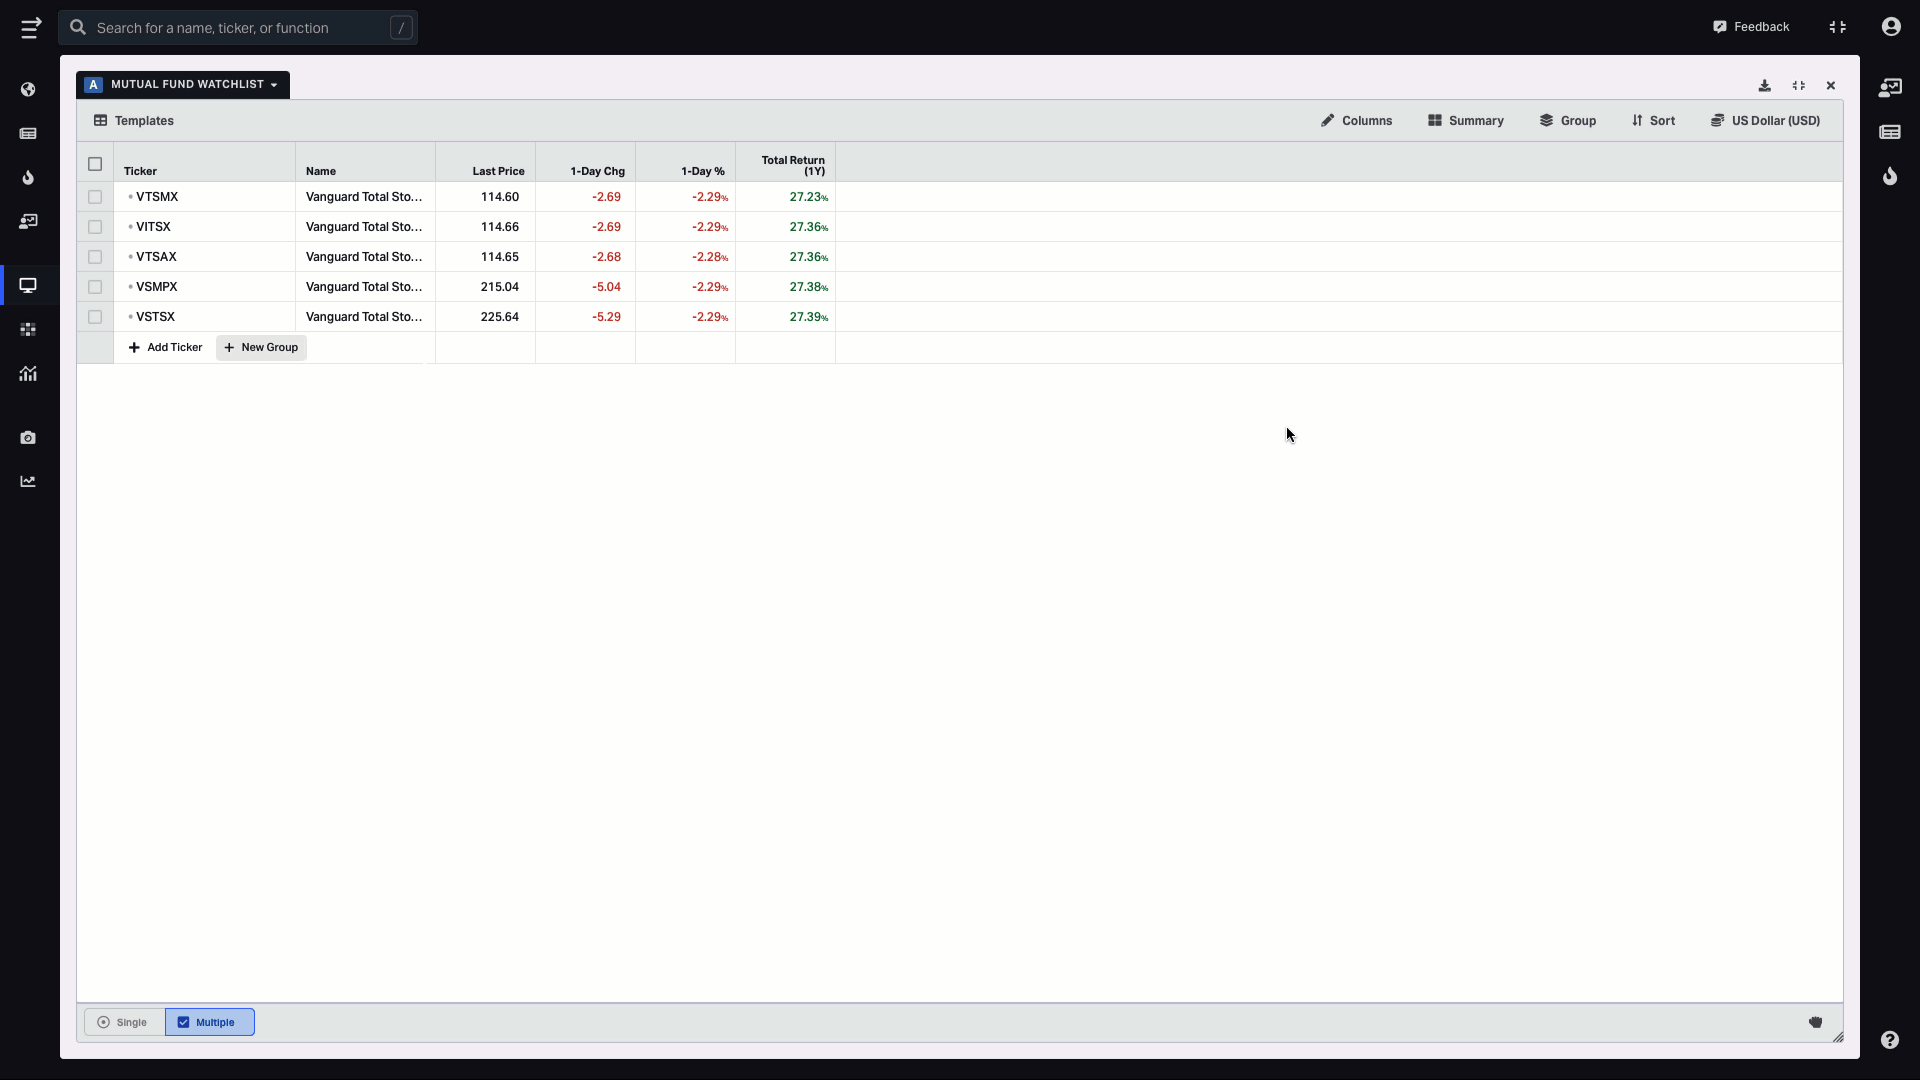
Custom mutual fund watchlist
You can create a mutual fund watchlist in the My Dashboards section for greater customizability and tracking.
To create a watchlist, click on the +New button in the left sidebar in the Dashboards section. Then choose a Watchlist template to open up a full-screen dashboard with a table view. Add mutual funds tickers to a watchlist by clicking on Add Ticker or Import Securities for bulk upload.
Then customize the columns with the suitable metrics you’d like to track. Click on ✏️ Columns and choose from the extensive collection of data points on Koyfin. For example, go to the Price & Performance data category and add Total Return % (1M / 6M / YTD), and Rolling Annualized Performance (3 years / 5 years / 10 years) columns.
You can also select from 50+ mutual-fund-specific metrics such as 30-Day Yield, Fund Benchmark, and Fund Total Net Assets. For that click on the Asset Specific data category and choose Mutual Fund. All your column selections save automatically.
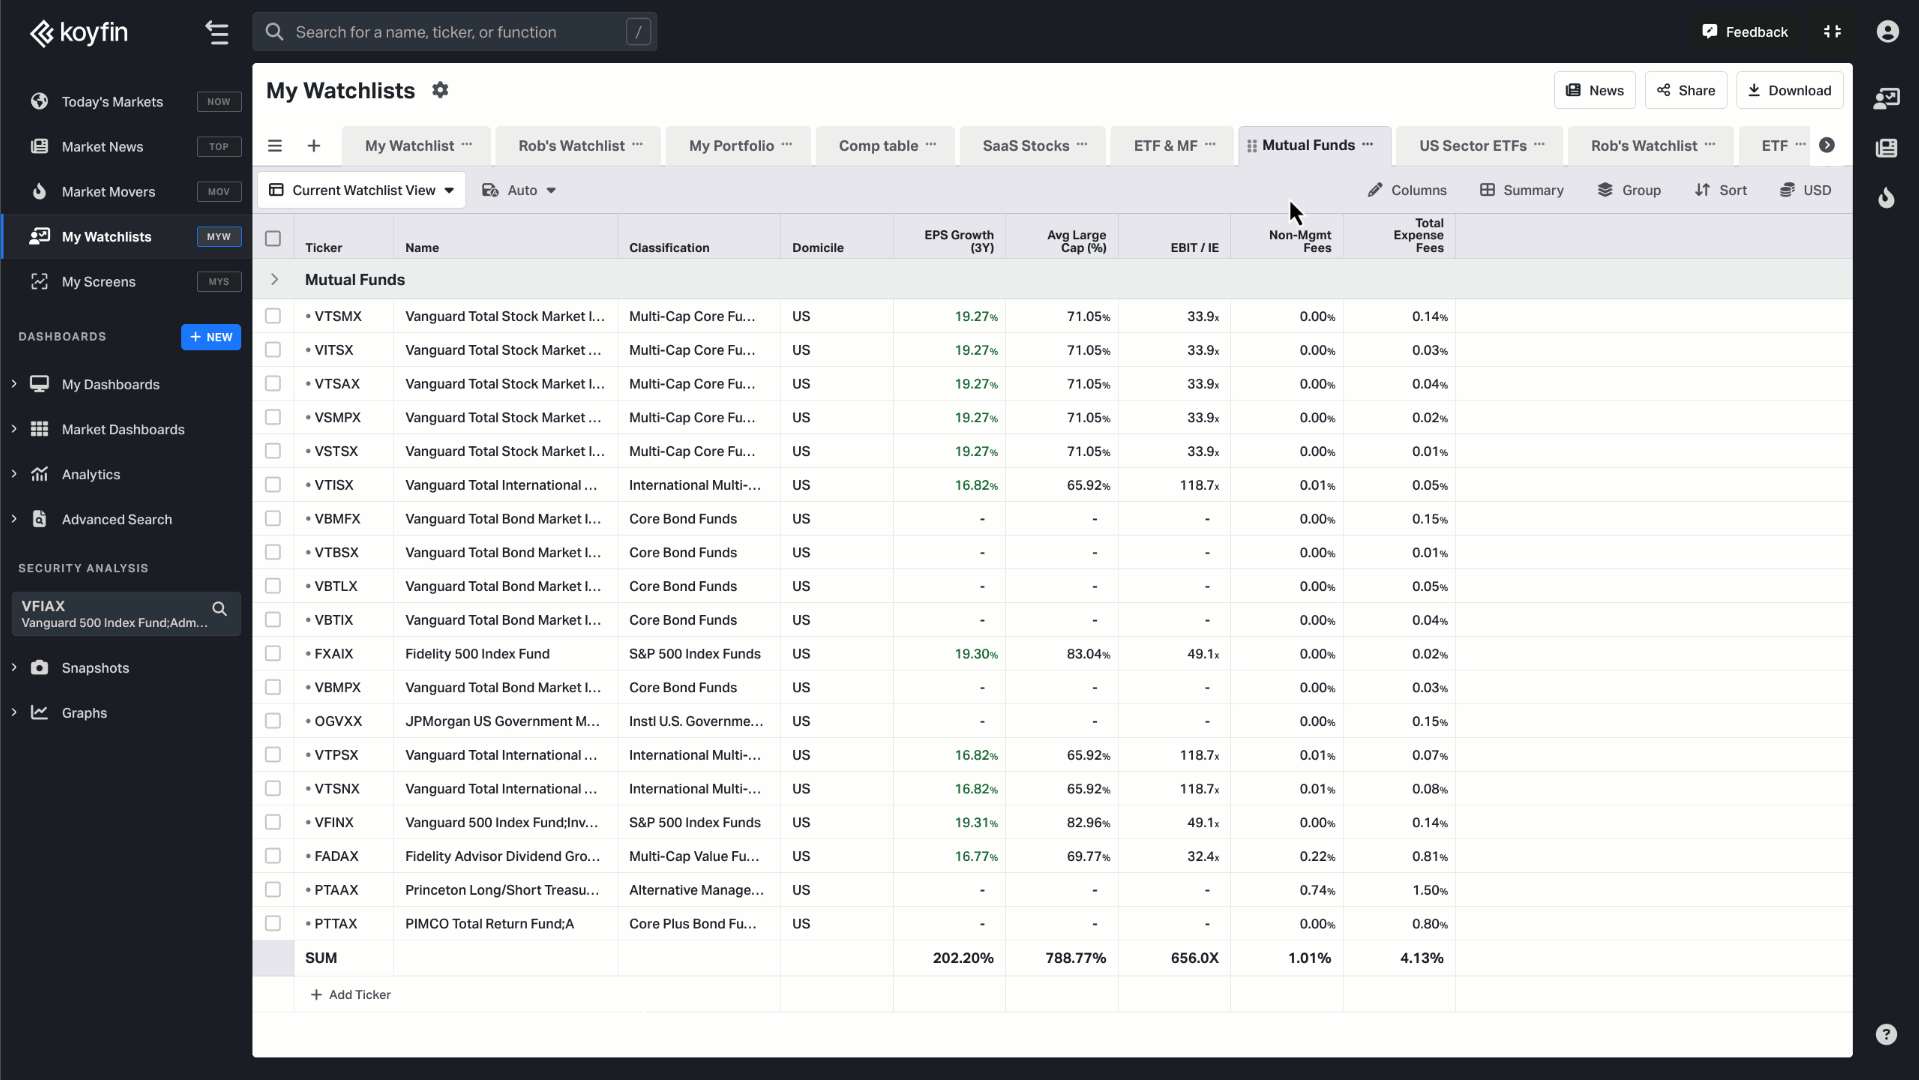
Table View
You can preserve all your portfolio settings by saving them as a watchlist view, allowing you to conveniently reuse them in your future watchlists.
Explore further insights on table views in detailed help article.
Mutual fund portfolio
If you wish to track the performance of your own mutual fund portfolio, create a dashboard with the mutual funds tickers of your choice. Similar to the steps from the previous section, click on the +New button in the left sidebar under My Dashboards, choose a Watchlist template, and add mutual funds by clicking on the Add Ticker button.
Then go to ✏️ Columns, choose Portfolio Tools and select the metrics for your portfolio analysis such as Quantity, Weight, or Market value. If you wish to rearrange the order of columns, you can do so under the Selected columns section.
Now that you have a list of securities of your own mutual fund portfolio, you can insert the number of shares that you own into the Quantity column. The rest of the columns will be counted automatically.
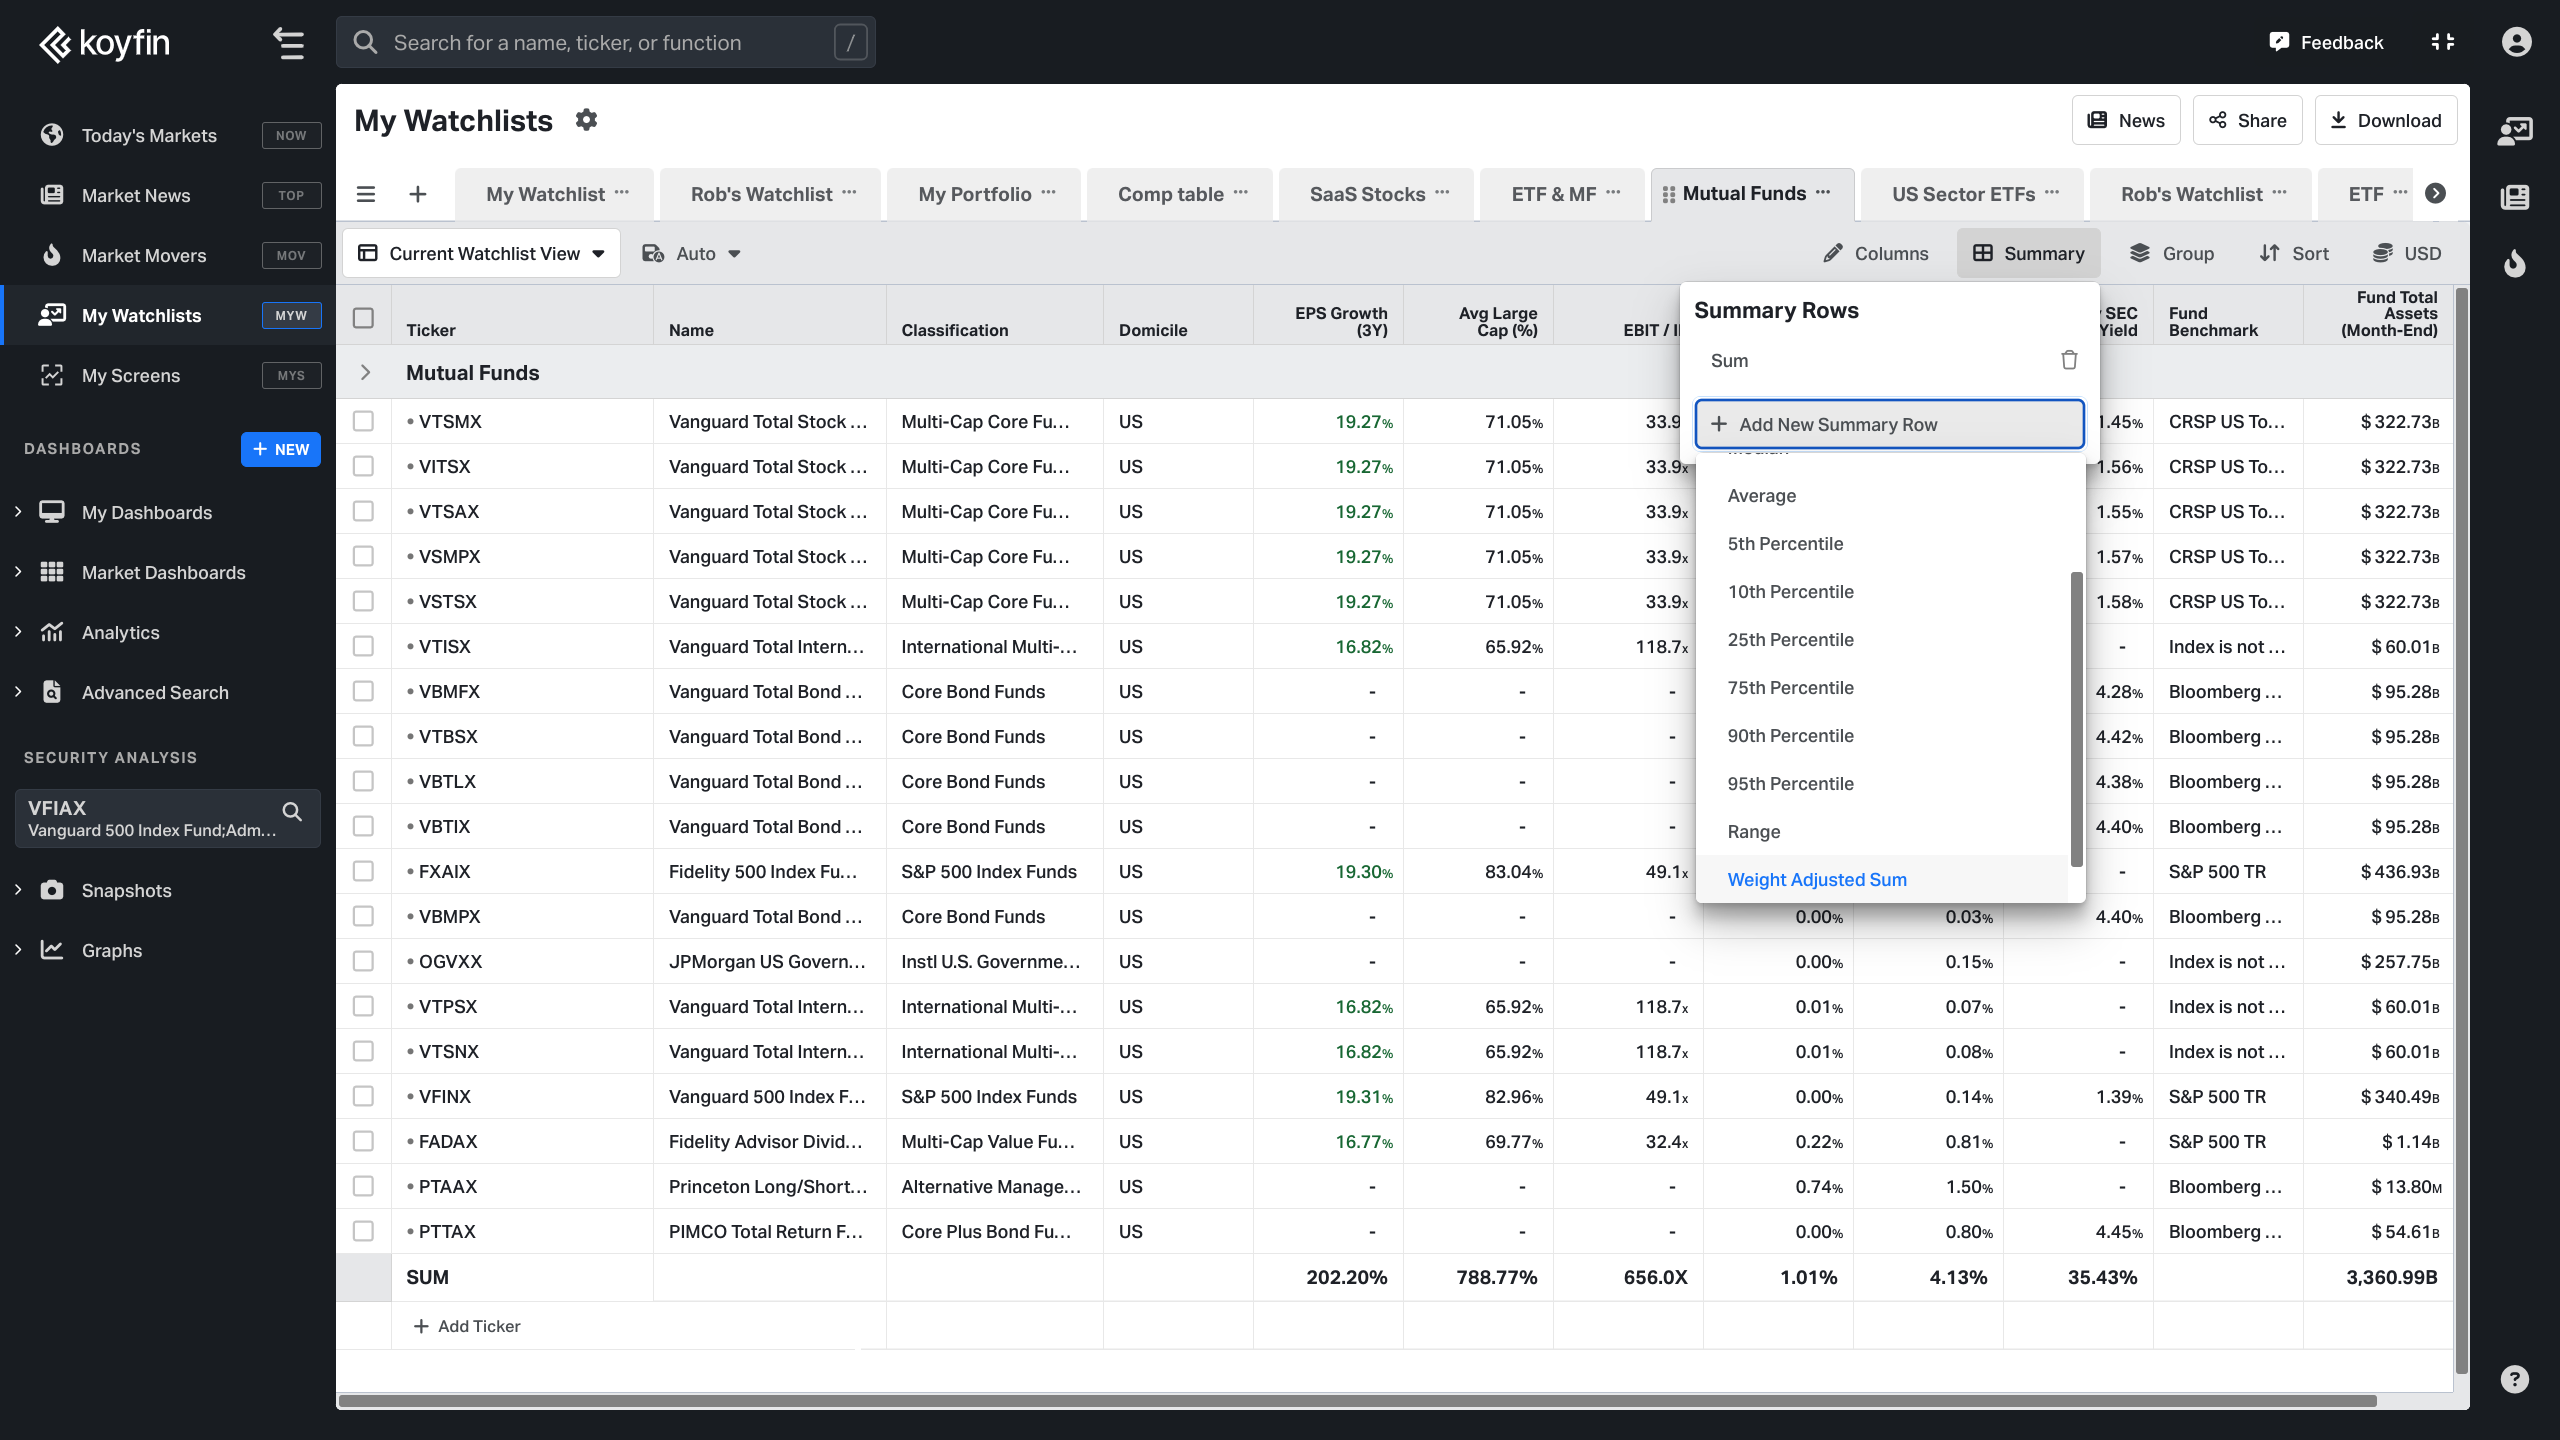
You can also add summary rows to see the mutual fund portfolio level returns. For that click on Summary at the top of your dashboard and then select Weight Adjusted Sum. This will calculate the return of the portfolio using the position weights.
For more information on Portfolio Analysis Tools, check out this article.