Koyfin allows you to access a variety of tools to keep track of your own portfolio. Want to track a list of securities tailored to your investment needs? We have you covered.
You can input the details of your portfolio to keep track of the overall performance and monitor which stocks are leading and lagging.
How to create a dashboard with watchlist of securities
Create a new dashboard, load a watchlist widget, and then click on the widget header to select an existing watchlist, or create a new one. See this article for more information on creating watchlists.
After you have your watchlist with tickers, you might want to add the portfolio columns to the list.
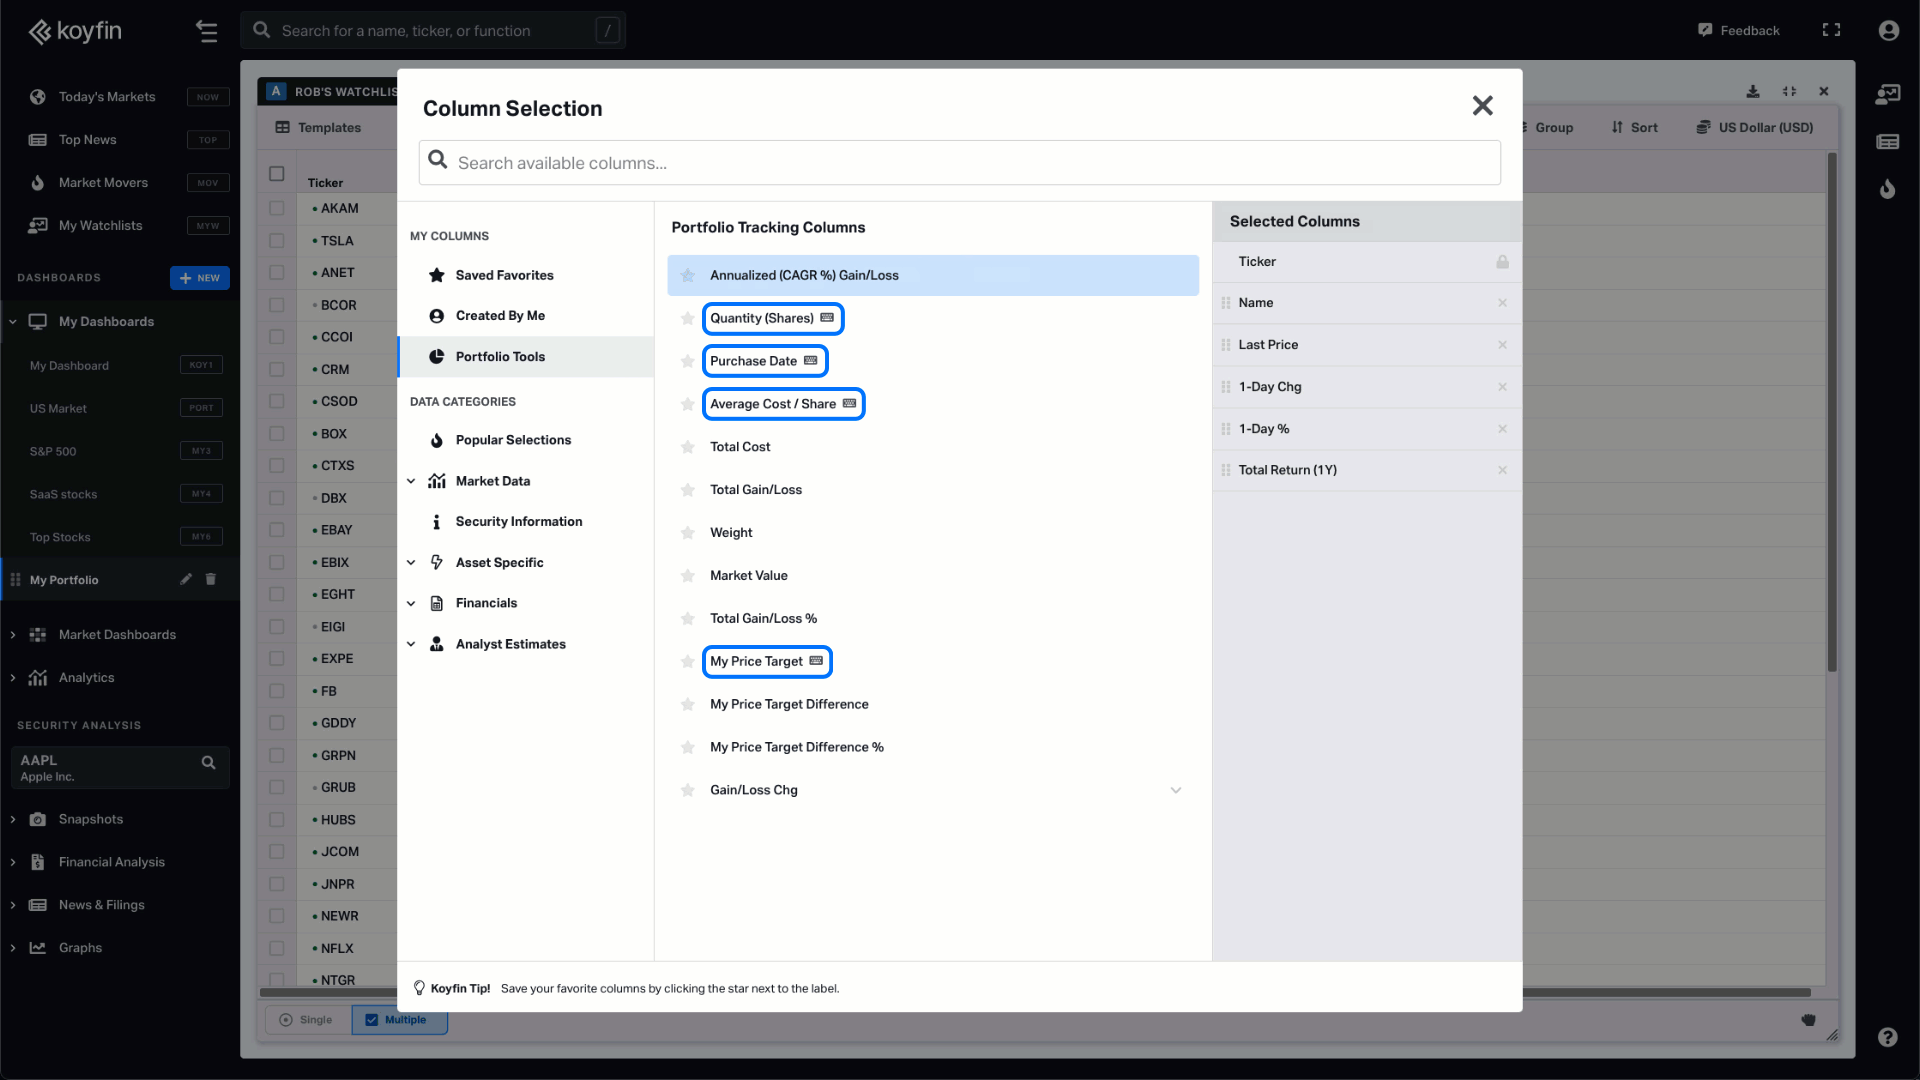
To do that, click on the ✏️ Columns icon, open the portfolio tools section and add the columns you need.
Note: Certain columns like purchase date and quantity have a keyboard icon to the right of the label. These are user input fields for which you’ll have to type the value in the watchlist. The columns without a keyboard icon are automatically computed by Koyfin based on the input fields.
At the watchlist creation stage, you can choose the equity portfolio template to have the necessary columns right away.
Using Portfolio Tracking Columns
After choosing the columns, you can start typing the appropriate values for each cell by clicking on it. For example, if you hover over the quantity or average cost in your dashboard, you'll notice a small box with a pencil. You can quickly fill in each box with your targeted criteria.
Below is a definition of the portfolio columns:
Inputted by User
- Quantity (Shares): The number of shares owned
Note: Currently there’s no ability to input different historical lots. That’s something we’ll be building soon. - Average Cost / Share: The purchase price per share
- Purchase Date: Date of your security purchase
- My Price Target: You can input your target price
Calculated by Koyfin
- Weight: Weight of the security in the portfolio calculated using the inputted quantity / shares of all securities
- Market Value: The current nominal value of the position. Calculated as Quantity * Market price
- Total Cost: Total nominal cost to purchase the security. Calculated as Quantity * Purchase Price
- Total Gain / Loss: Position nominal gain or loss
- Total Gain / Loss %: Position gain or loss expressed as a percentage
- Annualized (CAGR) Gain/ loss: Position gain or loss expressed as an annualized percentage. For example, if an investor held a winning stock for 5 years, this field would calculate the annualized gain for the past 5 years
- Gain / Loss Chg: The nominal gain / loss of the position. The user can select the time period for the calculation.
- My Price Target Difference %: The % difference between the current price and My Price Target
Portfolio Table View
You can preserve all your portfolio settings by saving them as a watchlist view, allowing you to conveniently reuse them in your future watchlists. Read more about Watchlist Views.
You can also add your portfolio using CSV import at the template selection stage when creating a new watchlist.
Portfolio Summary Rows
You can also add summary rows to see the portfolio level returns. Click at the top of your dashboard, select summary, and then select Weight Adjusted Sum. This will calculate the return of the portfolio using the position weights.
Once you set up all the columns and averages, save your columns and summary statistics as a Template so you can use them for other dashboards and portfolios.
To get more information on Koyfin functionality, take a look at other Help Center documentation or check out our YouTube channel.