Projection of expected growth rates and analysis of historical ones are important components of overall security analysis. A company’s actual performance compared to the consensus estimate influences its implicit value, so investors will want to keep an eye on the numbers.
On Koyfin, you can gain a versatile overview of any stock’s performance together with its forecasts for more accurate investing decisions.
How to look at a company’s future growth
Predicting a company’s growth rate is important for investors looking to pinpoint potential investment opportunities.
Company Overview Snapshot
To quickly check a company’s growth rate using metrics such as earnings per share (EPS) or changes in sales year-over-year (YOY), go to its Overview snapshot.
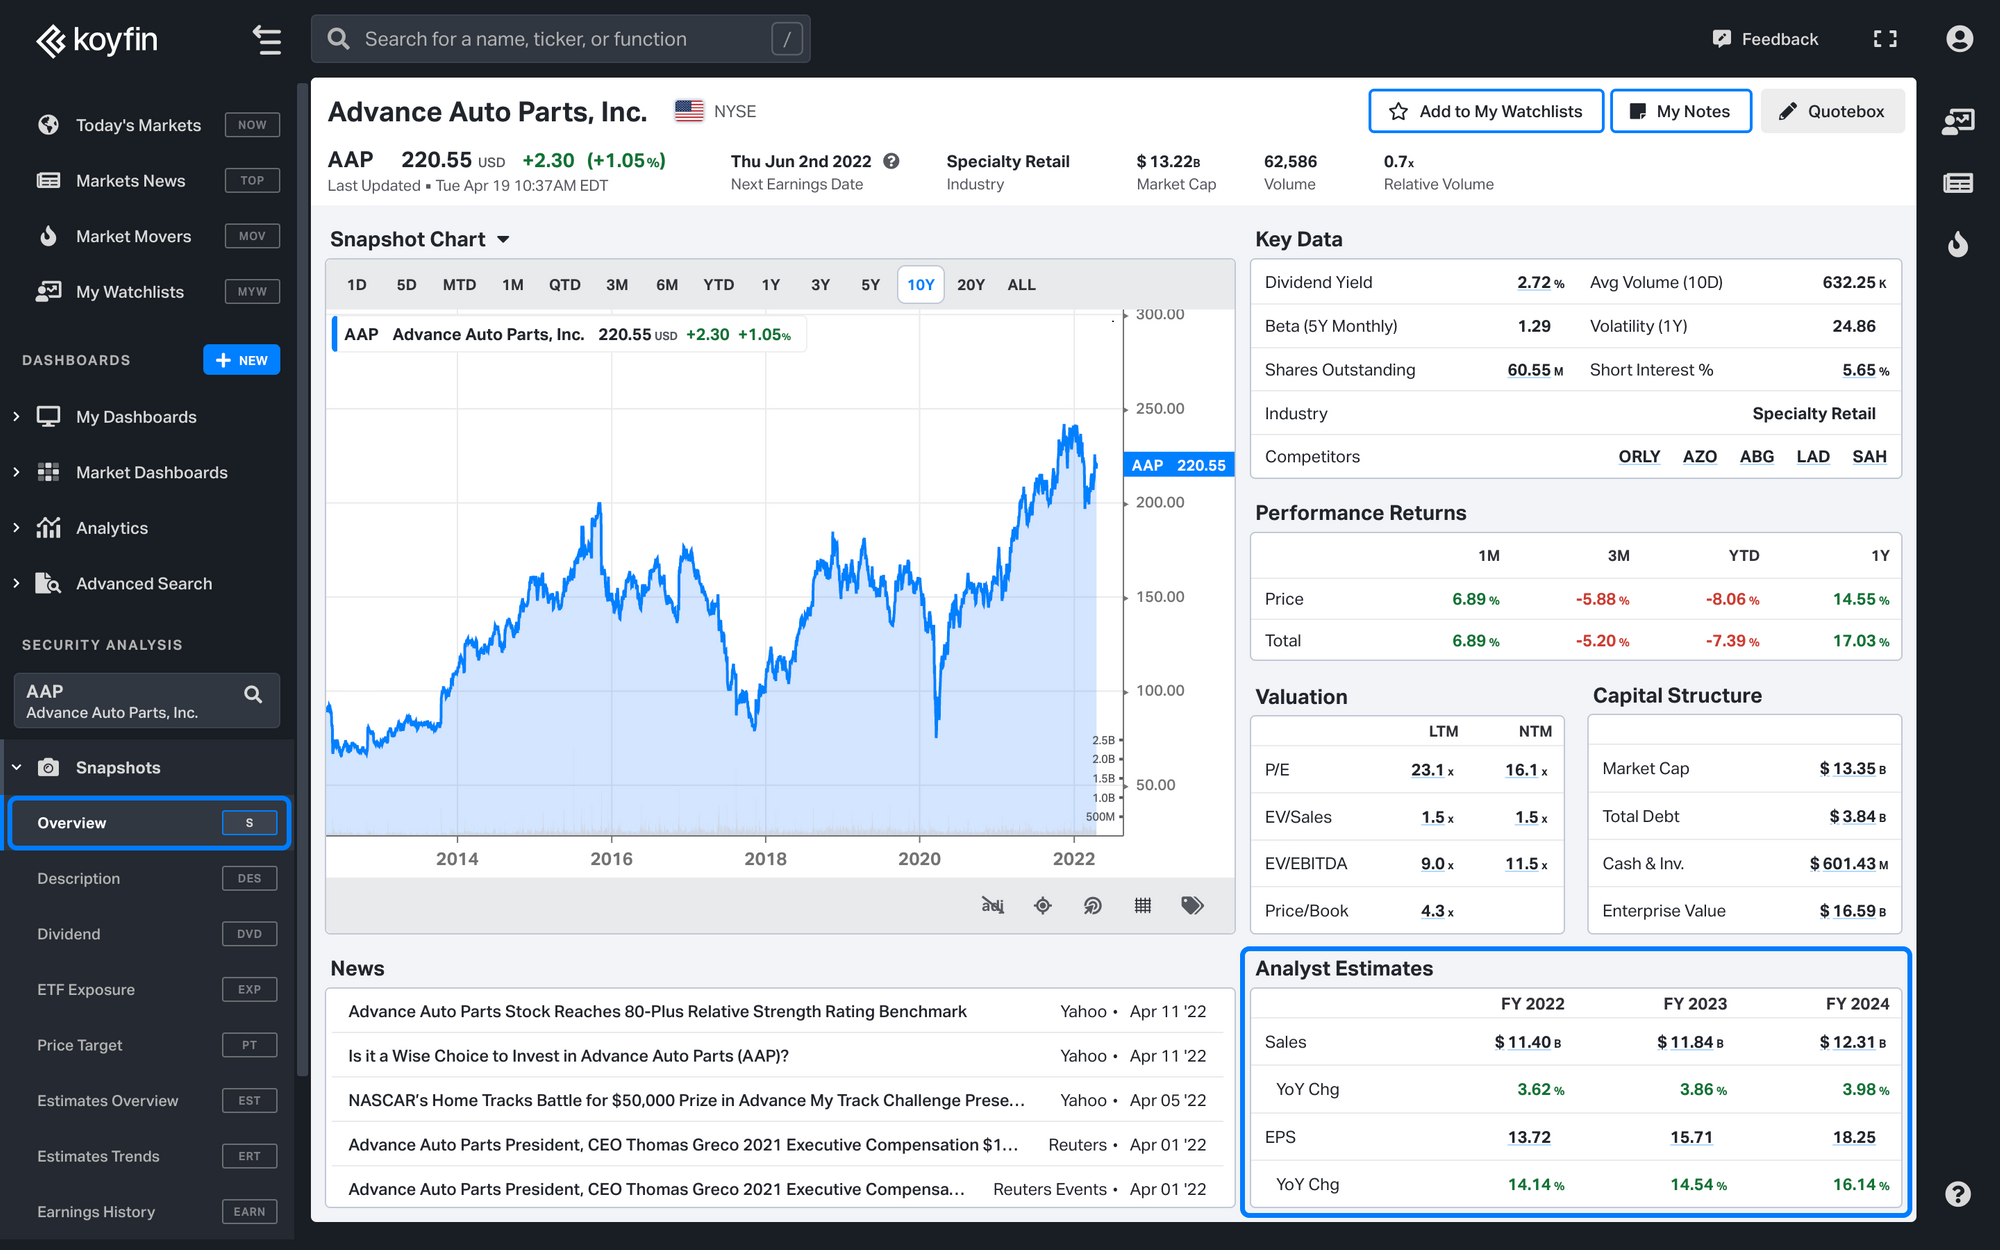
Estimates Overview & Trends Snapshots
To analyze growth data in more detail, go to the Estimates Overview snapshot and check out Earnings Matrix - Reported & Estimates.
If you are looking for annual or quarterly changes in revenue and EPS, go to the Estimates Trends snapshot. If needed, change the fiscal period in the dropdown menu in the upper right corner of the snapshot page.
How to look at a company’s historical growth
Understanding a company’s past growth provides you with insight into its performance drivers and helps determine underlying trends. There are several sections in Koyfin where you can analyze historical growth.
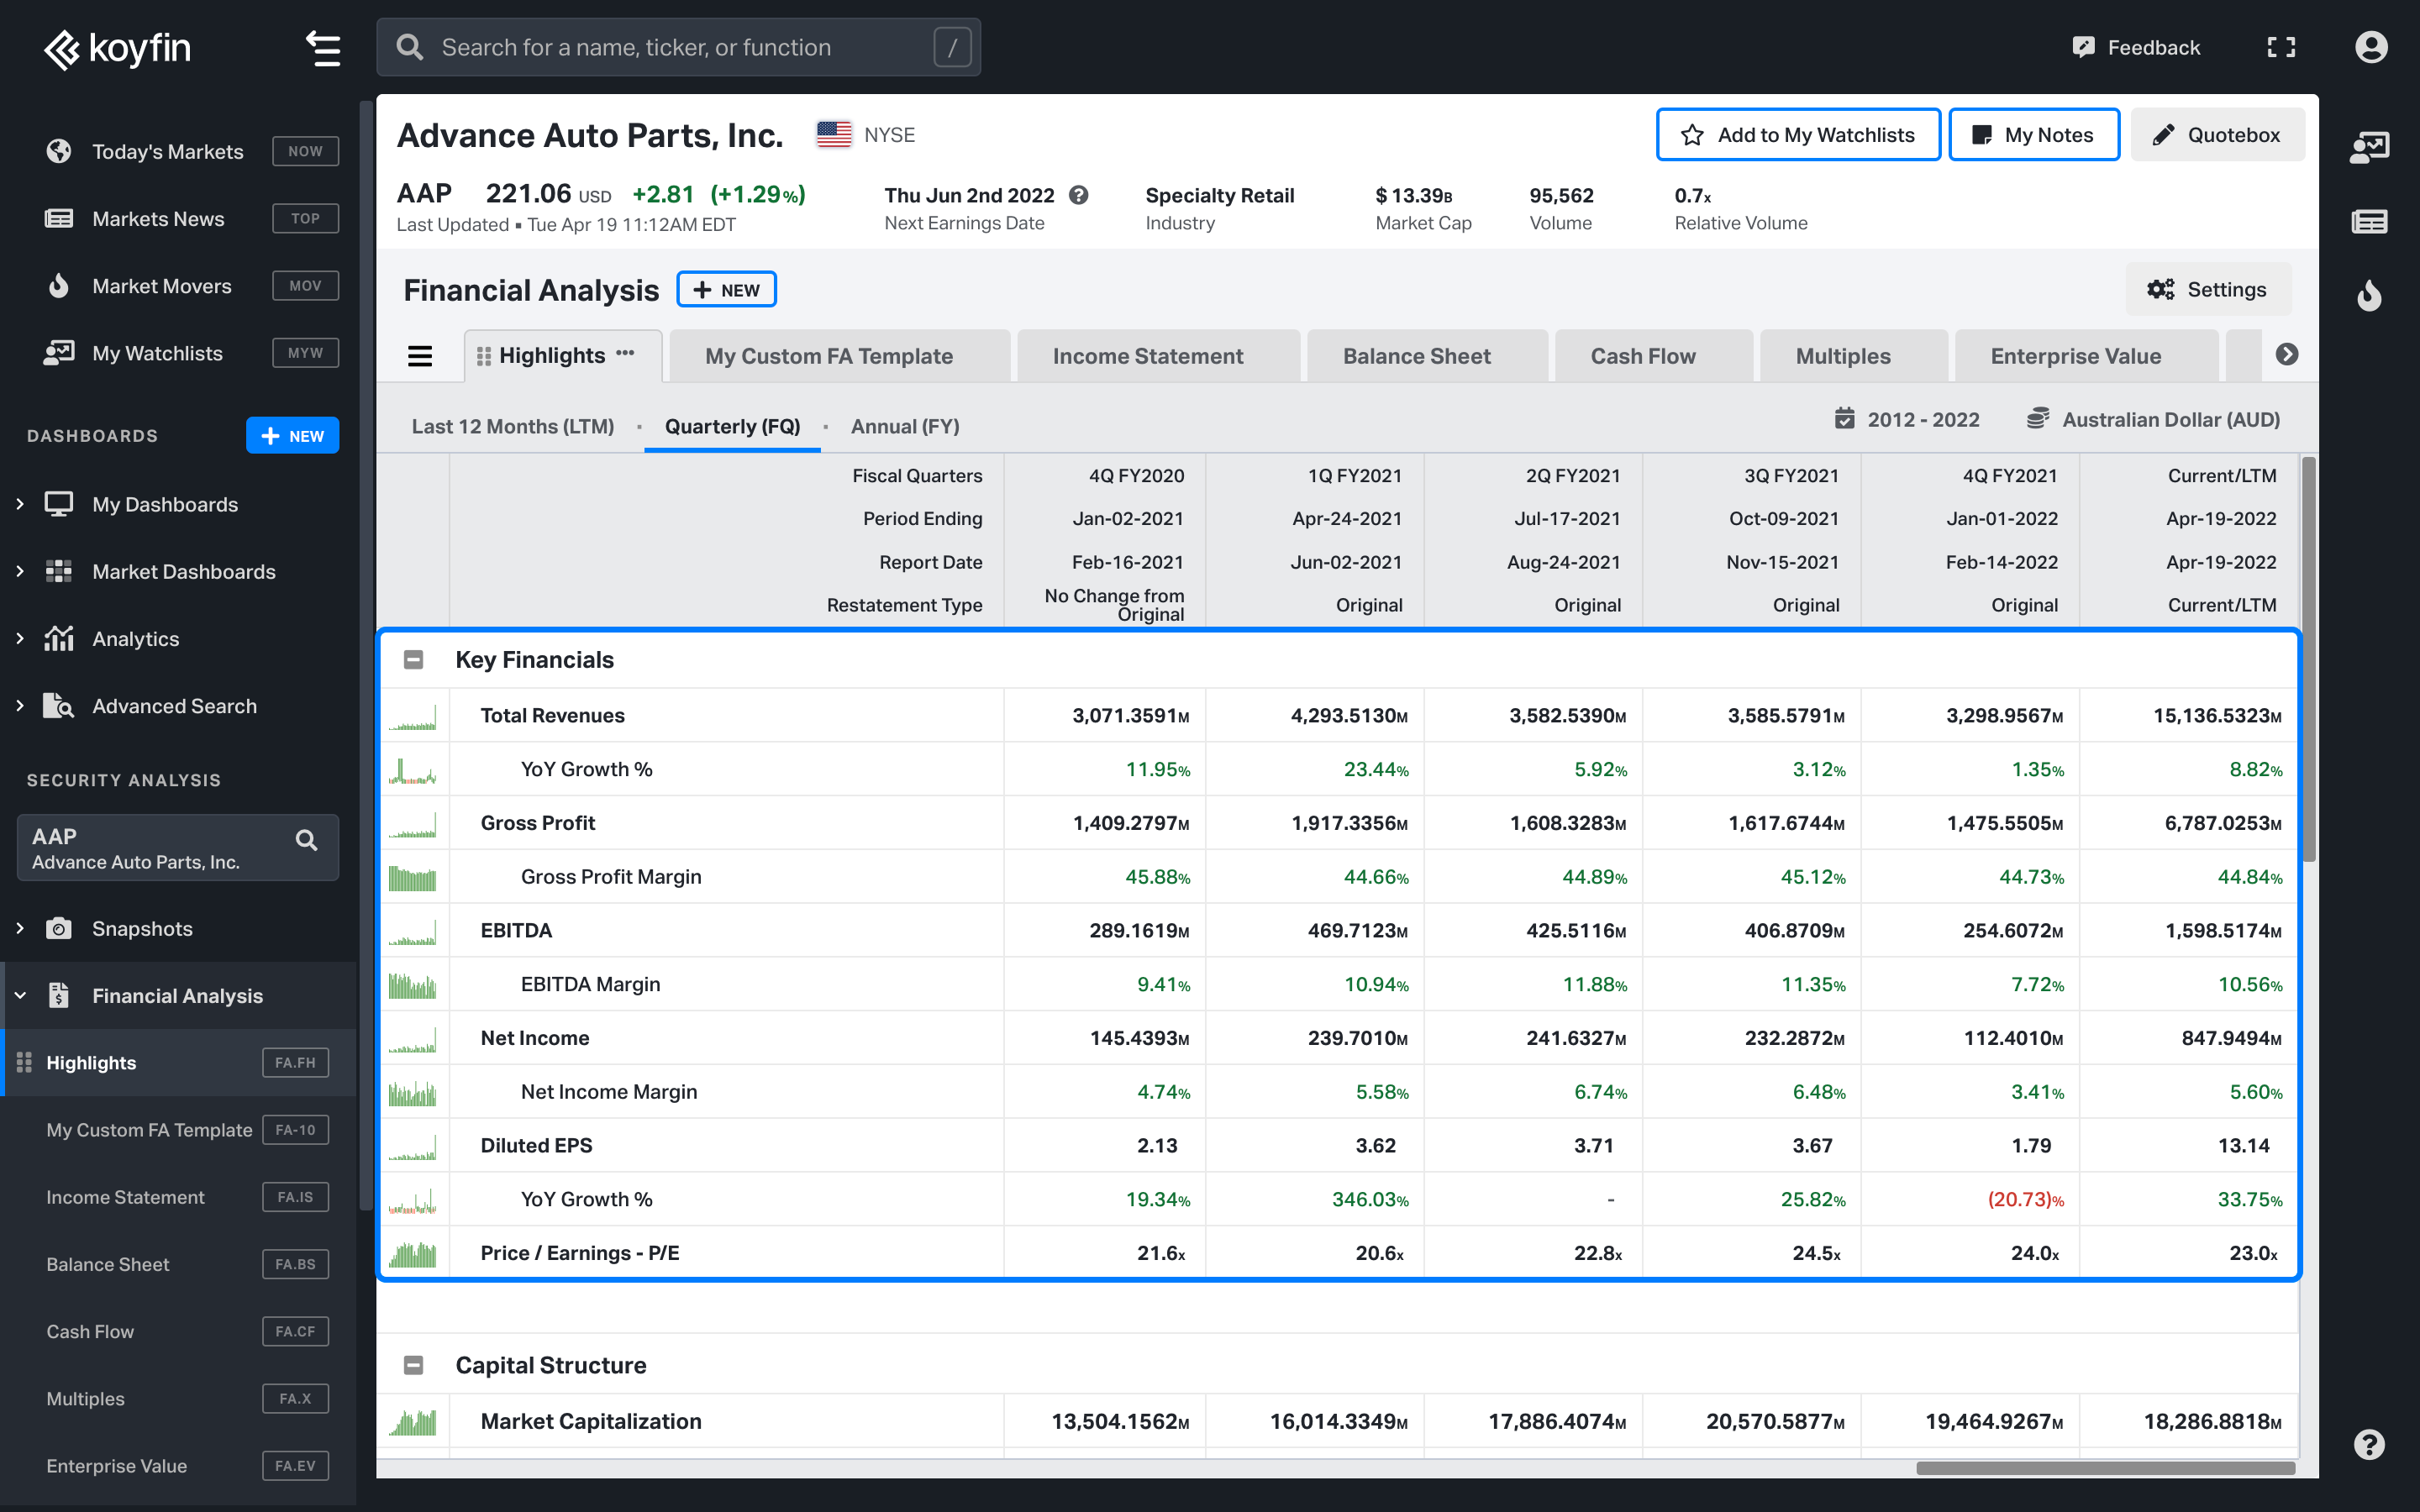
Financial Analysis
To see company growth metrics on Koyfin from a historical perspective, go to the Financial Analysis Highlights.
If you are a Plus or Pro Koyfin user, you can also create your own Financial Analysis Templates with rate-of-growth data to track the metrics you personally need.
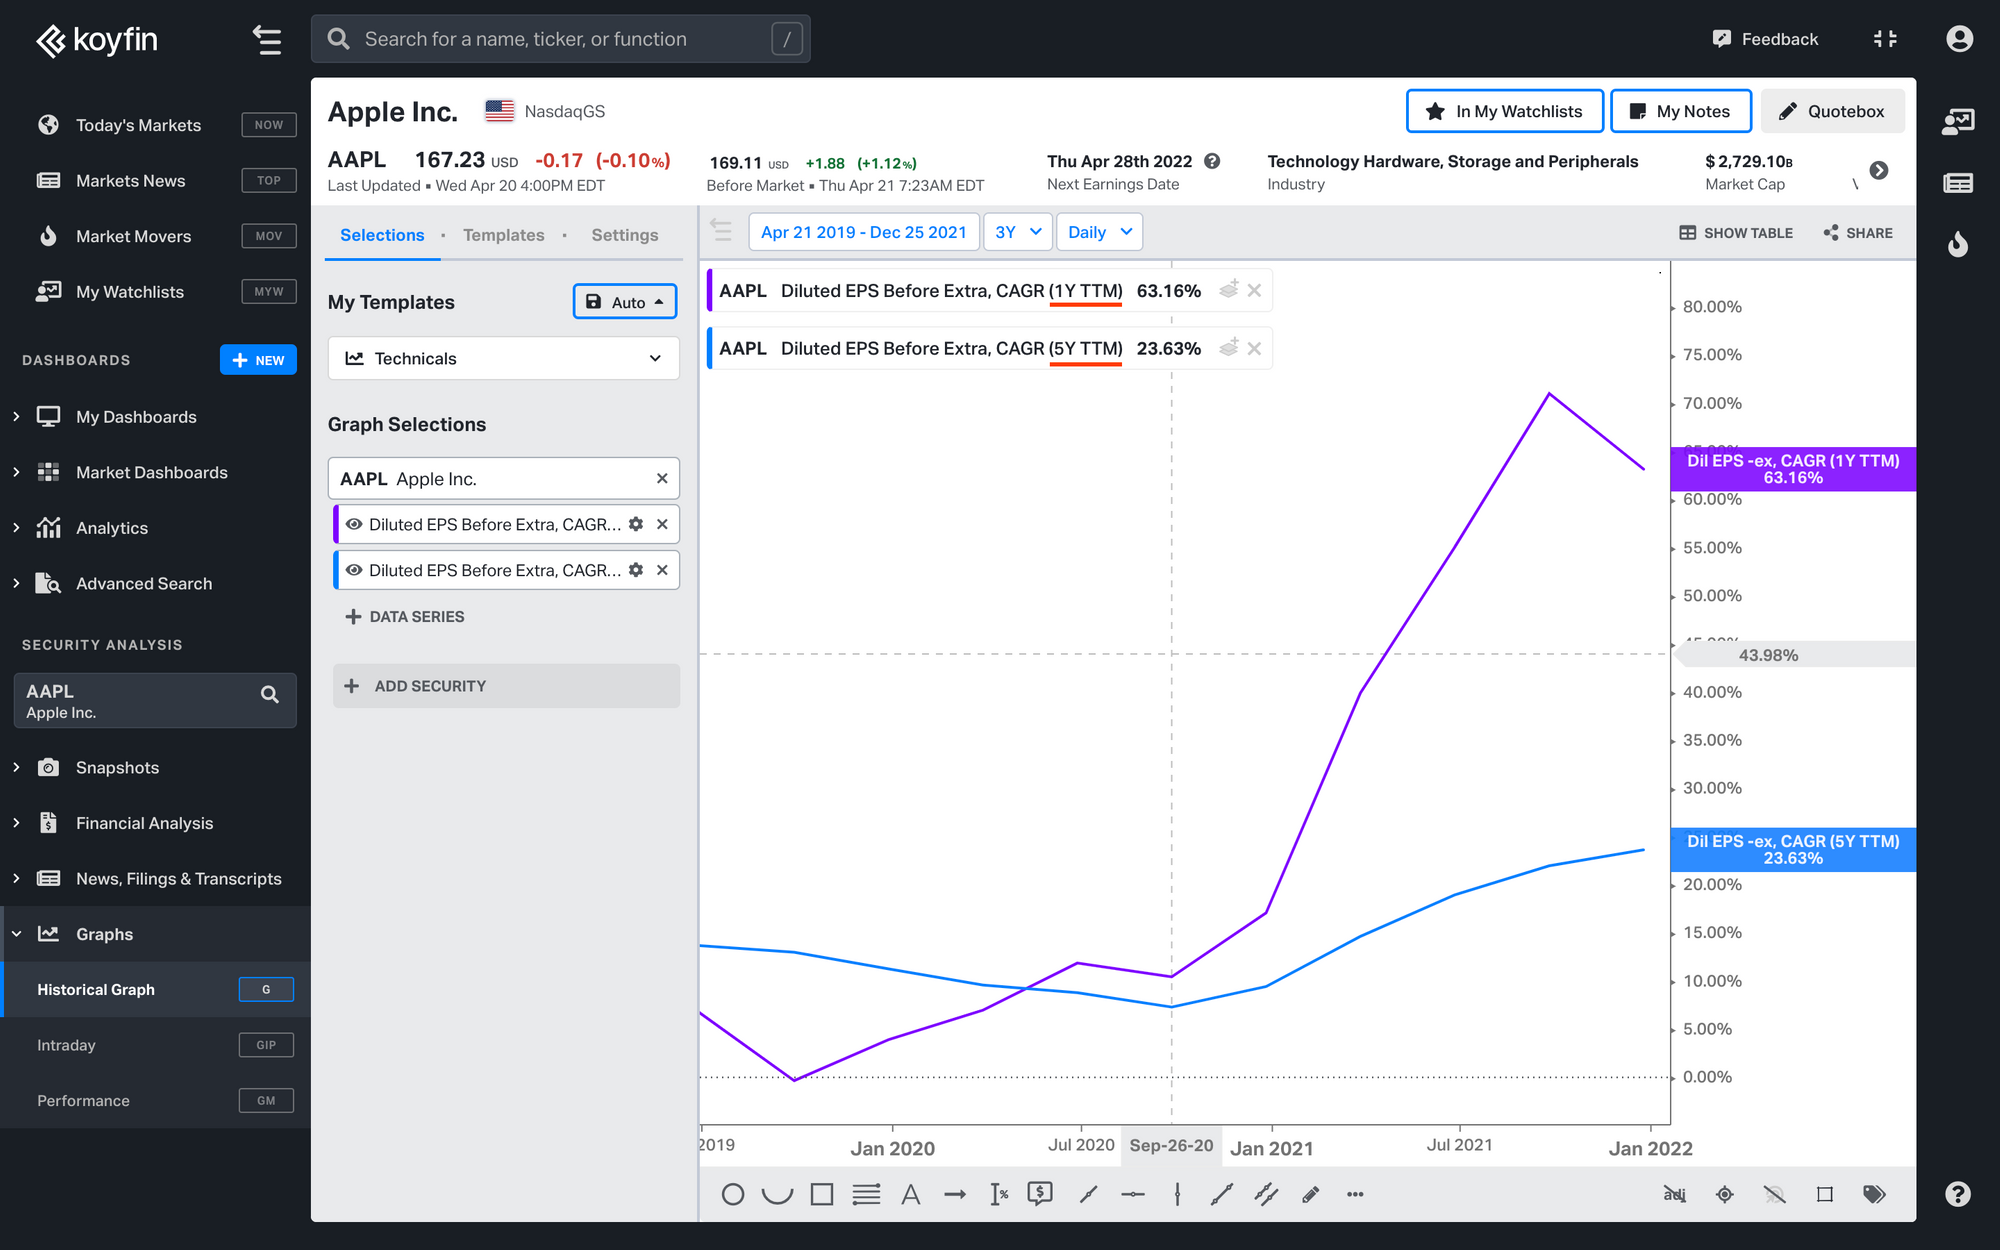
Historical Graph
If you’d like to visualize the company’s EPS growth rate, you can use a Historical Graph.
In an example using AAPL, choose Diluted EPS before extra and a CAGR (compound annual growth rate) data series, and compare reported 1Y and 5Y growth rates to see how the growth trend differs for the chosen periods of time.
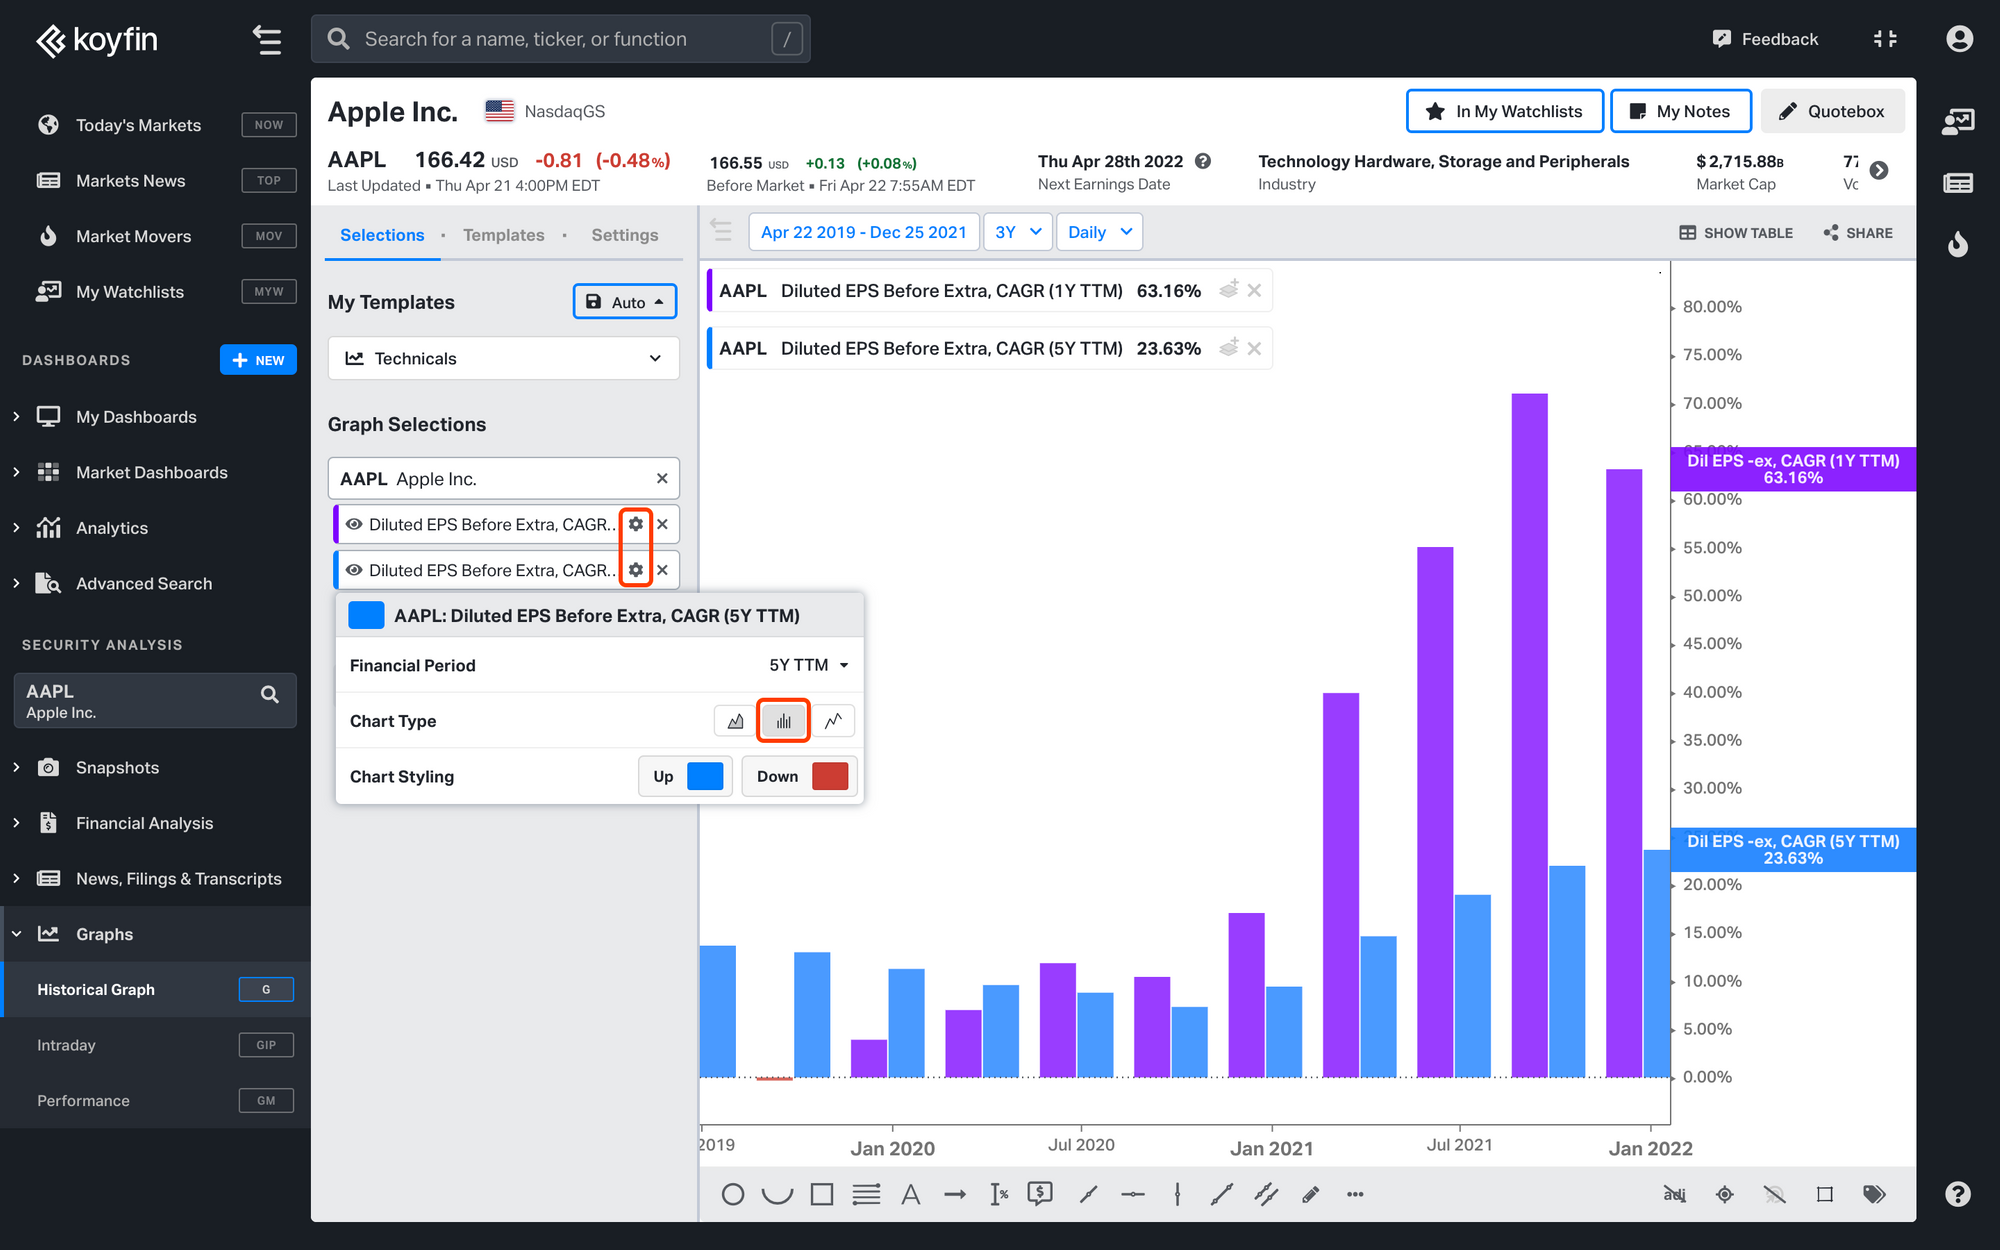
Alternatively, view the growth rates as a bar chart you can select in the options menu.
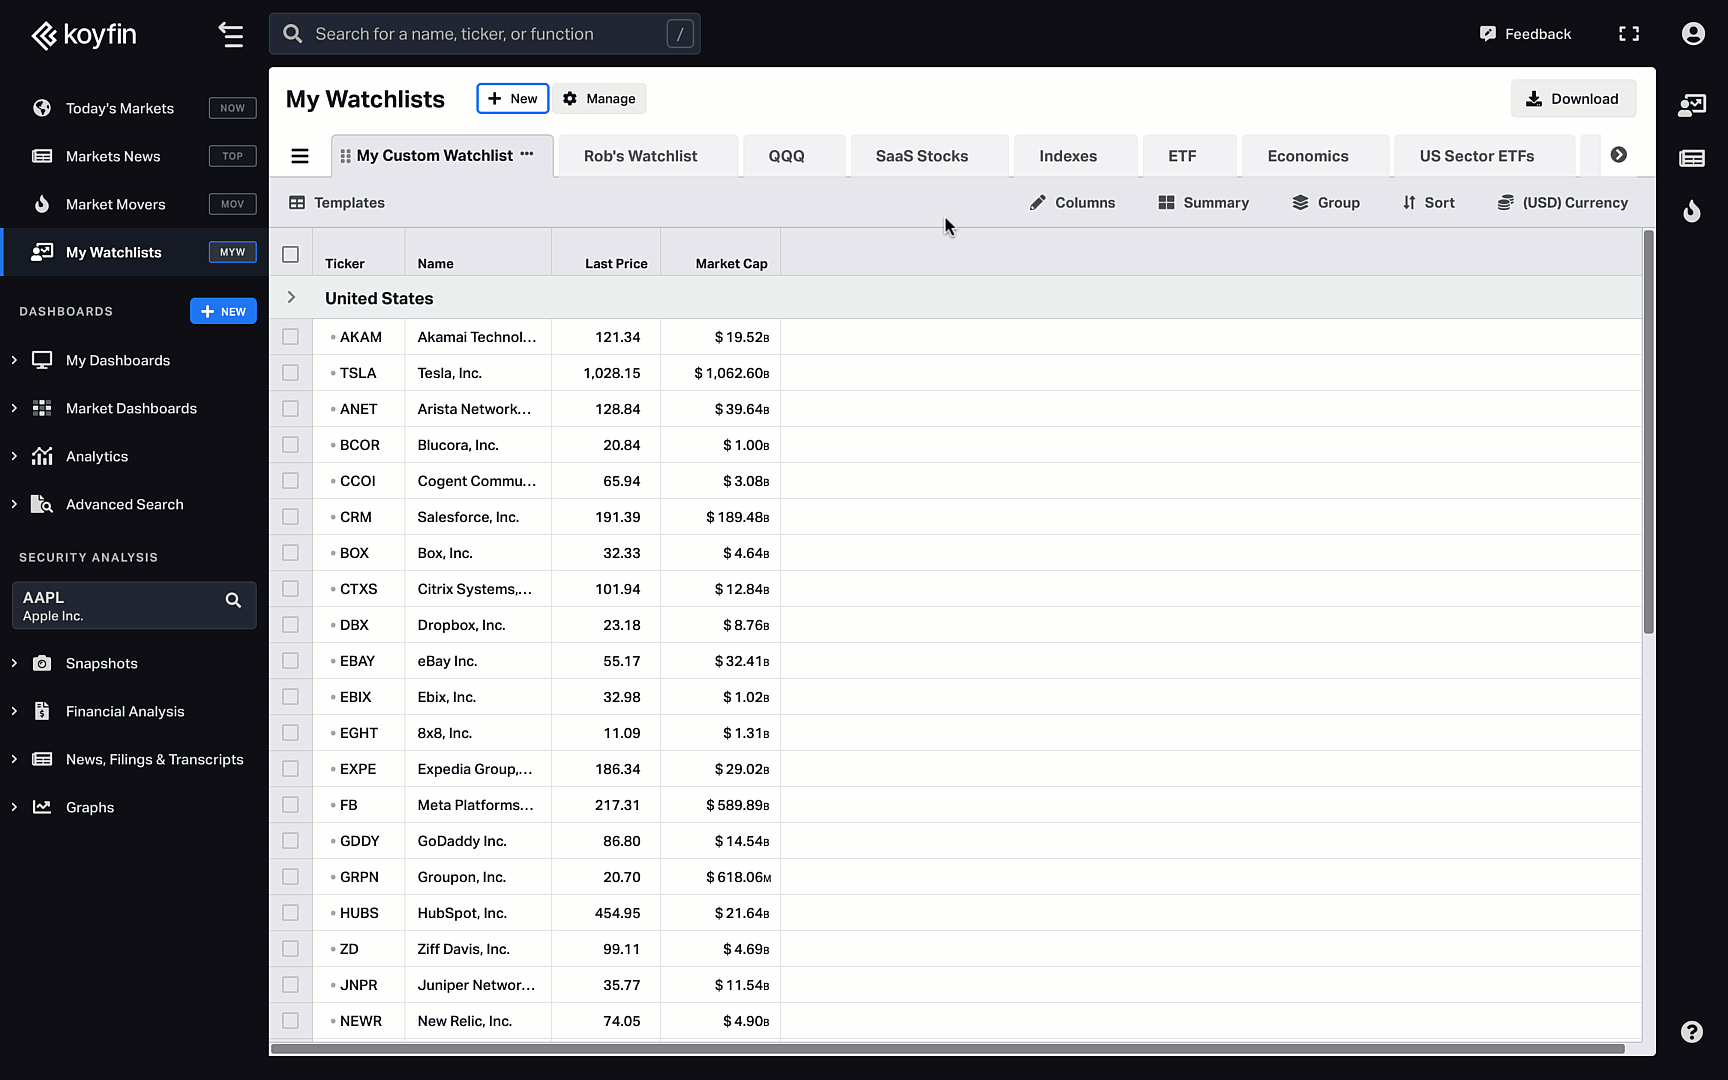
How to track historical and forward growth rates in watchlists
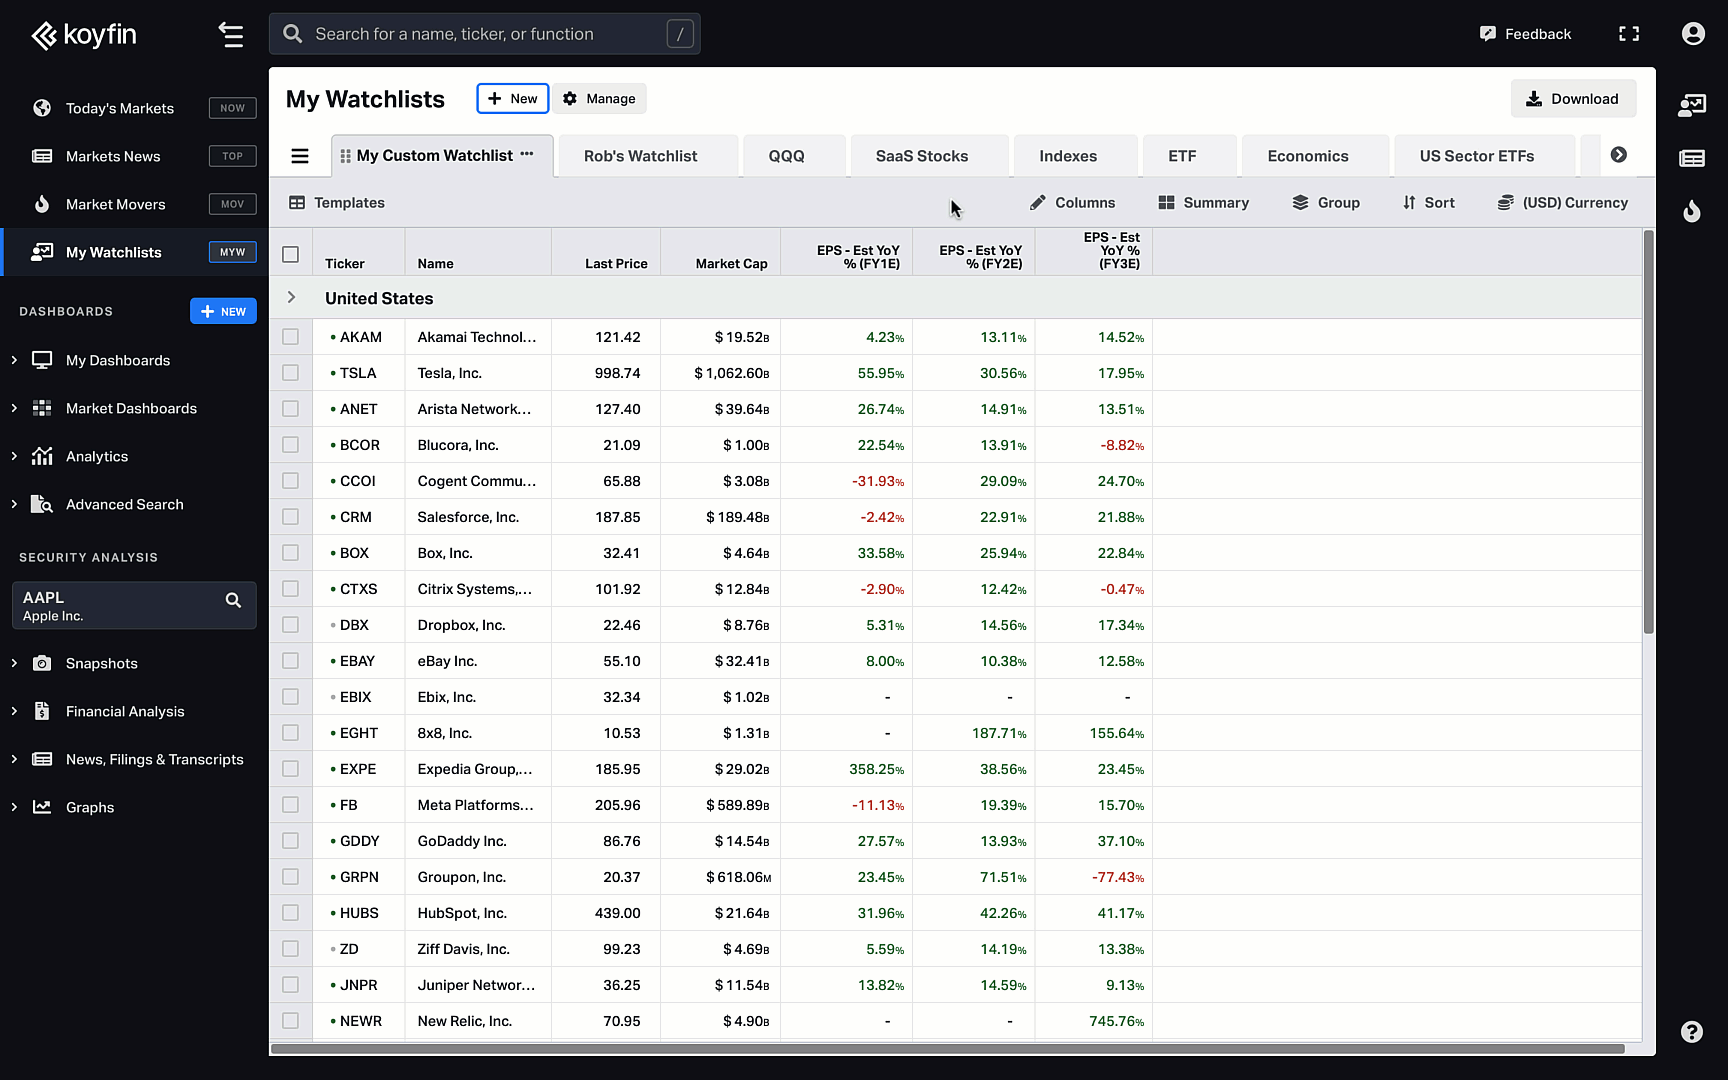
To simultaneously track growth rates for multiple companies, create a watchlist and select the growth columns you’d like to monitor. Forward-looking growth estimates and historical growth rates, or CAGRs, are available.
In your watchlist, click on ✏️ Columns, and under the Analysts Estimates data category, choose Forward Growth. From there, select EPS Estimate Y/Y Chg % and specify the year for which you would like to see the change in growth.
If you want to see analysts’ expectations for EPS growth over the next five years, type in EPS Estimate 5Y Growth.
If you want to see how EPS has grown historically, check out the Financials data category and choose Growth Rates, CAGR %.
For instance, you can select Diluted EPS Before Extra, CAGR and then specify the date ranges for the growth rates that have been actually realized.
Similarly, you can look up the historical growth rates for Total Revenue, EBITDA, Dividends per share, and other metrics.
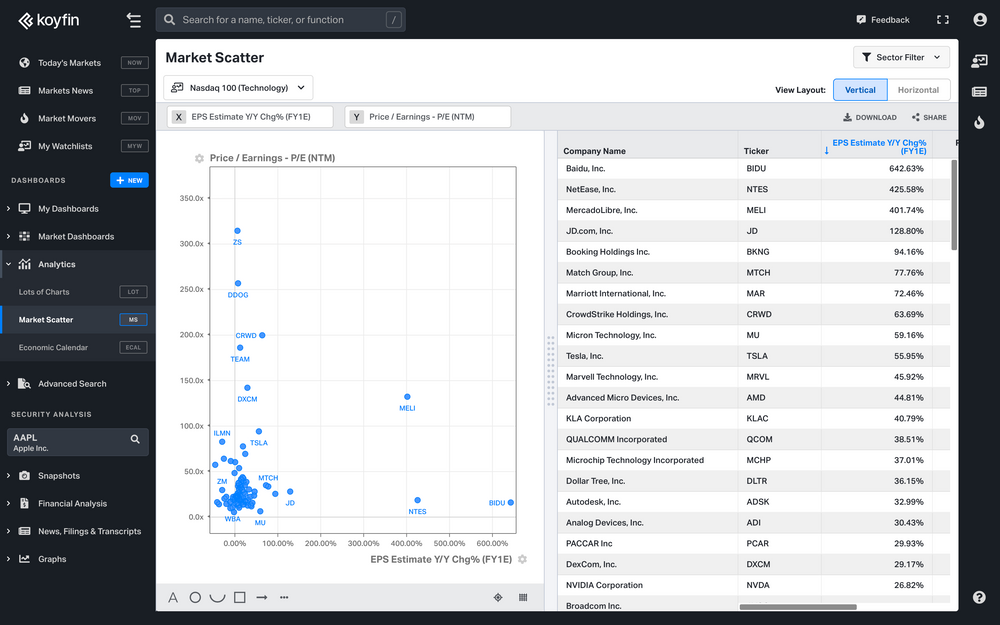
Compare growth speeds with Market Scatter
You can visualize the relationship between companies’ growth rates and valuations using the market scatter function.
For example, for the x-axis, type in EPS and choose EPS Estimate Y/Y Chg % for FY1E; on the y-axis select Price/ Earnings - P/E and then NTM, which stands for the next twelve months.
This will allow you to see the percentage year-over-year EPS estimate change for the first unreported fiscal year in comparison to the price-to-earnings ratio for the next twelve months.
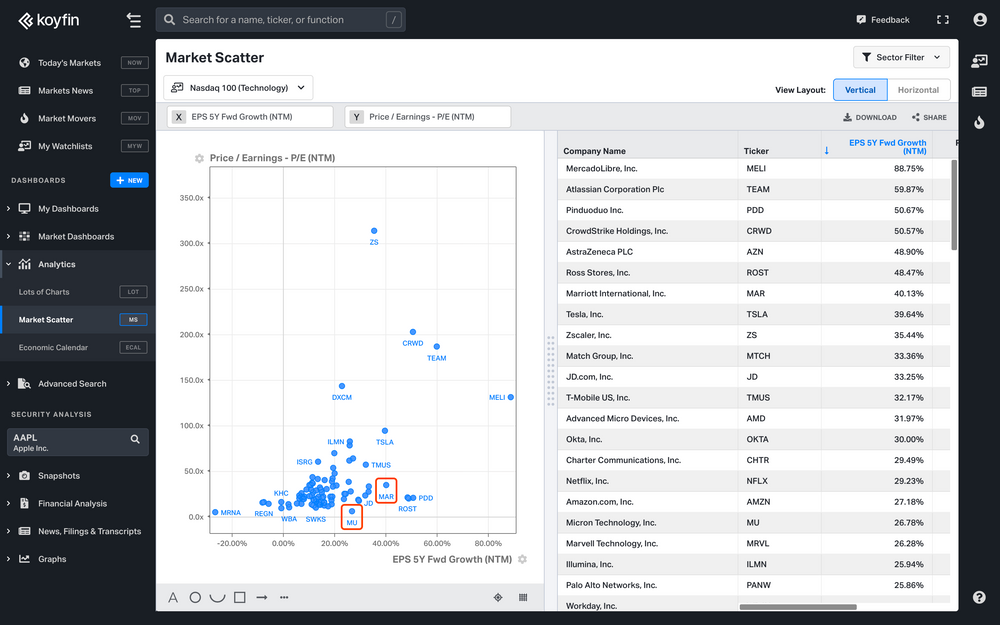
In case you want to smooth out possible one-time short-term events impacting the growth, you can look into the long-term expected growth.
For that, you can instead choose EPS 5Y Frw Growth (NTM) on the x-axis and P/E (NTM) on the y-axis. EPS 5Y Frw Growth (NTM) in this case stands for the Wall Street consensus estimated EPS growth for the next 5 years.
Analysis like this helps you discover stocks that have high expected growth but with low valuations, like MU or MAR from the screenshot.
Reported EPS (GAAP EPS) vs Adjusted EPS (Pro-forma EPS)
There is an accounting difference between historical and forward EPS growth rates on Koyfin. We show reported GAAP numbers (historical) in the Financial Analysis section. Meanwhile, the Snapshots show Pro-forma data (estimates). Pro-forma figures exclude certain items like stock-based compensation.