Alpha (All Funds)
Alpha measures the difference between a fund's actual returns and its expected performance given its level of risk as measured by Beta. A positive Alpha indicates the fund has performed better than its Beta would predict; a negative Alpha indicates underperformance relative to expectations.
This item is calculated using the following formula:
- A = 12 × (Re − β × Be)
where
- A = Annualised Alpha
- Re = Average monthly excess return of the fund
- Be = Average monthly excess return of the benchmark
- β = Beta
Data is sourced from Morningstar and is available for 1Y, 3Y, 5Y, 10Y, and 15Y periods.
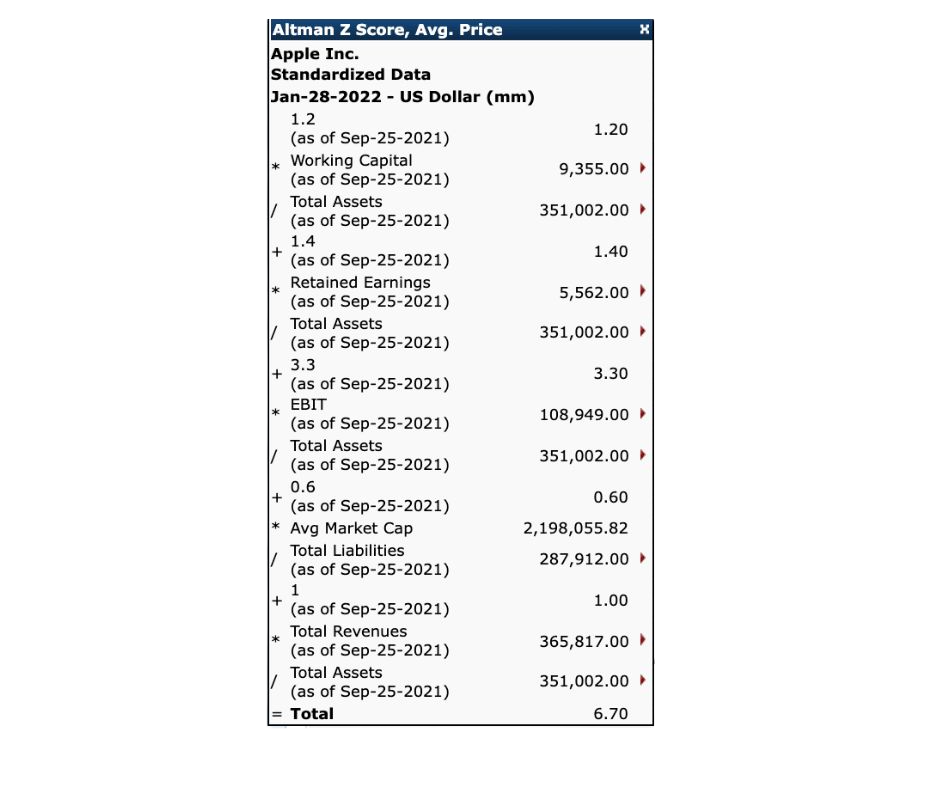
Altman Z Score
The Altman Z score determines the chances of bankruptcy for a company. Typically a lower, or declining, score indicates a higher risk of bankruptcy.
We show the Altman Z Score using the average stock information for a period data-field.
The example below shows the calculation for Apple Inc. as of January 28, 2022.
Average Days Payable Outstanding
Average Days Payable Outstanding measures the average number of days a company takes to pay its suppliers after receiving goods or services. It reflects how well a company manages its cash flow and payment obligations.
This item is calculated using the following formula:
((Accounts Payable, Total(t) + Accounts Payable, Total(t-1)) / 2) / (Cost of Goods Sold(t) - Inventory(t-1) + Inventory(t)) * (Number of Days in the Period)
Notes:
- If both periods of data (t and t-1) are not available then the ratio will be shown as null.
- If the value is greater than 600 days then it will be shown as null.
Average Monthly Return (All Funds)
Average Monthly Return is the simple arithmetic mean of a fund's monthly returns over the relevant period. It does not account for compounding.
This item is calculated using the following formula:
- R̄ = ΣRi / n
where
- R̄ = Average monthly return
- Ri = Return of the fund in month i
- n = Number of months in the period
Data is sourced from Morningstar and is available for 1Y, 3Y, 5Y, 10Y, and 15Y periods.
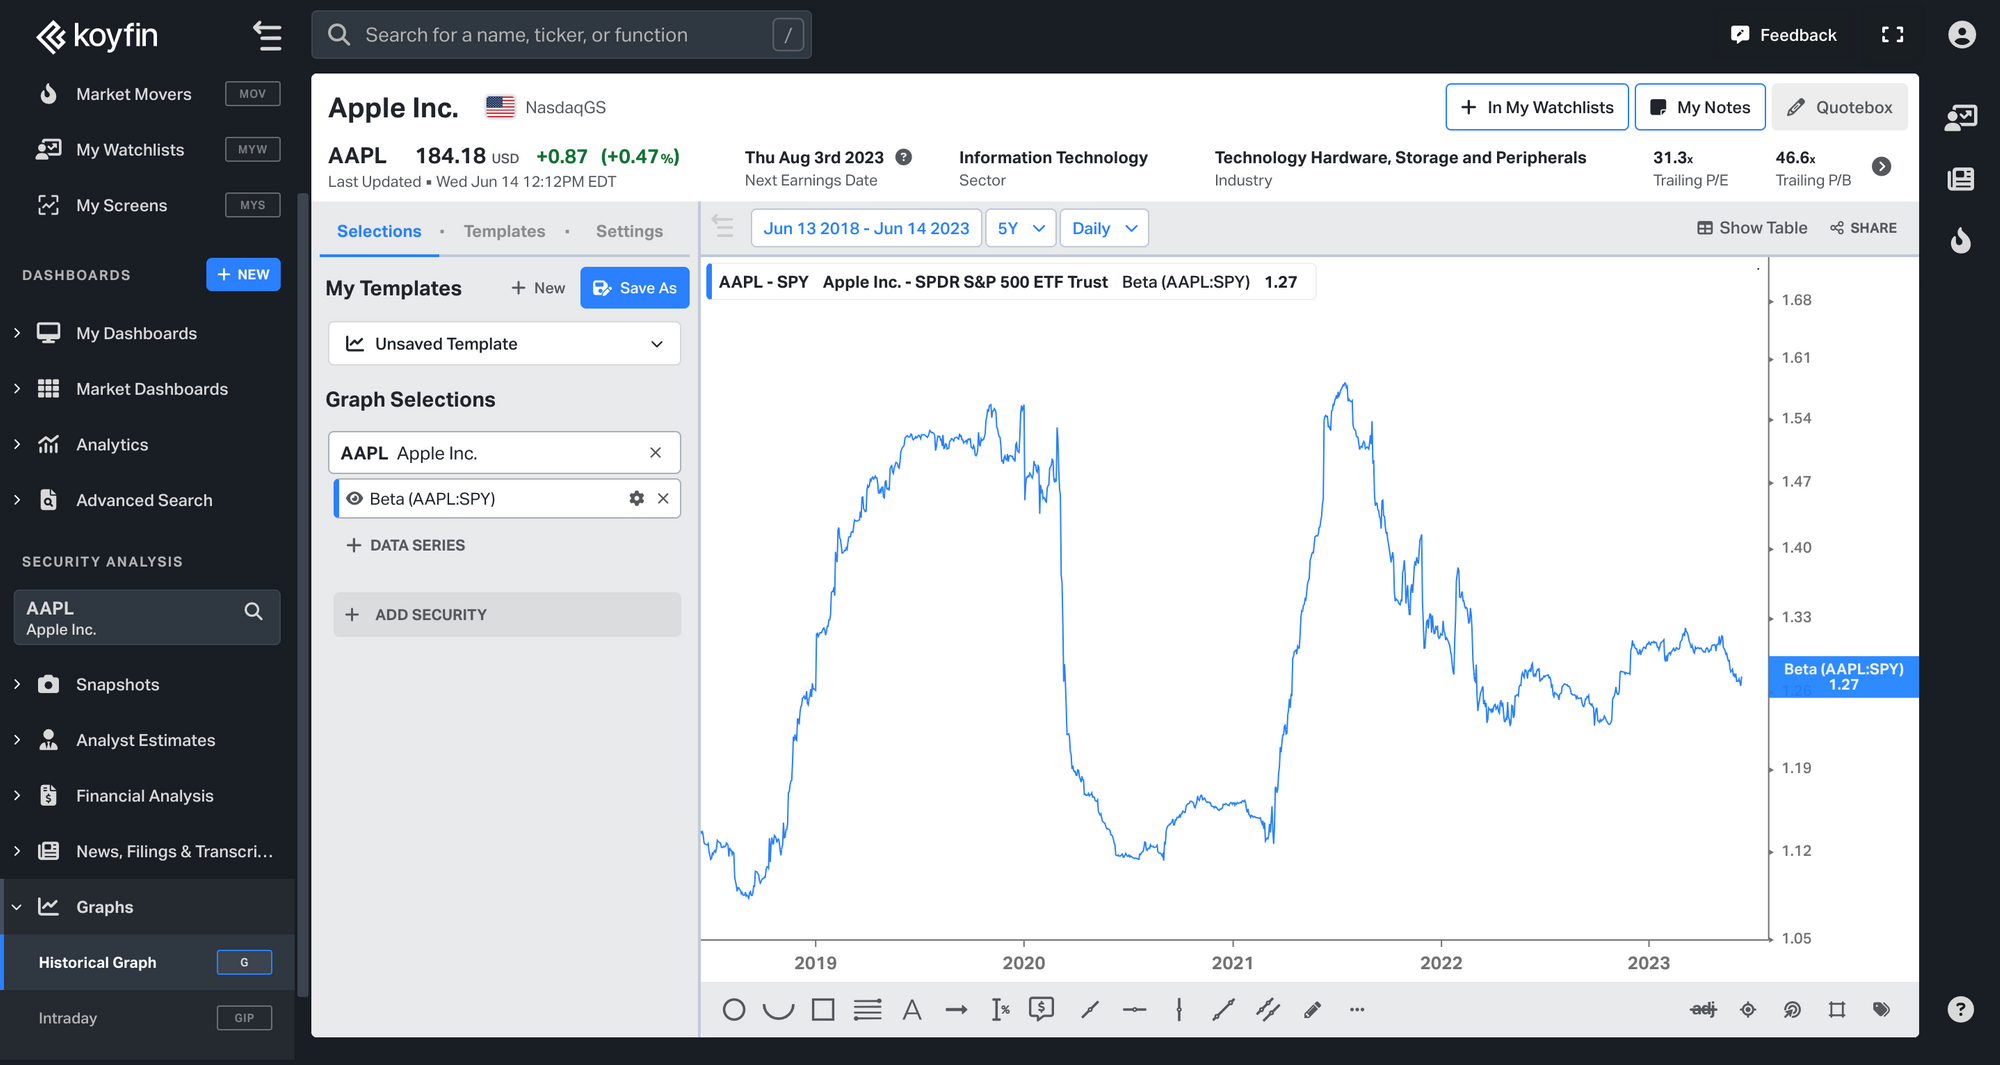
Beta
Beta is a measurement of the sensitivity of a company stock price to the overall fluctuation of a given benchmark index. Betas are levered, unadjusted and derived from a least squares regression analysis using stock and benchmark index returns based on a monthly or weekly frequency. Beta in the watchlist and screener is calculated using 60 monthly returns (each as of month end) but if the company trading history is too short to provide such a sample, fewer than 60 but not fewer than 24 monthly returns are used to run the regression.
The benchmarks are the S&P 500 for all U.S. stocks, the S&P/TSX Composite for all Canadian stocks, the MSCI EAFE for all developed market stocks in Europe, Australasia, and the Far East, and the MSCI Emerging Markets for all other international stocks.
If you want to graph Beta for a particular stock, you can use the G chart on Koyfin. The default window in the chart is 1 year (252 days), and you can specify this value in the Beta settings.
Beta (All Funds)
Beta measures a fund's sensitivity to movements in its assigned benchmark. A Beta above 1.0 indicates the fund tends to amplify benchmark movements; a Beta below 1.0 indicates dampened sensitivity. Beta is measured as the slope of the regression of the fund's excess returns against the benchmark's excess returns.
This item is calculated using the following formula:
- β = Cov(Rf, Rb) / Var(Rb)
where
- β = Beta
- Cov(Rf, Rb) = Covariance of the fund's excess returns and the benchmark's excess returns
- Var(Rb) = Variance of the benchmark's excess returns
Data is sourced from Morningstar and is available for 1Y, 3Y, 5Y, 10Y, and 15Y periods.
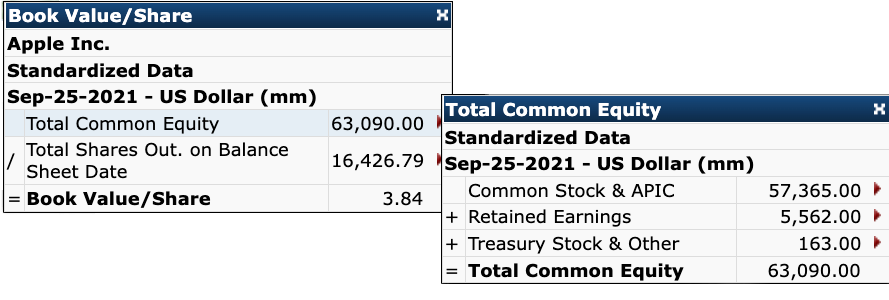
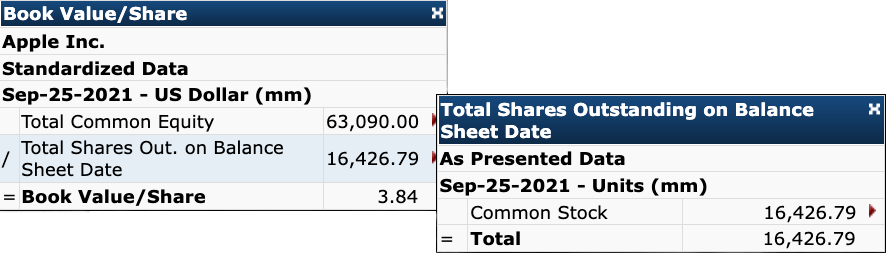
Book Value / Share
Book Value / Share is a ratio calculated using the following formula:
Book Value / Share = Total Common Equity / Total Shares Out. on Balance Sheet Date
The example below is for Apple Inc. as of September 25, 2021.
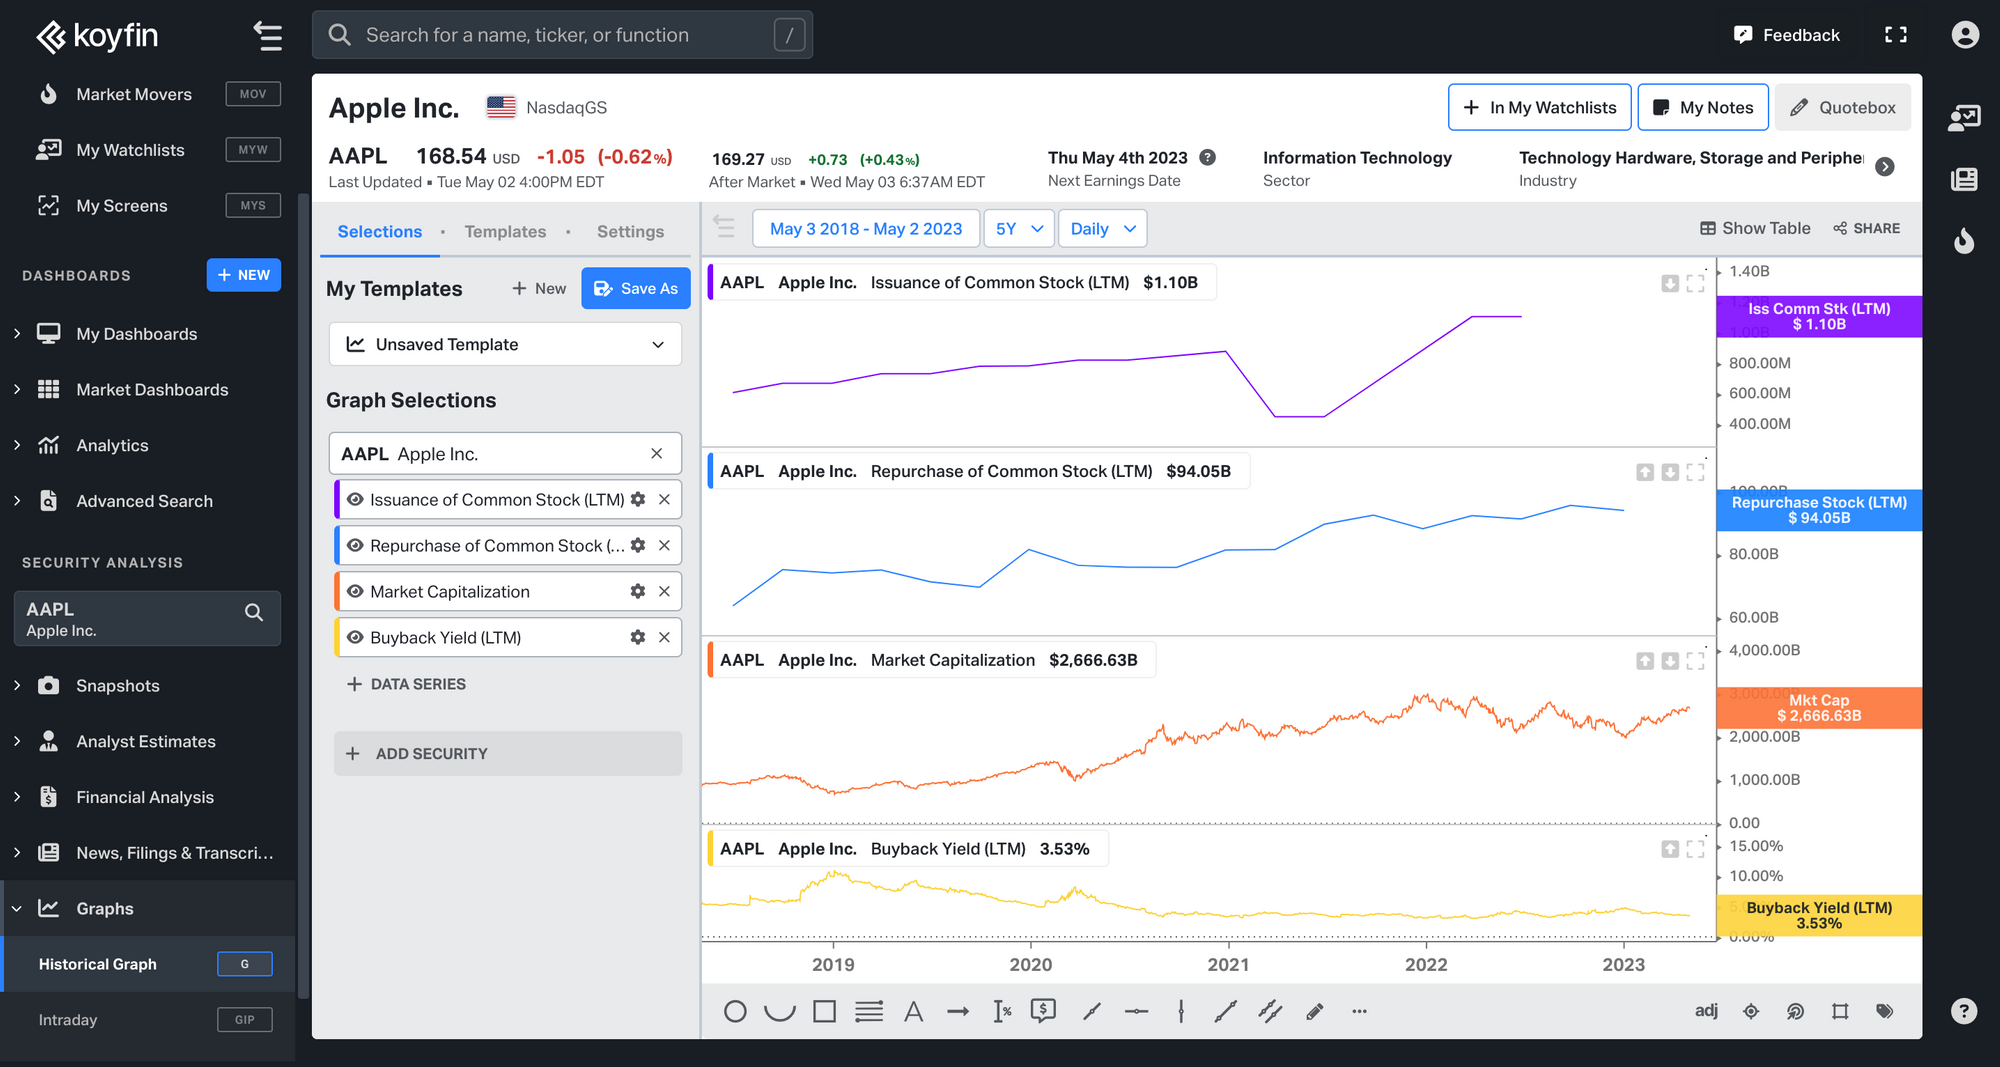
Buyback Yield %
Buyback Yield % is the repurchase of outstanding shares over the existing market cap of a company. It is calculated using the formula:
Buyback Yield % = ((Issuance of Common Stock + Repurchase of Common Stock) / Latest Market Cap)
You can visualize the Buyback Yield % of a company on the G chart. For example, the graph below shows the Issuance of Common Stock, Repurchase of Common Stock, Latest Market Cap, and Buyback Yield for Apple Inc.
Cash Conversion Cycle (Average Days)
The Cash Conversion Cycle (CCC) measures the average number of days it takes a company to convert its investments in inventory and other resources into cash from sales. It assesses operational efficiency and liquidity management by considering how quickly a company sells inventory, collects receivables, and pays suppliers.
This item is calculated using the following formula:
((Inventory(t) + Inventory(t-1)) / 2) / Cost Of Goods Sold * (Number of Days in the Period) + ((Accounts Receivable(t) + Accounts Receivable(t-1)) / 2) / Revenues * (Number of Days in the Period) - ((Accounts Payable(t) + Accounts Payable (t-1)) / 2) / (Cost of Goods Sold(t) - Inventory(t-1) + Inventory(t)) * (Number of Days in the Period)
In simpler terms, this can also be expressed as:
Days Outstanding Inventory + Days Sales Outstanding - Average Days Payable Outstanding
Notes:
- If both periods of data (t and t-1) are not available then the ratio will be shown as null.
- If any component of Average Cash Conversion Cycle is unavailable or non-meaningful then it will be shown as null.
Cash from Operations
Cash from operations represents the cash a company generates from its core business activities after adjusting net income for non-cash items and working-capital changes.
This item includes:
• Net Income + Depreciation & Amortization + Amortization of Deferred Charges + Other Non-Cash Items +/- Change in Net Operating Assets.
The standard template for cash from operations includes stock-based compensation, a sub-item of other non-cash items.
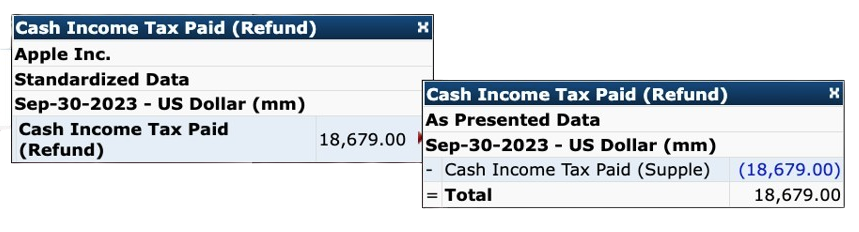
Cash Income Tax Paid (Refund)
Cash Income Tax Paid (Refund) represents cash used for income tax payments or cash received from income tax refunds. This line item is usually reported in the supplemental section of the cash flow statement.
This item includes:
• Cash paid during the year for income tax
• Income tax, net of refund
• Cash paid (received) for income tax
This item excludes:
• Payment for taxes other than income tax
• Tax benefit from exercise of stock options
• Increase (decrease) in income tax payable
The example below is for Apple Inc. as of September 30, 2023.
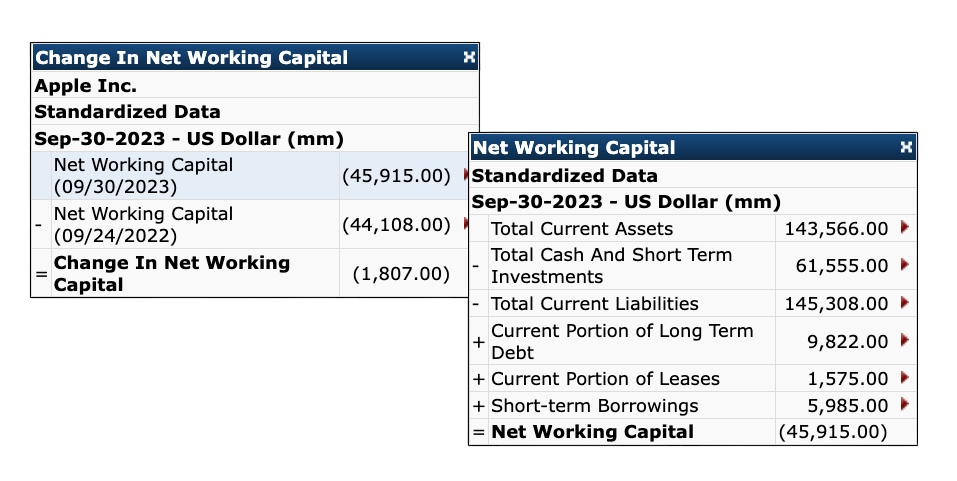
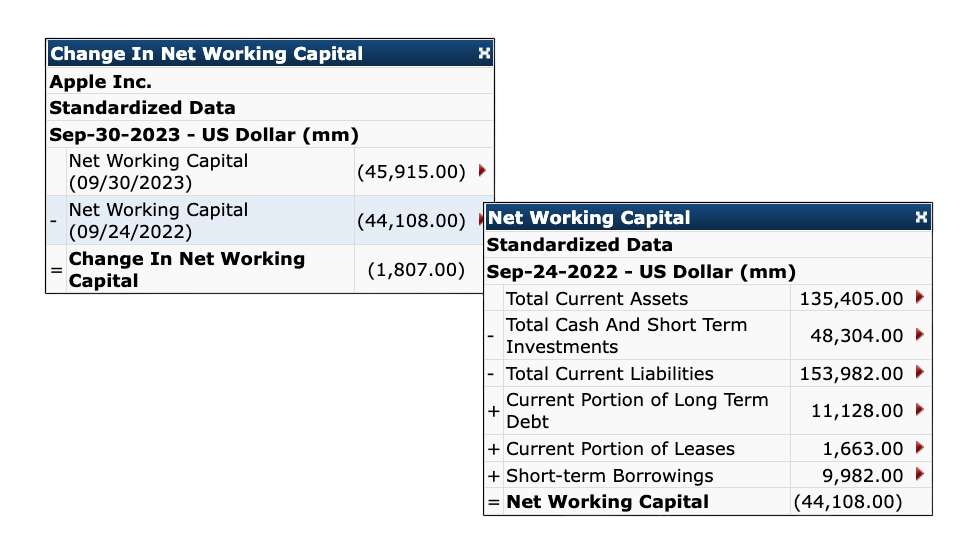
Change in Net Working Capital
Change in Net Working Capital is a line item comprised of the following components:
• Net Working Capital (t)
• Net Working Capital (t-1)
Note: Depending on the type of the financial period ending on (t), (t-1) may reflect the period end date of the previous quarter, the previous fiscal year, or the period end date immediately preceding a year-to-date period ending on (t).
The following example shows the calculation for Apple Inc. as of September 30, 2023.
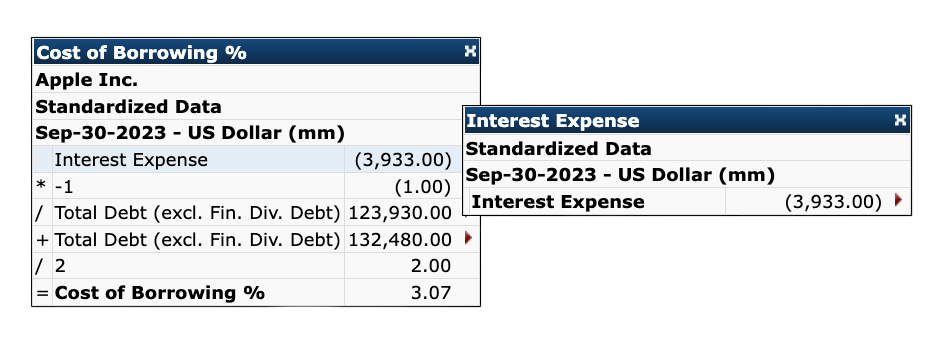
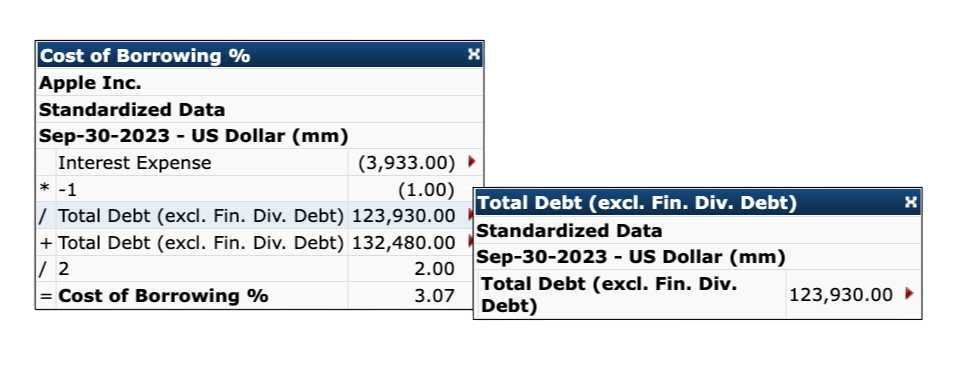
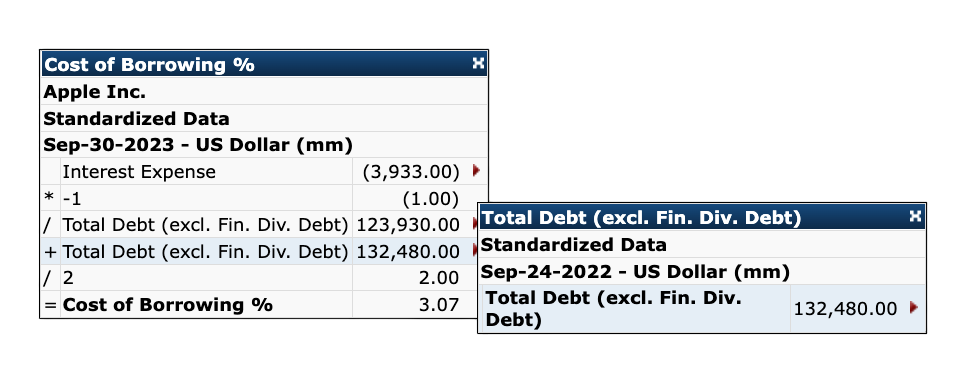
Cost of Borrowings %
Cost of Borrowings % provides an estimate of the company's cost of borrowing based on the interest expense charged and the average debt balance over a particular period. This line item is calculated using the following formula:
Cost of Borrowings % = ((Interest Capitalized )+ (Interest Expense, Total * -1)) / ((Total Debt (excl. Fin. Div. Debt) (t) + Total Debt (excl. Fin. Div. Debt) (t-1)) / 2)
Note: Depending on the type of the financial period ending on (t), (t-1) may reflect the period end date of the previous quarter, the previous fiscal year, or the period end date immediately preceding a year-to-date period ending on (t).
The example below is for Apple Inc. as of September 30, 2023.
Coverage Ratio
The Coverage Ratio represents allowances for loan losses as a percentage of impaired loans.
This item is calculated using the following formula:
• Allowance for Loan Losses / Impaired Loans
Days Outstanding Inventory (Average Inventory)
Days Sales Outstanding represents average number of days a company takes to sell its inventory during a given period. It measures inventory efficiency and how well a company manages stock levels relative to sales.
This item is calculated using the following formula:
((Inventory(t) + Inventory(t-1)) / 2) / Cost of Goods Sold * (Number of Days in the Period)
Notes:
- If both periods of data (t and t-1) are not available then the ratio will be shown as null.
- If the value is greater than 600 days then it will be shown as null.
Days Sales Outstanding (Average Receivables)
Days Sales Outstanding represents the average number of days it takes for a company to collect payments from its customers after making a sale. It is a measure of how efficiently a company manages its accounts receivable and cash flow.
This item is calculated using the following formula:
((Accounts Receivable, Total(t) + Accounts Receivable, Total(t-1)) / 2) / Revenues * (Number of Days in the Period)
Notes:
- If both periods of data (t and t-1) are not available then the ratio will be shown as null.
- If the value is greater than 600 days then it will be shown as null.
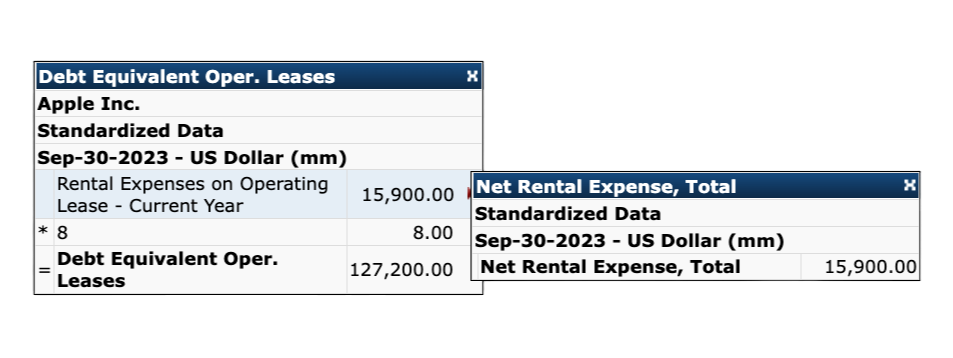
Debt Equivalent Operating Leases
Debt Equivalent Operating Leases represent the amount of additional capital leases on the company's balance sheet if all operating leases were capitalized. This item is calculated using the following formula:
Debt Equivalent Operating Leases = Net Rental Expense, Total * 8
The example below shows the calculation for Apple Inc. as of September 30, 2023.
Debt Paydown Yield %
Debt Paydown Yield % is equal to the net change in long-term debt over the trailing twelve months period divided by the company's market capitalization. It is calculated using the following formula:
Debt Paydown Yield % = ((Total Debt Issued - Total Debt Repaid) / Latest Market Cap)
You can find the Debt Paydown Yield % for a company on the Dividend Snapshot page.

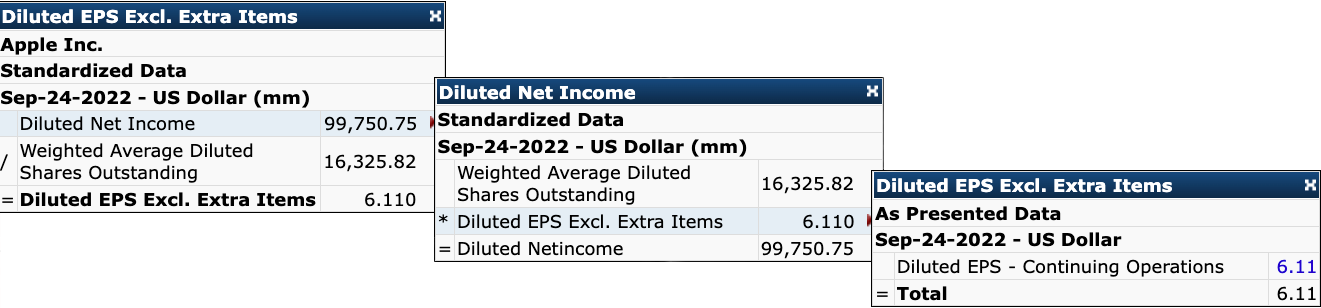
Diluted EPS - Continuing Operations
This is the most common EPS value used by investors which excludes extraordinary items.
This is a GAAP EPS value and includes options expenses and other accounting adjustments. It is calculated using the following formula:
Diluted EPS Continuing Operations = Diluted Net income / Diluted Weighted Average Shares Outstanding
The example below shows the calculation for Apple Inc. as of September 24, 2022.
Downside Capture Ratio (All Funds)
The Downside Capture Ratio measures how much of a benchmark's negative return a fund captured during down-market months. A ratio below 100 indicates the fund lost less than the benchmark in down markets.
This item is calculated using the following formula:
- DCR = Rd / Rb
where
- DCR = Downside Capture Ratio
- Rd = Fund return during months when the benchmark return was negative
- Rb = Benchmark return during those same months
Data is sourced from Morningstar and is available for 1Y, 3Y, 5Y, 10Y, and 15Y periods.
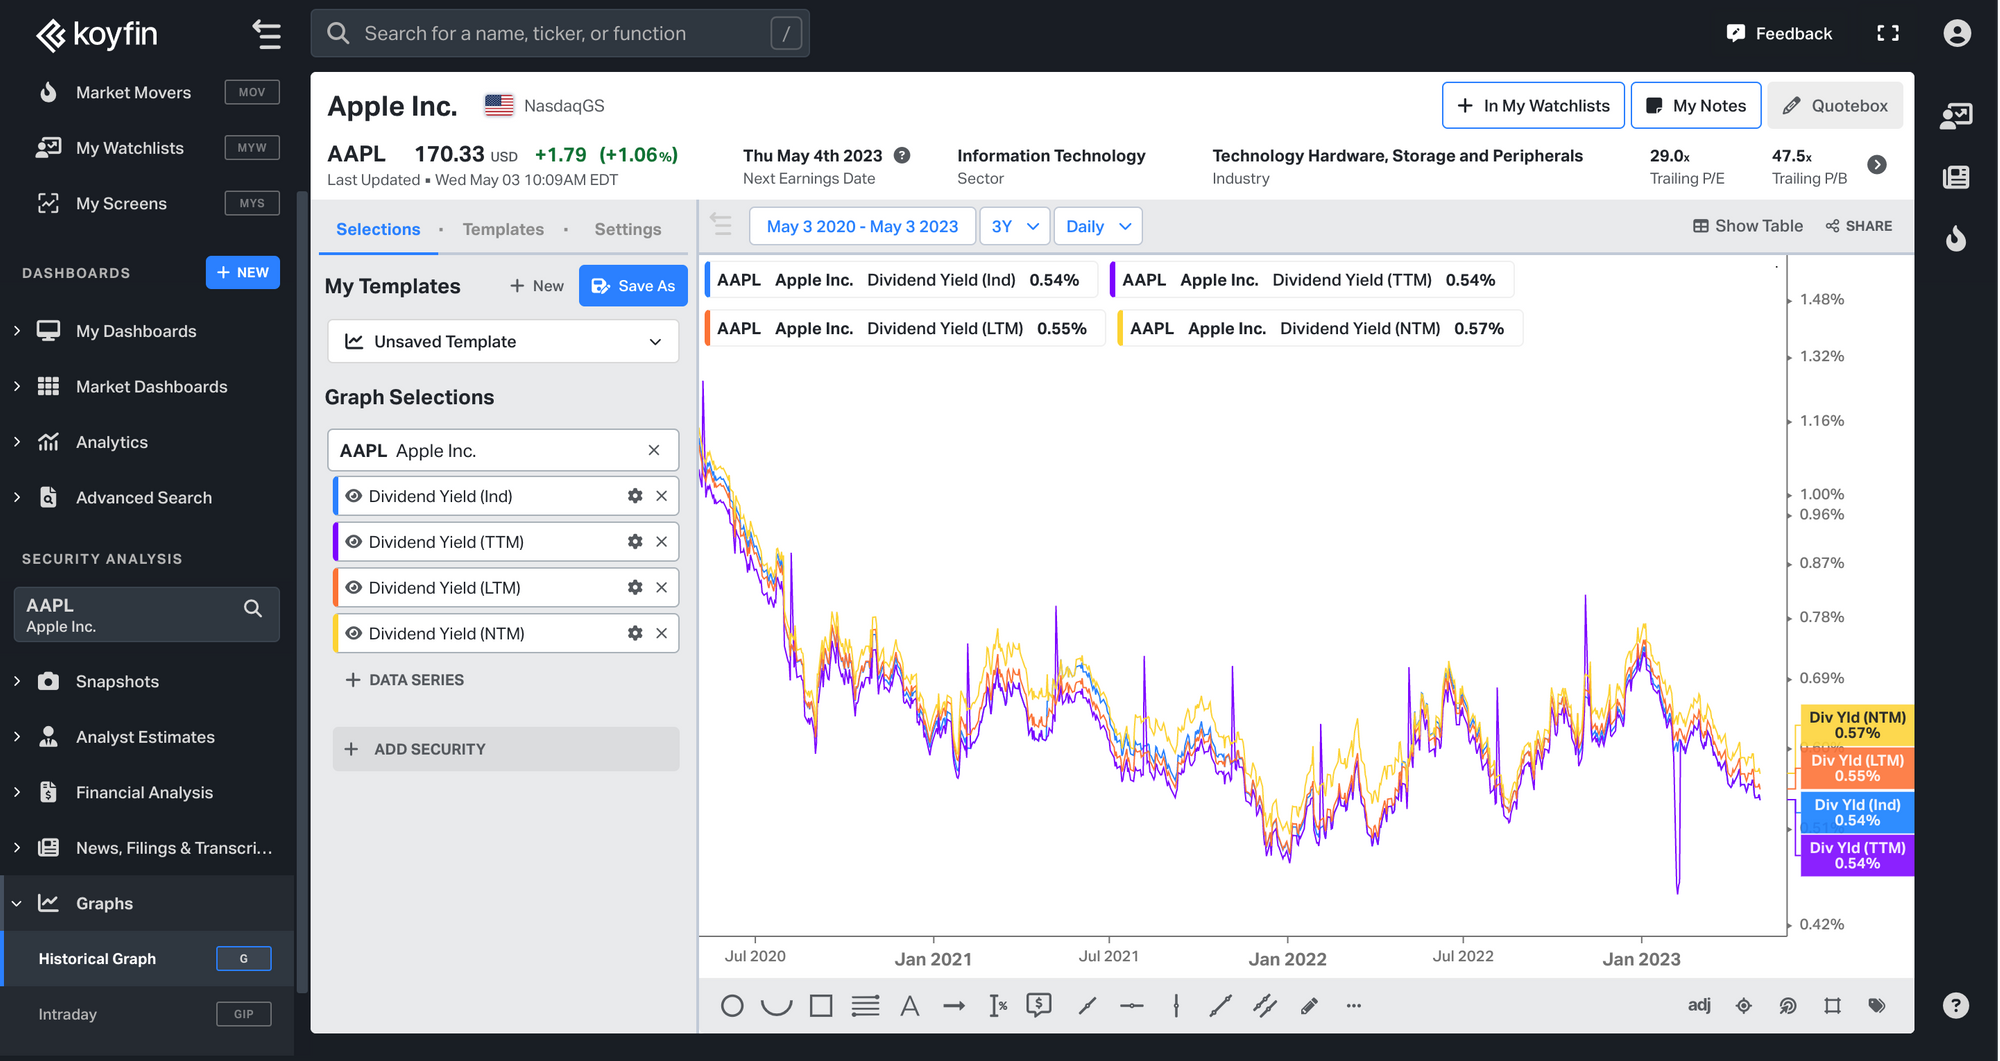
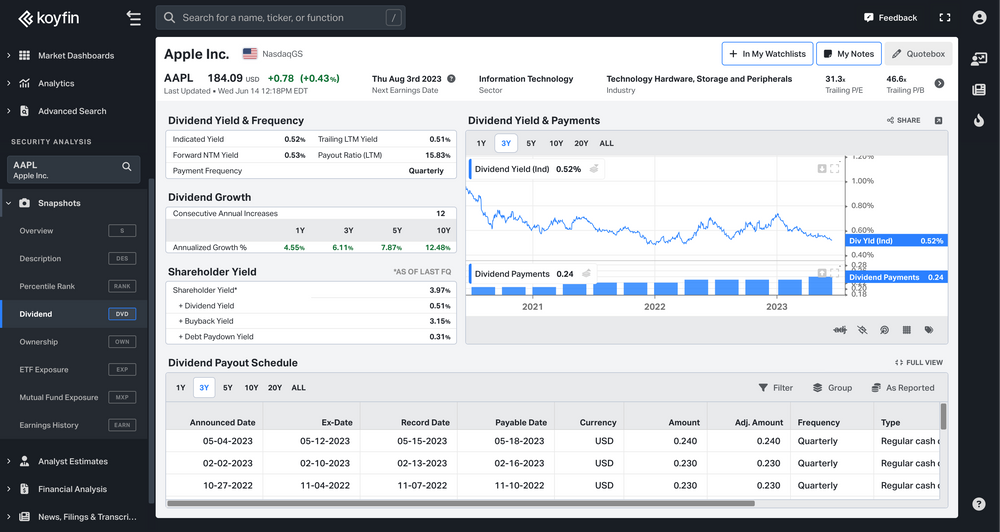
Dividend Yield %
We use the following formula to calculate the Dividend Yield %:
Dividend Yield % = (Dividend amount / Last Price)
There are four types of Dividend Yield %:
- Indicated (IND) — the annualized dividend yield based on the latest dividend payment.
- Trailing-twelve-months (TTM) — the dividend yield based on the latest 12 months of dividends, including special dividends.
- Last-twelve-months (LTM) — the dividend yield based on the latest 12 months of dividends, excluding special dividends.
- Next-twelve-months (NTM) — the dividend yield based on the consensus mean forward 12 months of dividends.
Here's an example graph of the different types of Dividend Yield % for Apple Inc.
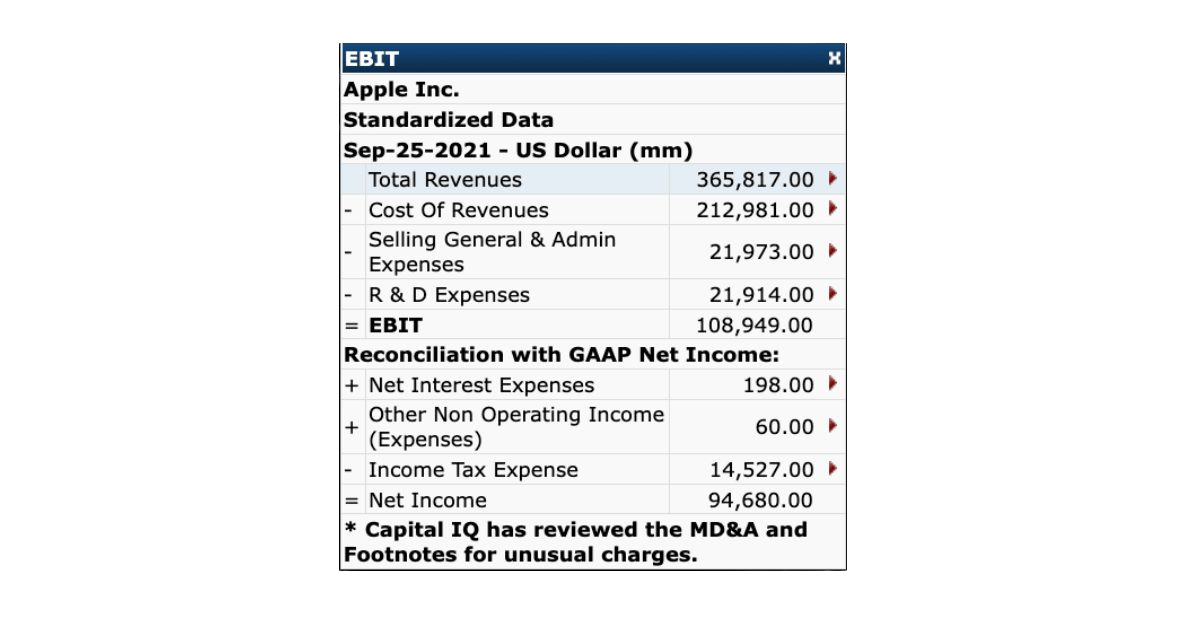
EBIT
EBIT is Earnings before interest and taxes, and is equal to Operating Income.
The example below shows the calculation for Apple Inc. as of September 25, 2021.
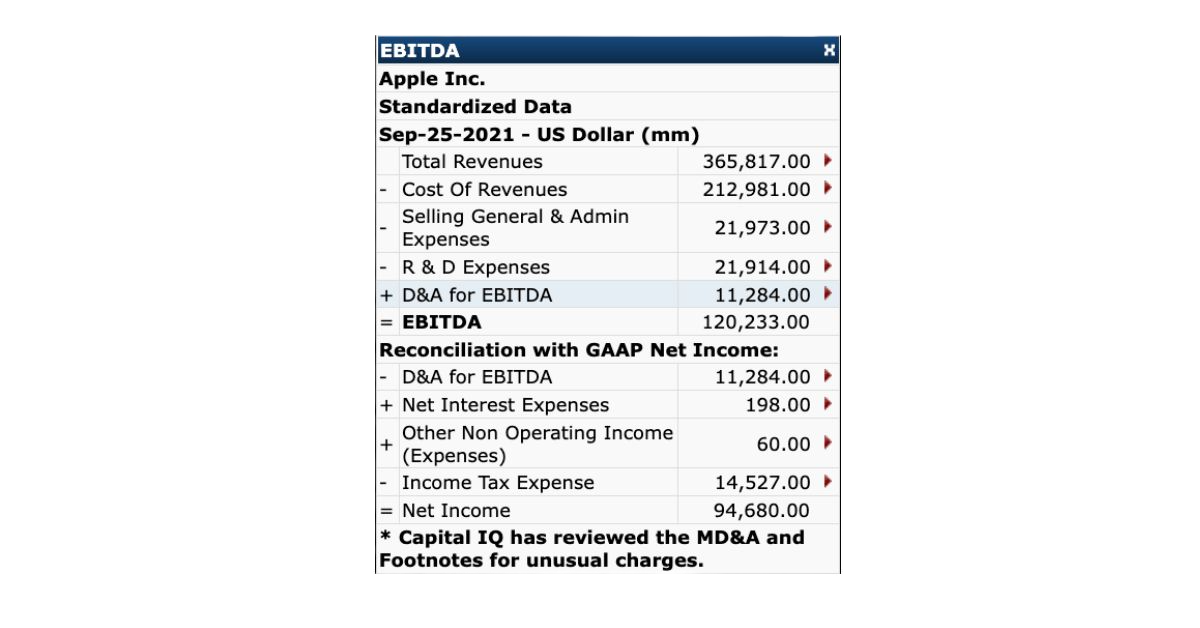
EBITDA
EBITDA, or Earnings before interest expense, taxes, depreciation and amortization, is a financial metric used to evaluate a company's profitability.
Starting in 2019, EBITDA was adjusted for leases as per FASB rules. For more information on this topic, please refer to this article. The example below shows the calculation for Apple Inc. as of September 25, 2021.
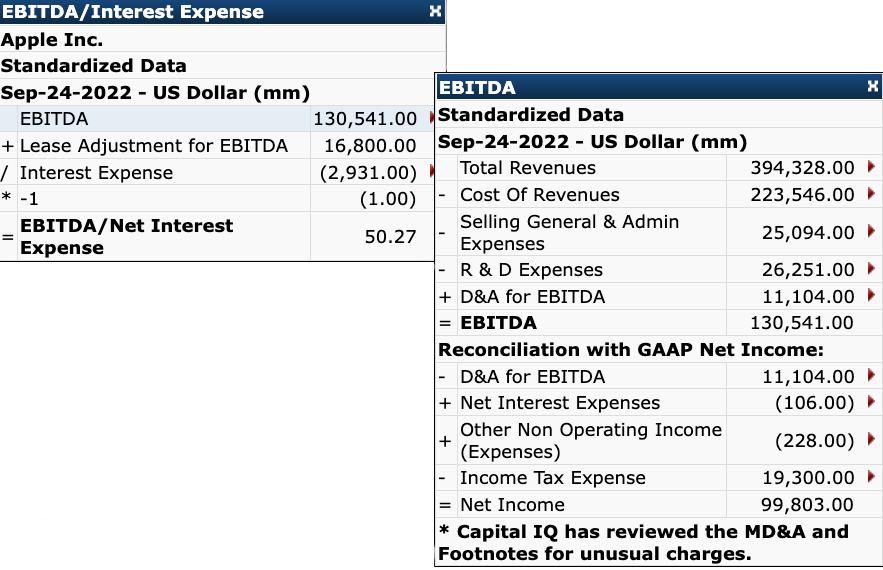
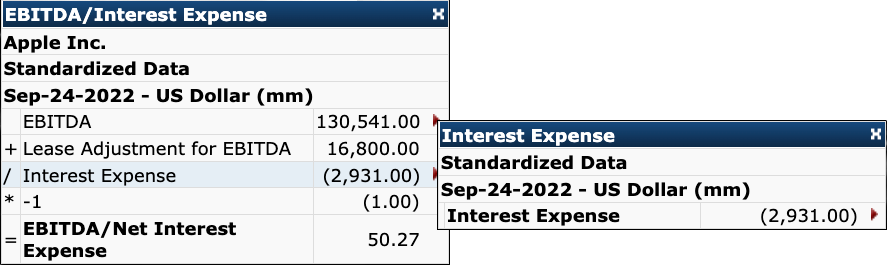
EBITDA / Interest Expense
The interest coverage ratio shows the ability of a firm to meet its interest expenses.
The example below is for Apple Inc. as of September 24, 2022.
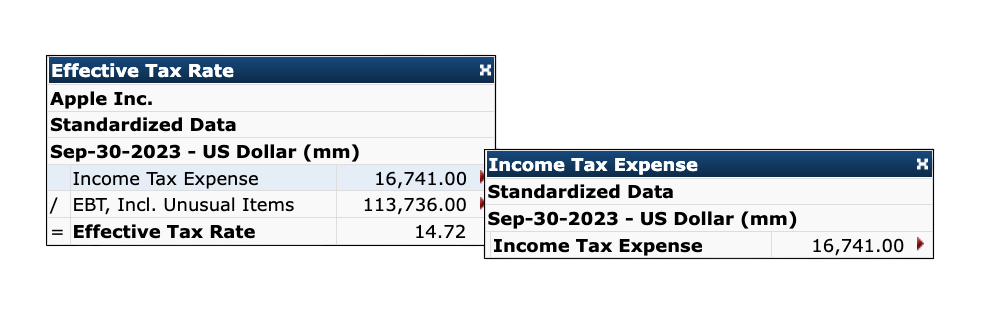
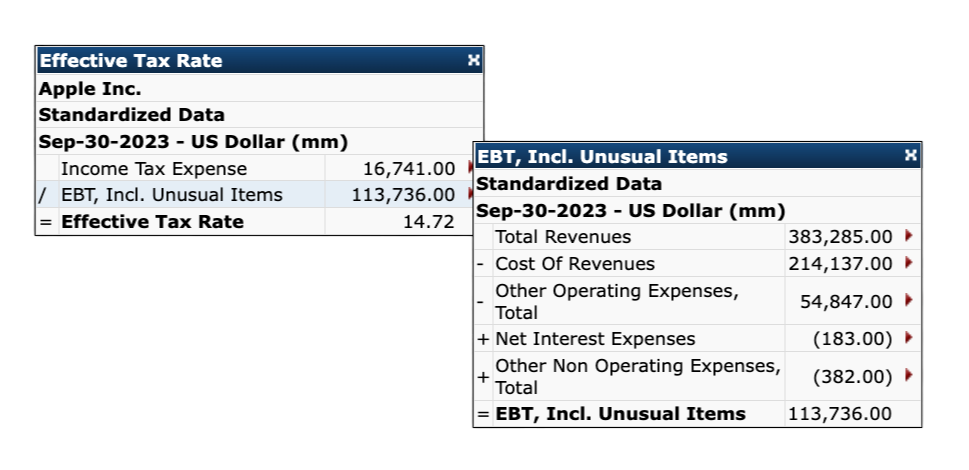
Effective Tax Rate - (Ratio)
Effective Tax Rate - (Ratio) is calculated using the following formula:
Effective Tax Rate - (Ratio) = Income Tax Expense / EBT, Inc. Unusual Items
The example below shows the calculation for Apple Inc. as of September 30, 2023.
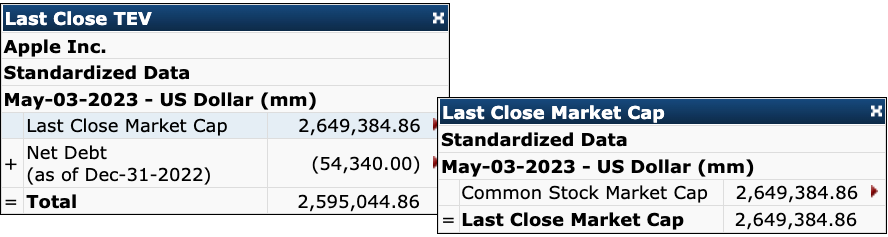
Enterprise Value
Filing Date Total Enterprise Value represents the cash-less value of a firm as an asset as of the filing date of the balance sheet period end date.
To calculate the Filing Date Market Capitalization, we use the following formula:
Filing Date MarketCap = Book Value of Total Debt + Book Value of Preferred Stock + Book Value of Minority Interest - Cash & Short Term Investments
The example below is for Apple Inc. as of May 3, 2023.
EPS 5Y Fwd Growth (NTM)
The EPS 5Y Fwd Growth is an estimate of the average rate of earnings growth an analyst expects over a five year period and is expressed as a percentage increase per year. Long-term growth is non-periodic estimate in that the estimate is not for a specified time period. As such, there will be only one estimate (not the usual five forward yearly estimates) and will not have actual figures. Mean is the arithmetical mean average of the forecasts after suppressed forecasts are excluded.
The estimate may not match the bottom-up estimates which cover the same period.
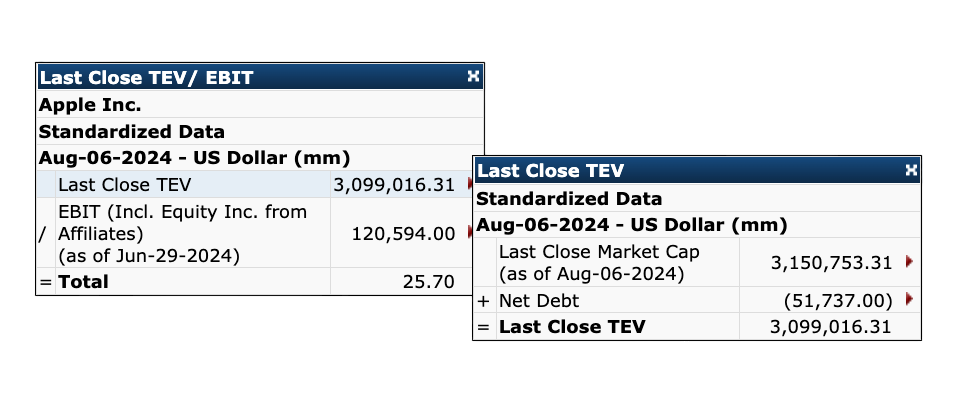
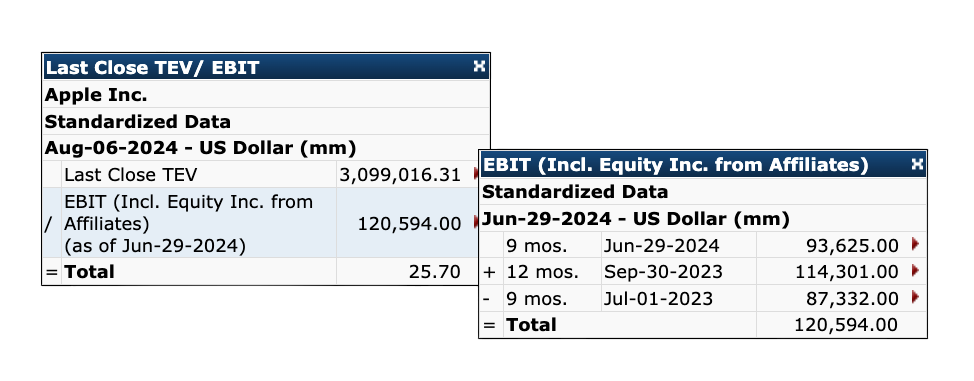
EV / EBIT
To calculate the EV / EBIT ratio, we use the following formula:
EV / EBIT = Last Close Total Enterprise Value / EBIT (including equity income from affiliates)
The following example shows the calculation for Apple Inc. as of August 6, 2024.
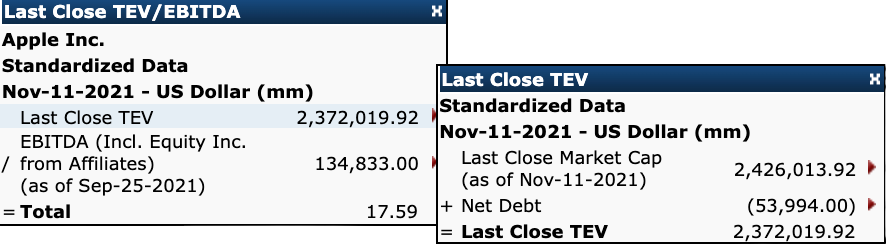
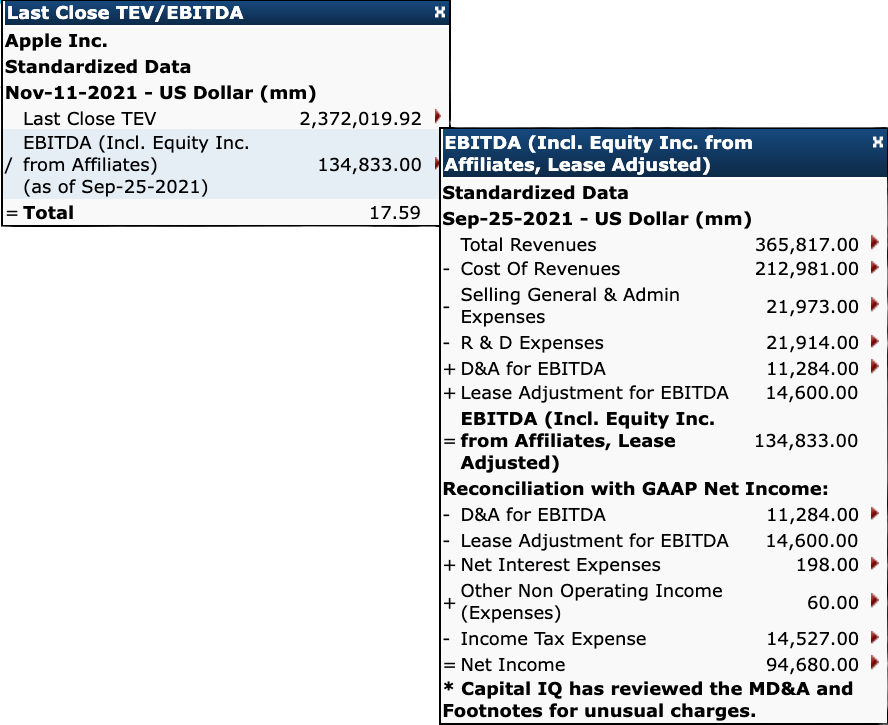
EV / EBITDA
We use the following formula to calculate the EV / EBITDA ratio:
EV / EBITDA = Last Close Total Enterprise Value / EBITDA (including equity from affiliates and adjusted for lease expenses)
The example below shows the calculation for Apple Inc. as of November 11, 2021.
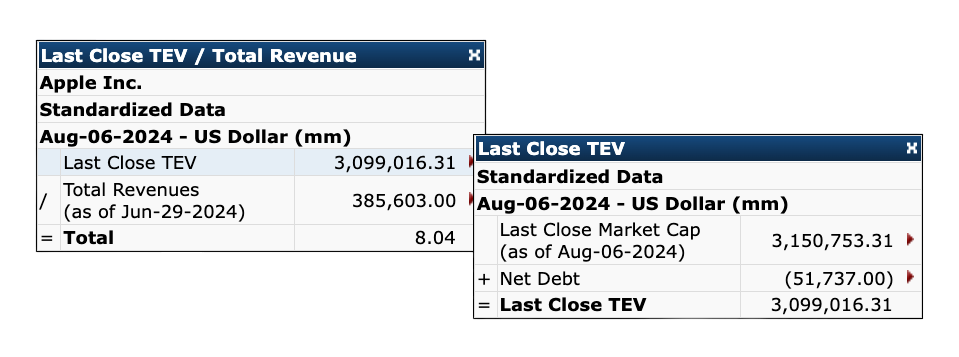
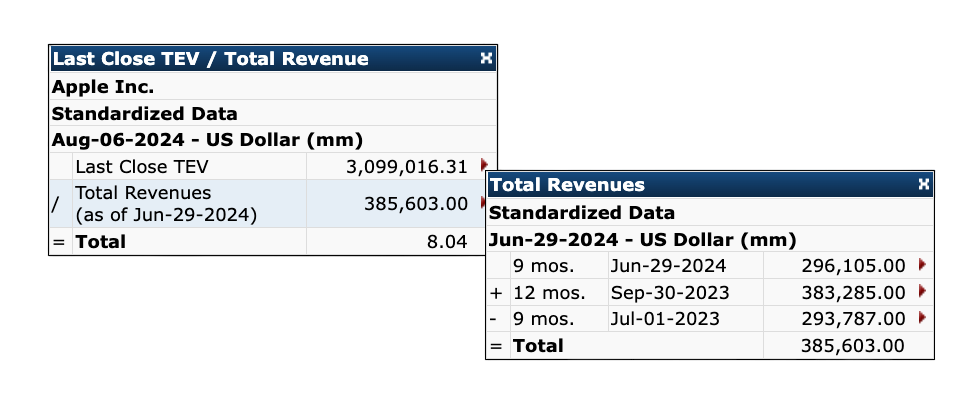
EV / Sales
The EV / Sales ratio is calculated by using the following formula:
EV / Sales = Last Close Total Enterprise Value / Total Revenues
The example below is for Apple Inc. as of August 6, 2024.
Forward Estimates / Forward Growth
In the Analyst Estimates category you will find data series for Forward Estimates and Forward Growth.
Forward Estimates provide the notional values of the estimates.
- For example, the average revenue estimate for Apple (AAPL) in FY25 is $414.53 billion.
Forward Growth provide the change in values of the estimates, represented as a notional or percentage value.
- For example, the average revenue growth estimate for Apple (AAPL) in FY25 is $23.49 billion OR;
- The average revenue growth % estimate for Apple (AAPL) in FY25 is 6.01%.
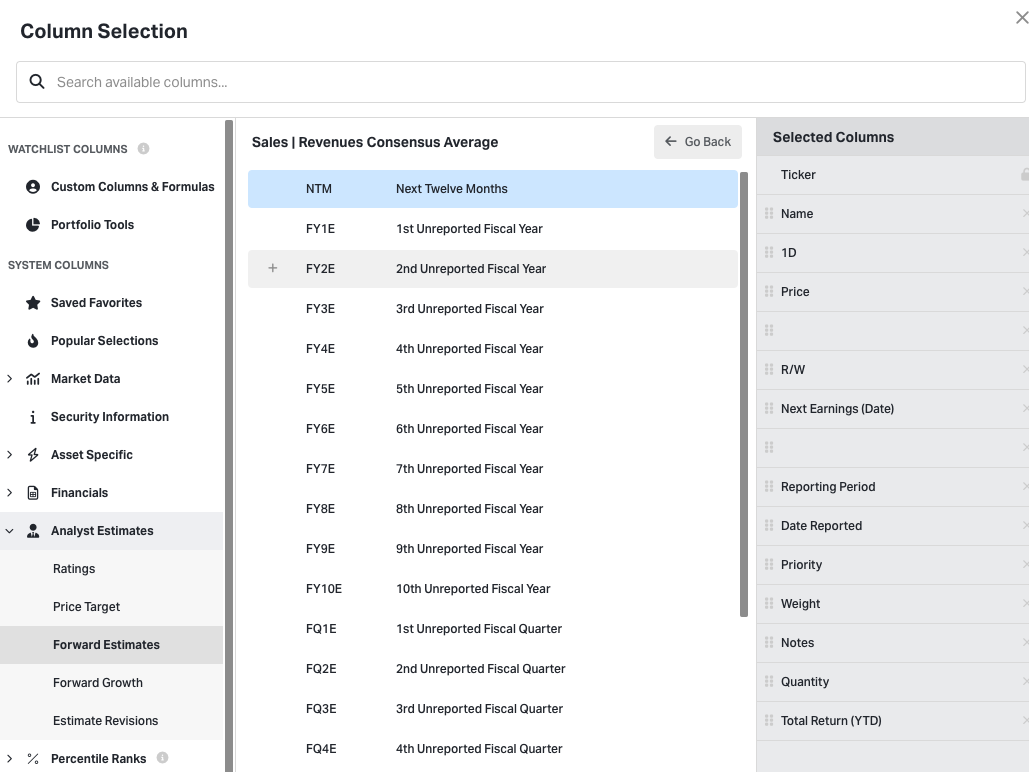
Format
The columns are formatted as follows:
- FY1E ➝ 1st Unreported Fiscal Year
- FY2E ➝ 2nd Unreported Fiscal Year
For example, if AAPL has reported its fiscal 2023 earnings, the 1st unreported fiscal year would be 2024. The 2nd unreported fiscal year would be 2025, and so on.
- FQ1E ➝ 1st Unreported Fiscal Quarter
- FQ2E ➝ 2nd Unreported Fiscal Quarter
For example, if AAPL has reported its fiscal Q4 2023 earnings, the 1st unreported quarter year would be Q1 2024. The 2nd unreported fiscal year would be Q2 2024, and so on.
- Estimate Y/Y Change % ➝ The year-over-year change, as a percentage
- Estimate Y/Y Change ➝ The year-over-year, as a notional value
- Estimate Q/Q Change % ➝ The quarter-over-quarter change, as a percentage
- Estimate Q/Q Change ➝ The quarter-over-quarter change, as a notional value
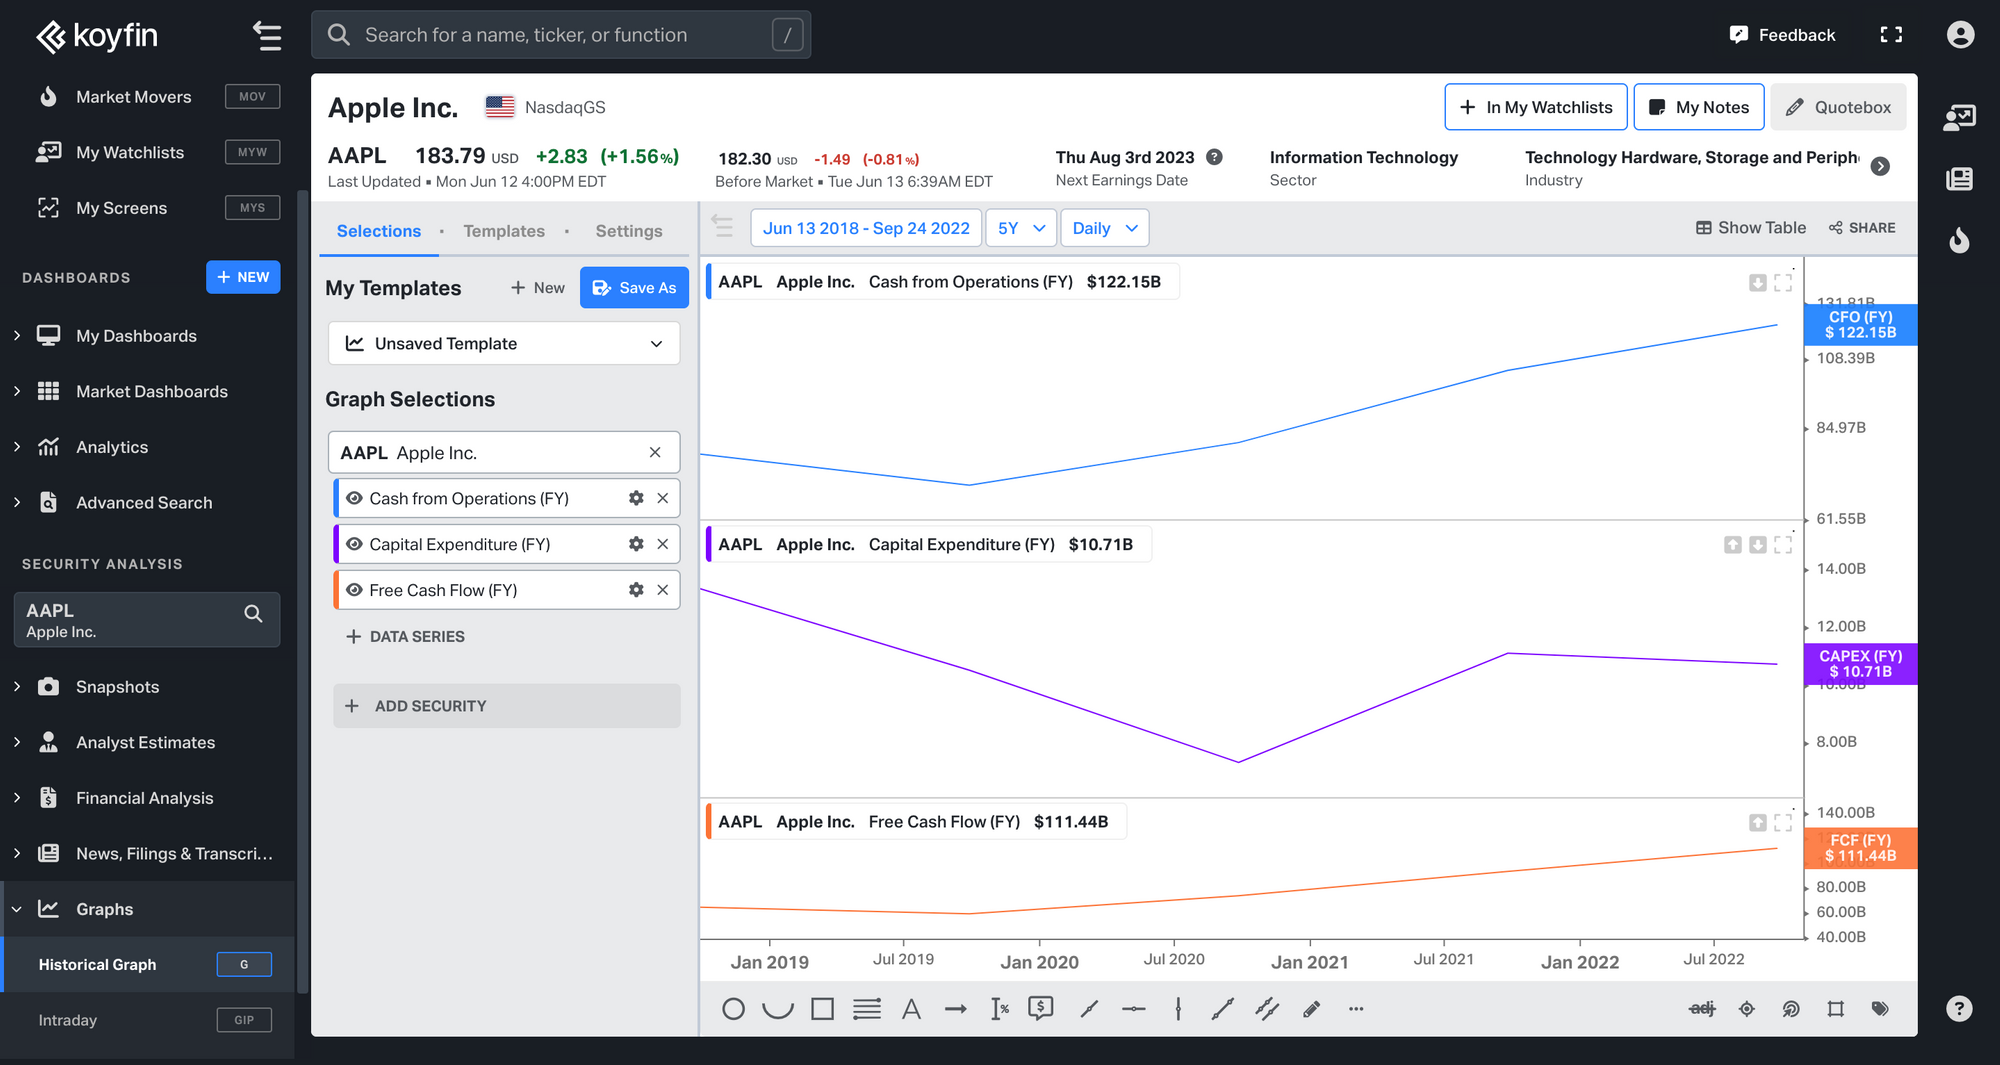
Free Cash Flow
The formula for Free Cash Flow is FCF = Cash Flow from Operations - Capex.
You can visualize the Free Cash Flow of a company using the G chart.
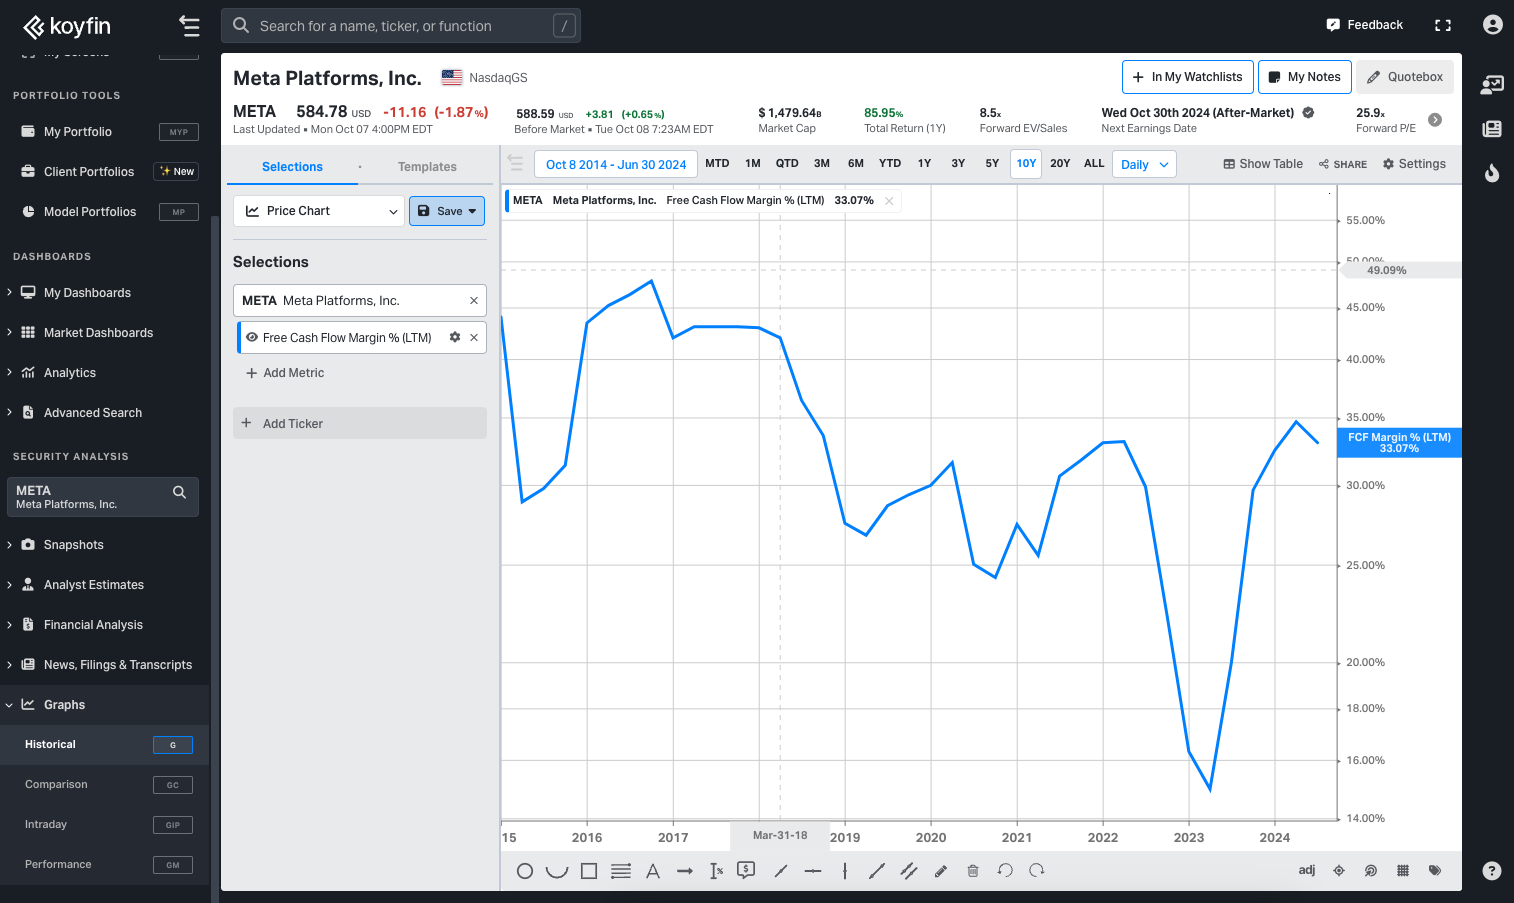
Free Cash Flow Margin %
The formula for Free Cash Flow Margin is FCF Margin = (Cash Flow from Operations - Capex) / Total Revenue
You can visualize the Free Cash Flow Margin of a company using the G Chart.
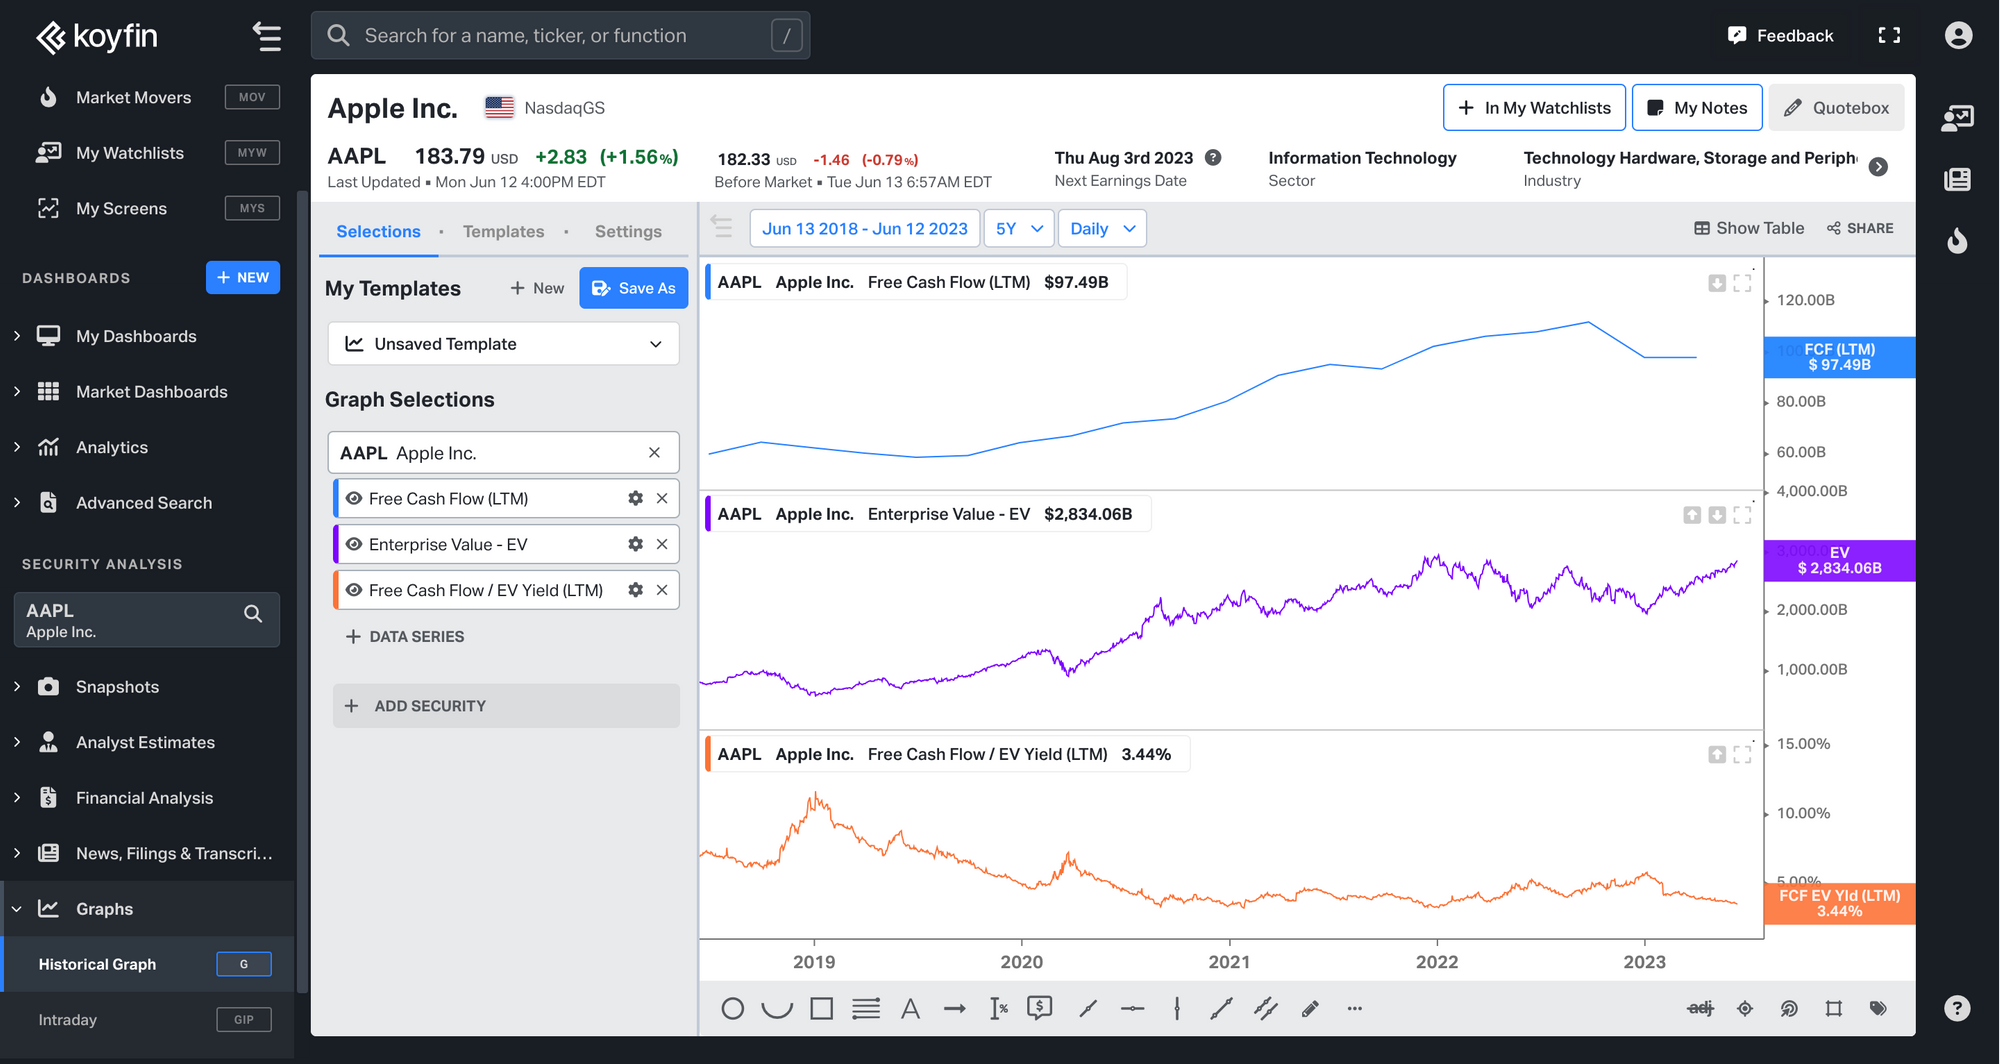
Free Cash Flow / EV Yield %
To calculate the Free Cash Flow / EV Yield %, we use the following formula:
FCF / EV Yield % = FCF / EV
You can view a graph of Apple Inc.'s Free Cash Flow / EV Yield % over the past 5 years on Koyfin.
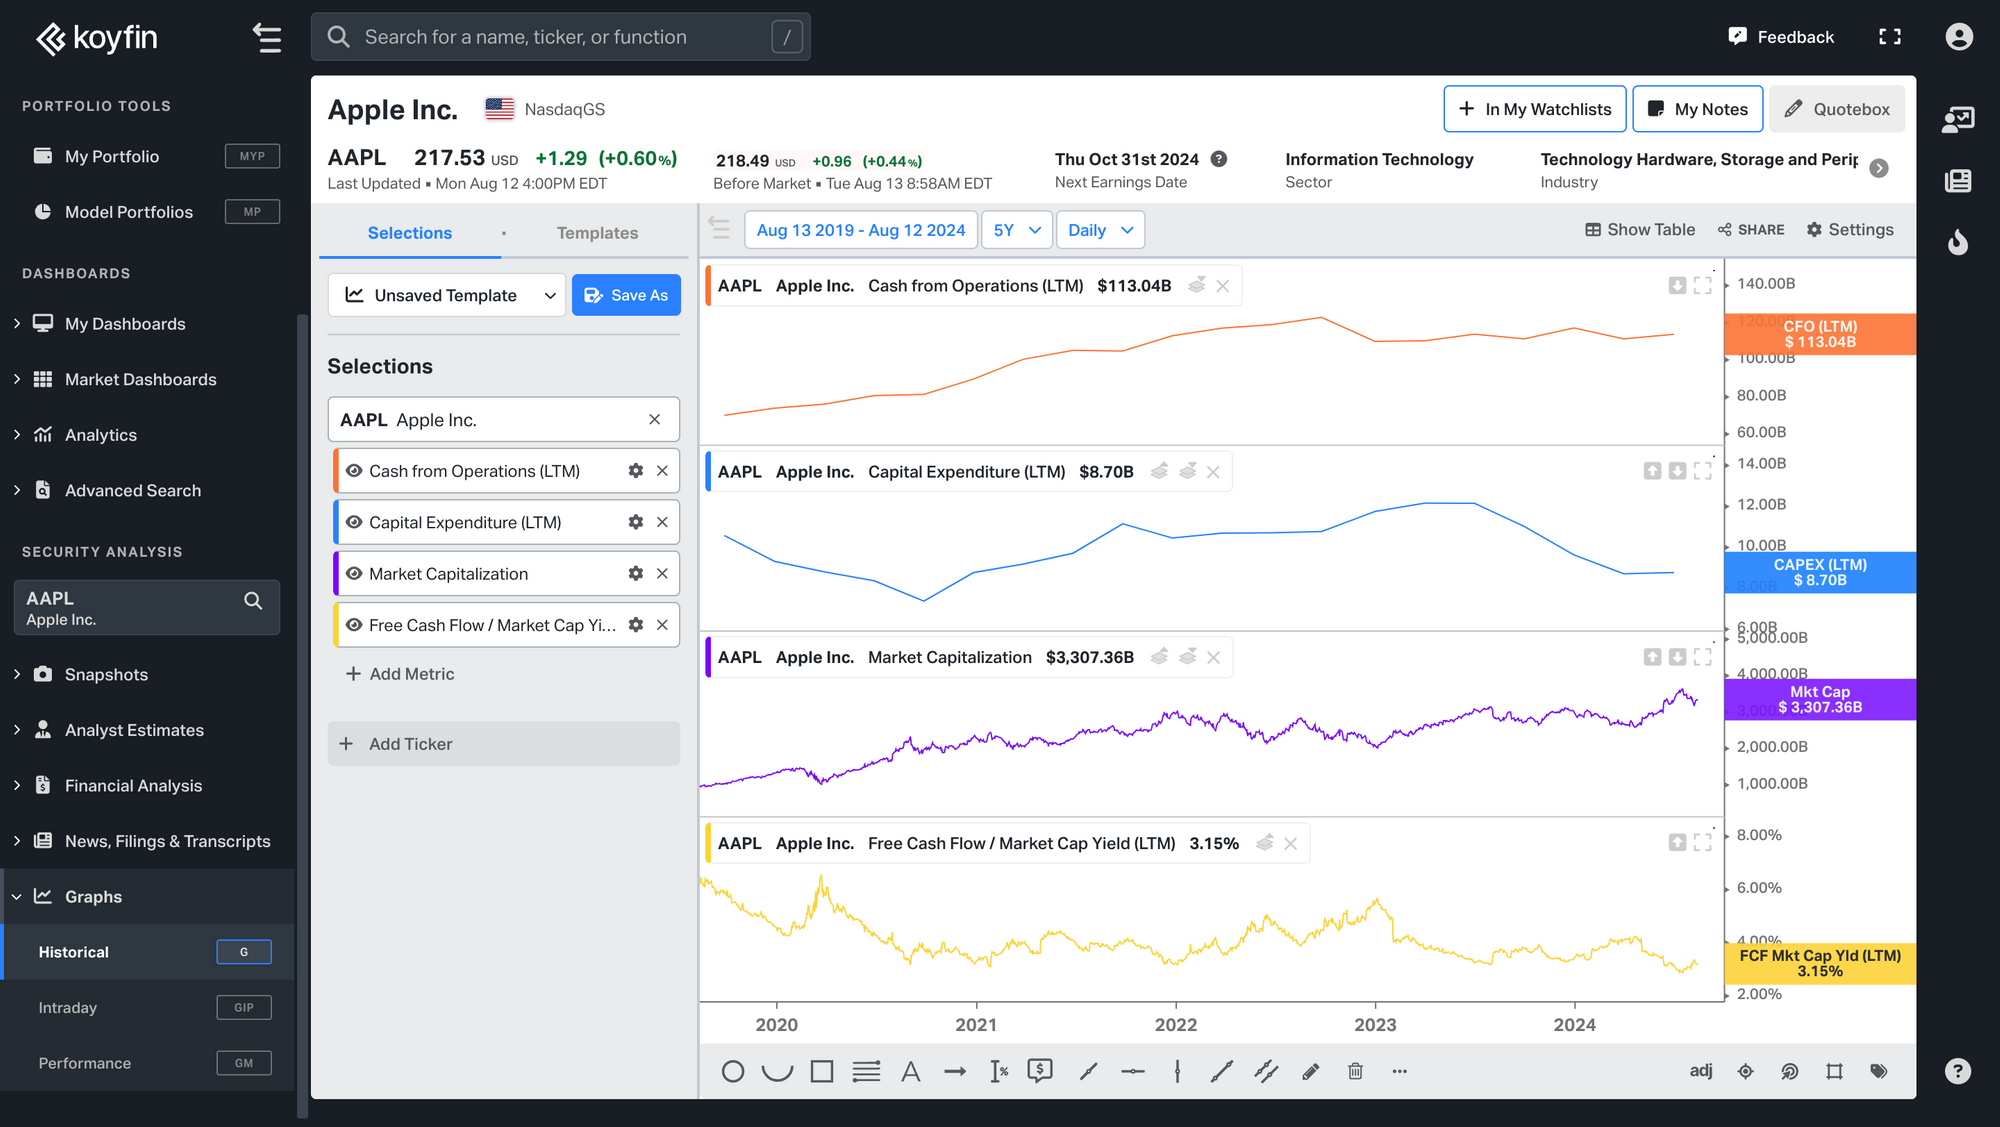
Free Cash Flow / Market Cap Yield %
We calculate the Free Cash Flow / Market Cap Yield % using the following formula:
Free Cash Flow / Market Cap Yield % = ((Cash from Operations) - (CAPEX))/ Market Cap * 100
You can view a graph of Apple Inc.'s Free Cash Flow / Market Cap Yield % over the past 10 years on Koyfin.
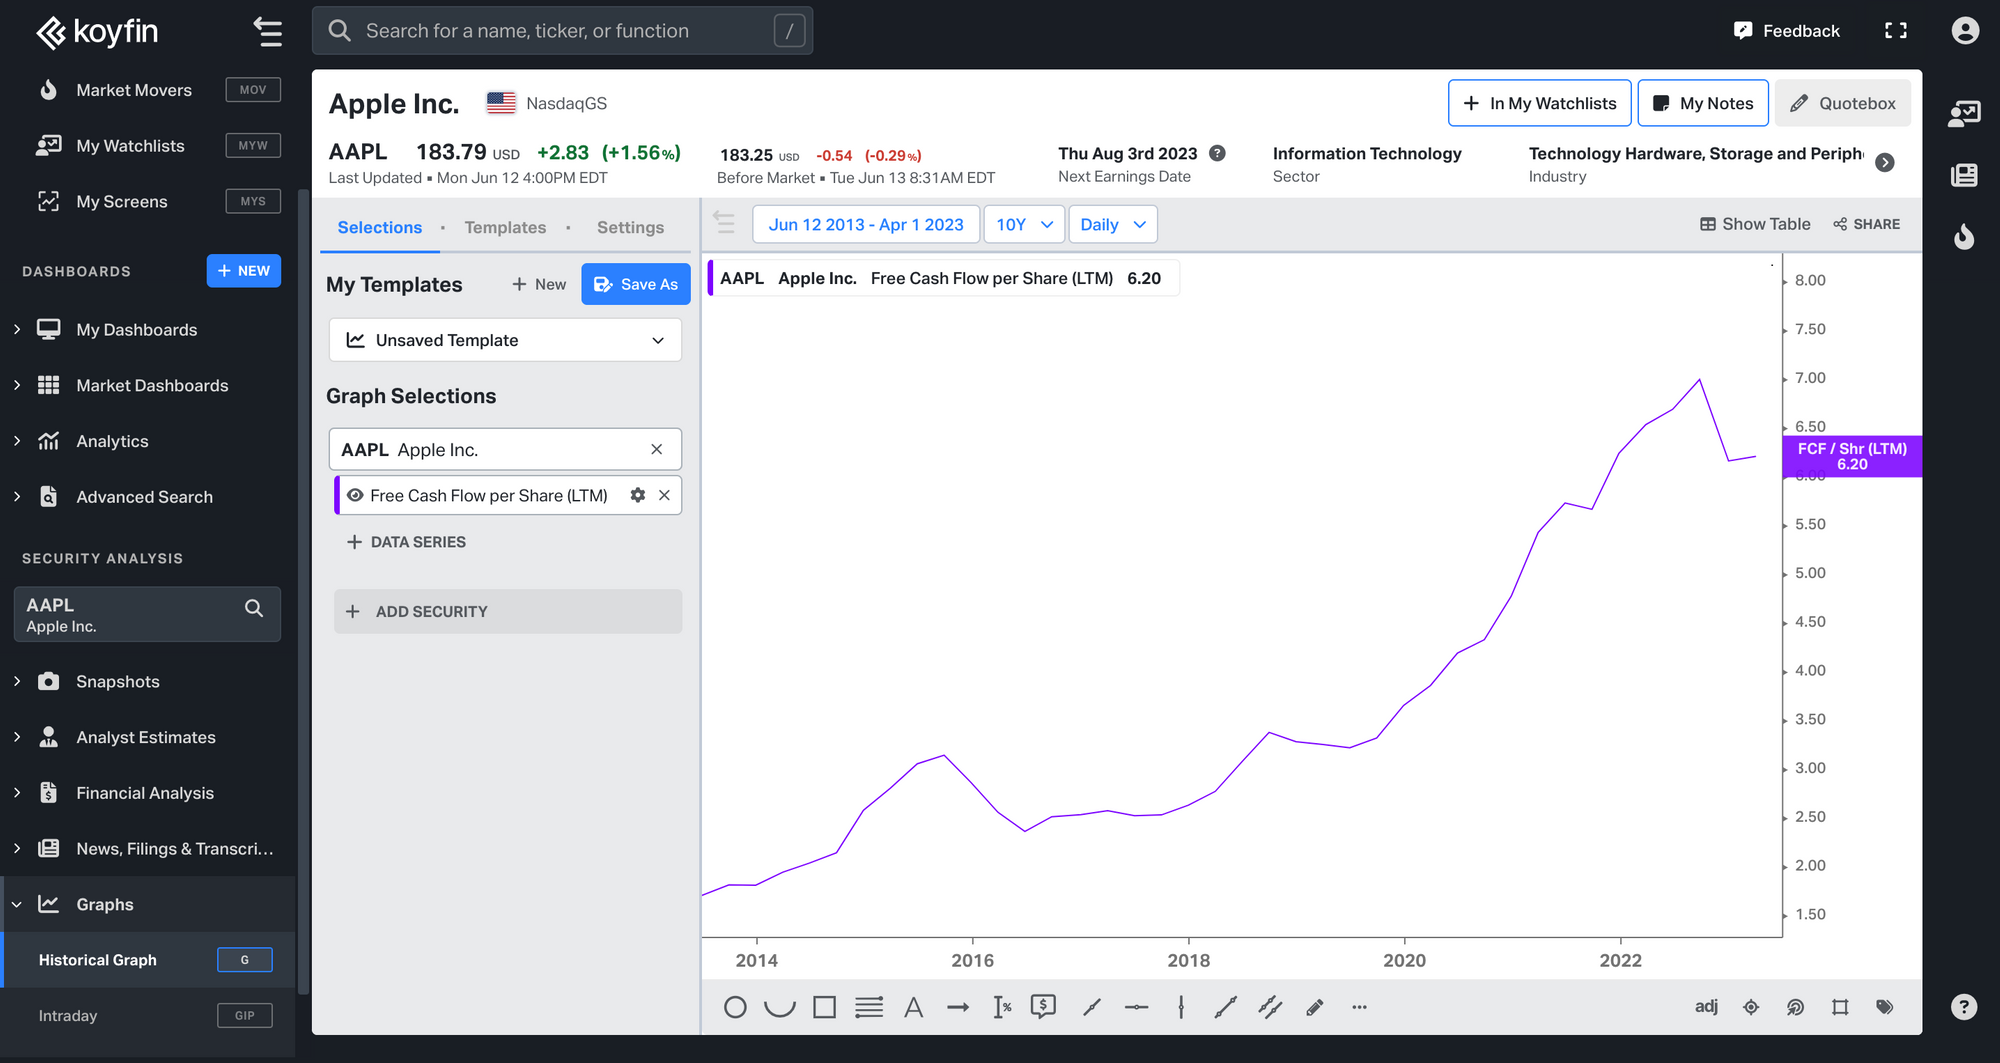
Free Cash Flow per Share
We calculate Free Cash Flow per Share ourselves using Free Cash Flow / Shares Outstanding.
You can see how Apple Inc. has performed over the past 10 years by looking at the Free Cash Flow per Share of AAPL in the G chart.
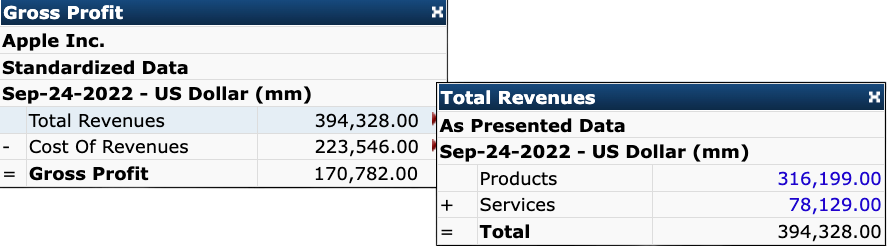
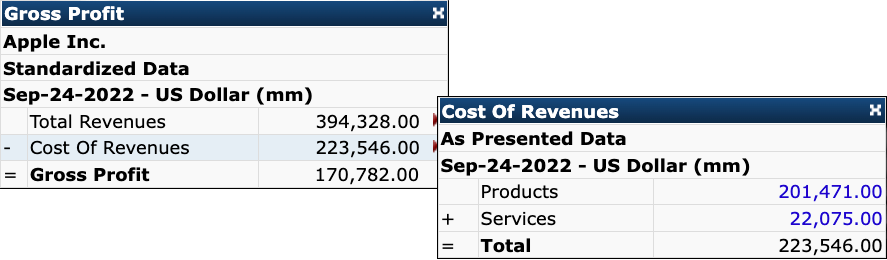
Gross Profit
We use the following formula to calculate Gross Profit:
Gross Profit = Total Revenues - Cost of Revenues
The example below is for Apple Inc. as of September 24, 2022.
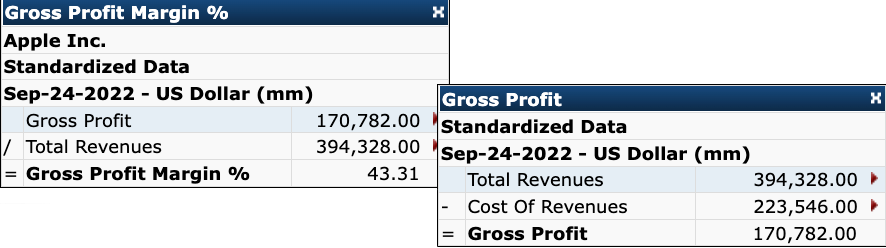
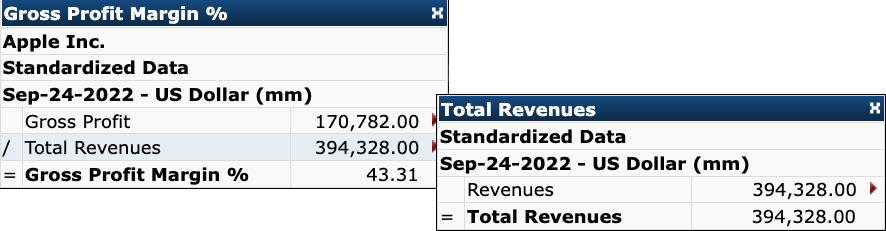
Gross Profit Margin %
Gross Profit Margin % is calculated by dividing the gross profit by the total revenues and expressed as a percentage. The formula for calculating Gross Profit Margin % is as follows:
Gross Profit Margin % = Gross Profit / Total Revenues
The example below shows the calculation for Apple Inc. as of September 24, 2022.
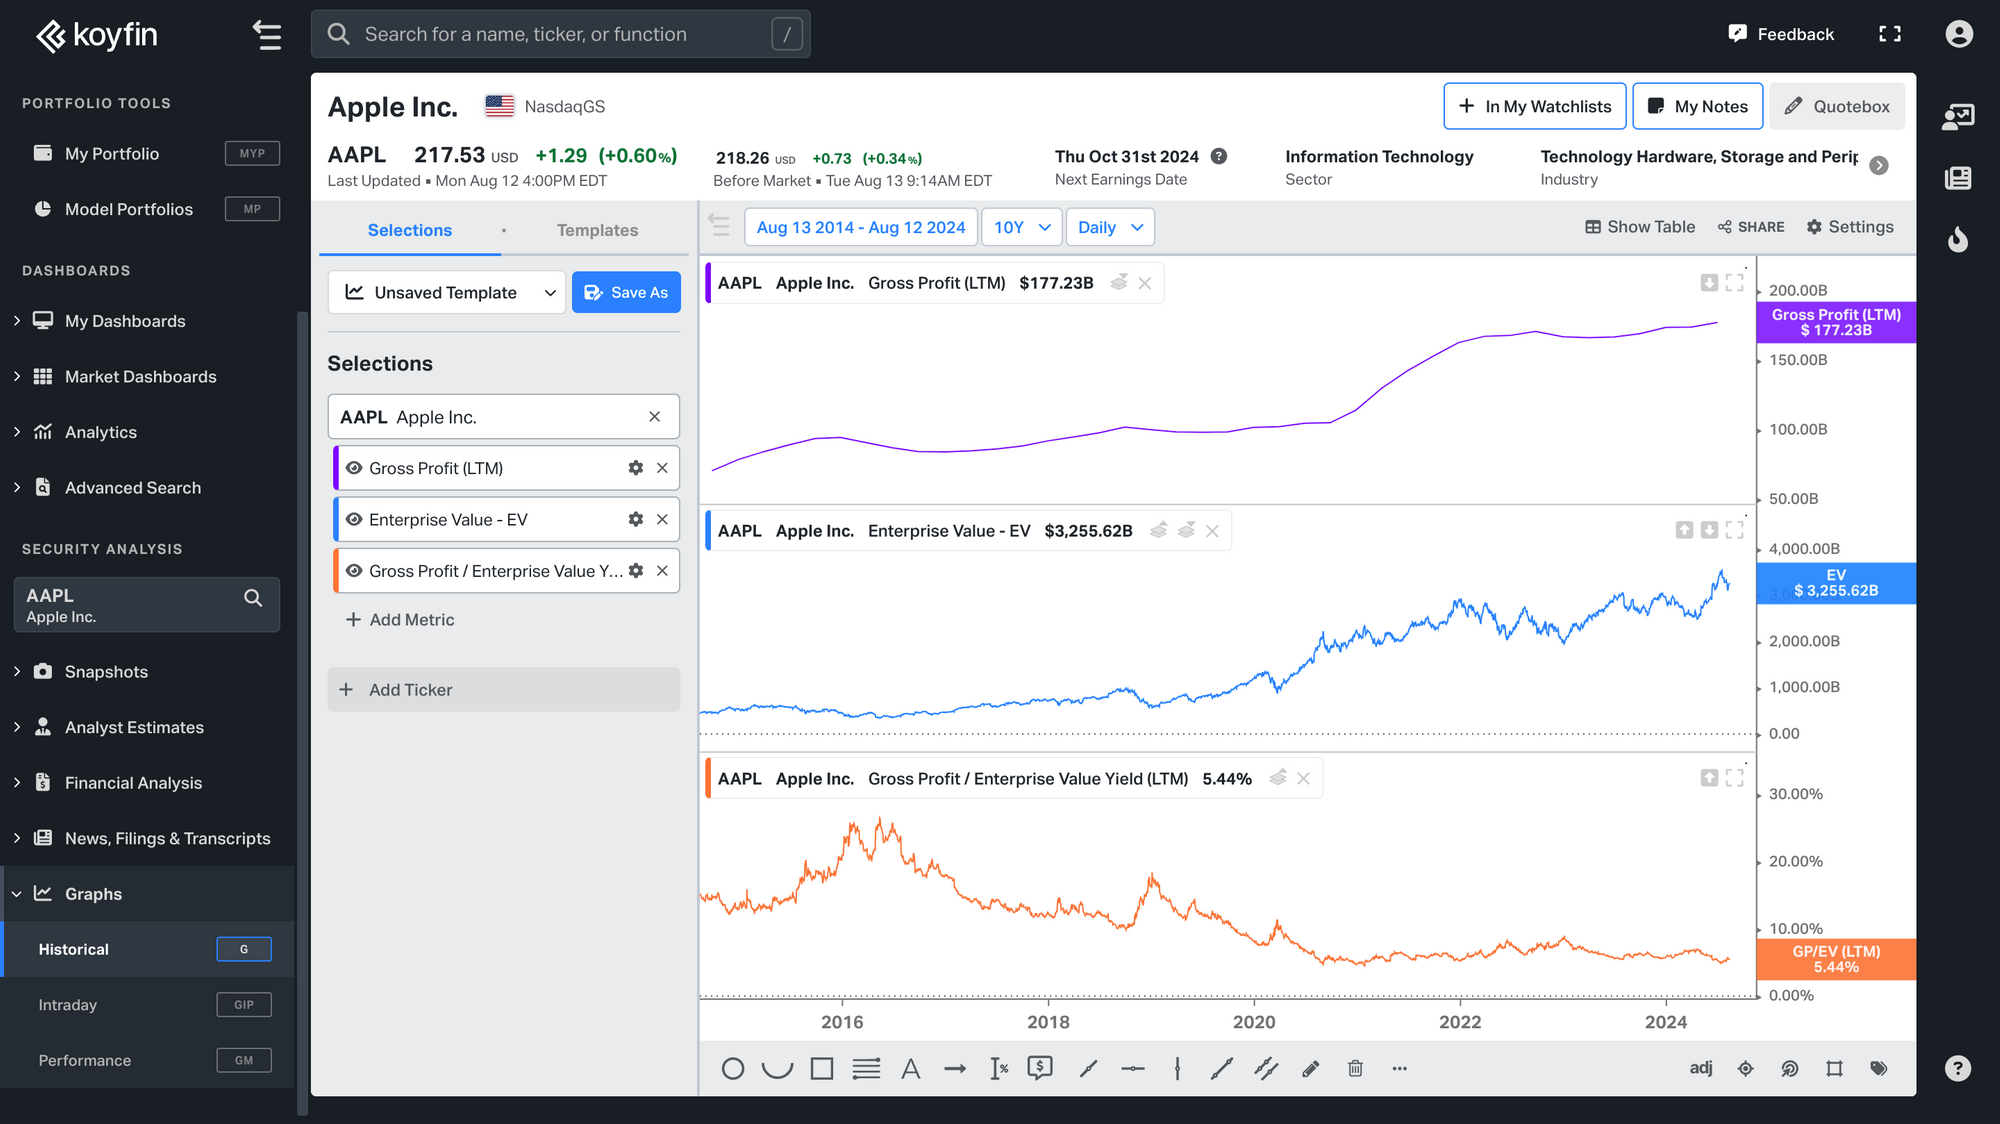
Gross Profit / EV Yield %
To calculate the Gross Profit / EV Yield %, we use the following formula:
Gross Profit / EV Yield % = Gross Profit LTM / Enterprise Value * 100
You can visualize the Gross Profit / EV Yield % of a company on the G chart.
Gross Profit / Market Cap Yield %
We use the following formula to calculate the Gross Profit / Market Cap Yield %:
Gross Profit / Market Cap Yield % = Gross Profit LTM / Market Cap * 100
To visualize the Gross Profit / Market Cap Yield % of a company, you can refer to the G chart.

Information Ratio (All Funds)
The Information Ratio is a special version of the Sharpe Ratio, but unlike the Sharpe Ratio, the benchmark is the fund's assigned benchmark rather than the risk-free rate. A higher Information Ratio indicates more consistent outperformance relative to the benchmark.
This item is calculated using the following formula:
- IR = (Rf − Rb) / TE
where
- IR = Information Ratio
- Rf = Return of the fund
- Rb = Return of the benchmark
- TE = Tracking Error (standard deviation of the excess return)
Data is sourced from Morningstar and is available for 1Y, 3Y, 5Y, 10Y, and 15Y periods.
Inventory
Inventory is a line item that includes the following components:
• Inventories - Raw Materials
• Inventories - Work In Process
• Inventories - Finished Goods
• Inventories - Progress Payments and Others
• Other Real Estate Owned And Foreclosed
• LIFO Reserve
• Allowance for Inventory (BS)
• Advances for Supplies
The line item includes:
• Inventory
• Supplies
• Parts, spares and sub-assemblies
• Merchandise inventories
• Packing materials
• Tubular goods
• Customer service parts and equipment
• Other items qualified as inventory with regard to the nature of business of the company such as residential homes and land, securities, timber or lumber, crude oil, fuel and petroleum products etc.
The following rules apply:
• Prepayments or advances or any other line item given under the Inventory heading is categorized as Inventory.
• If Work-In-Progress appears as a separate line item, then this item is searched in the notes. If attributable profit is included, then it is categorized as Accounts Receivable, otherwise it is categorized as Inventory.
The following rules apply for investment properties and properties under development:
• In the case of Real Estate companies reporting both Properties for Sale and Rentals it is categorized as Inventory/Other Long Term Assets. If attributable profit is included, it is categorized as Accounts Receivable/Accounts Receivable Long Term.
• In the case of Real Estate Operations having only a Property sales business, then it is categorized as Inventory/Other Long Term Assets.
• In the case of Real Estate Operations having only a Rental business then this is categorized as Other Current Assets/Property Plant and Equipment.
• In the case of other businesses it is categorized as Other Current Assets/Other Long Term Assets.
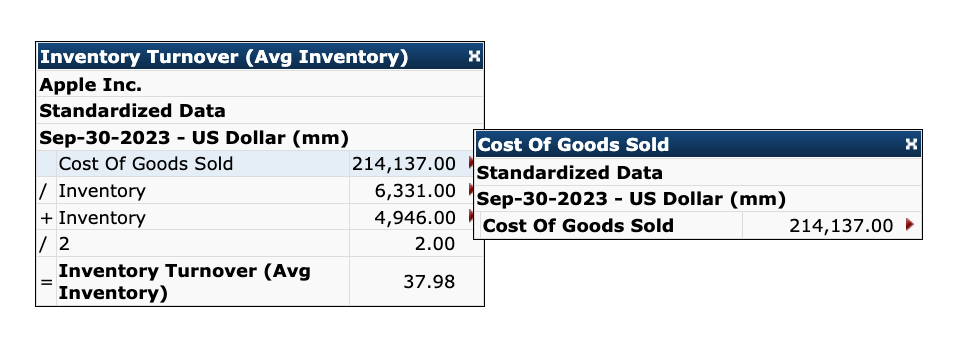
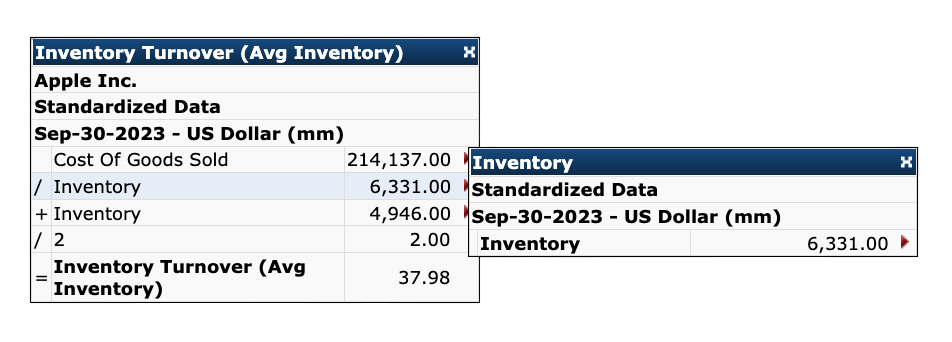
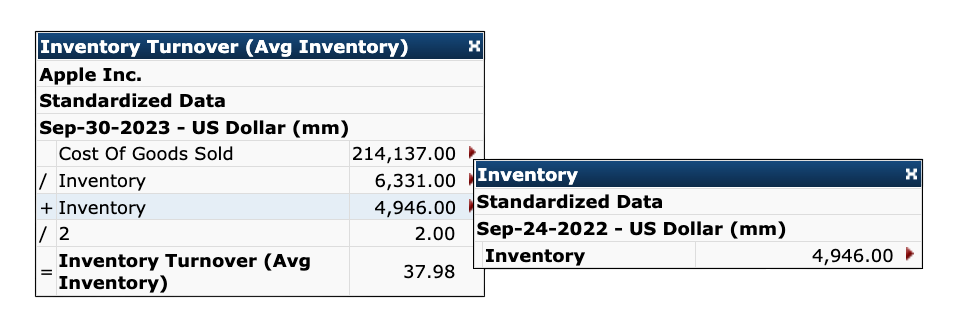
Inventory Turnover
The formula for calculating Inventory Turnover is as follows:
Inventory Turnover = Cost of Goods Sold, Total / ((Inventory (t) + Inventory (t-1)) / 2)
Below is an example showing the calculation for Apple Inc. as of September 30, 2023.
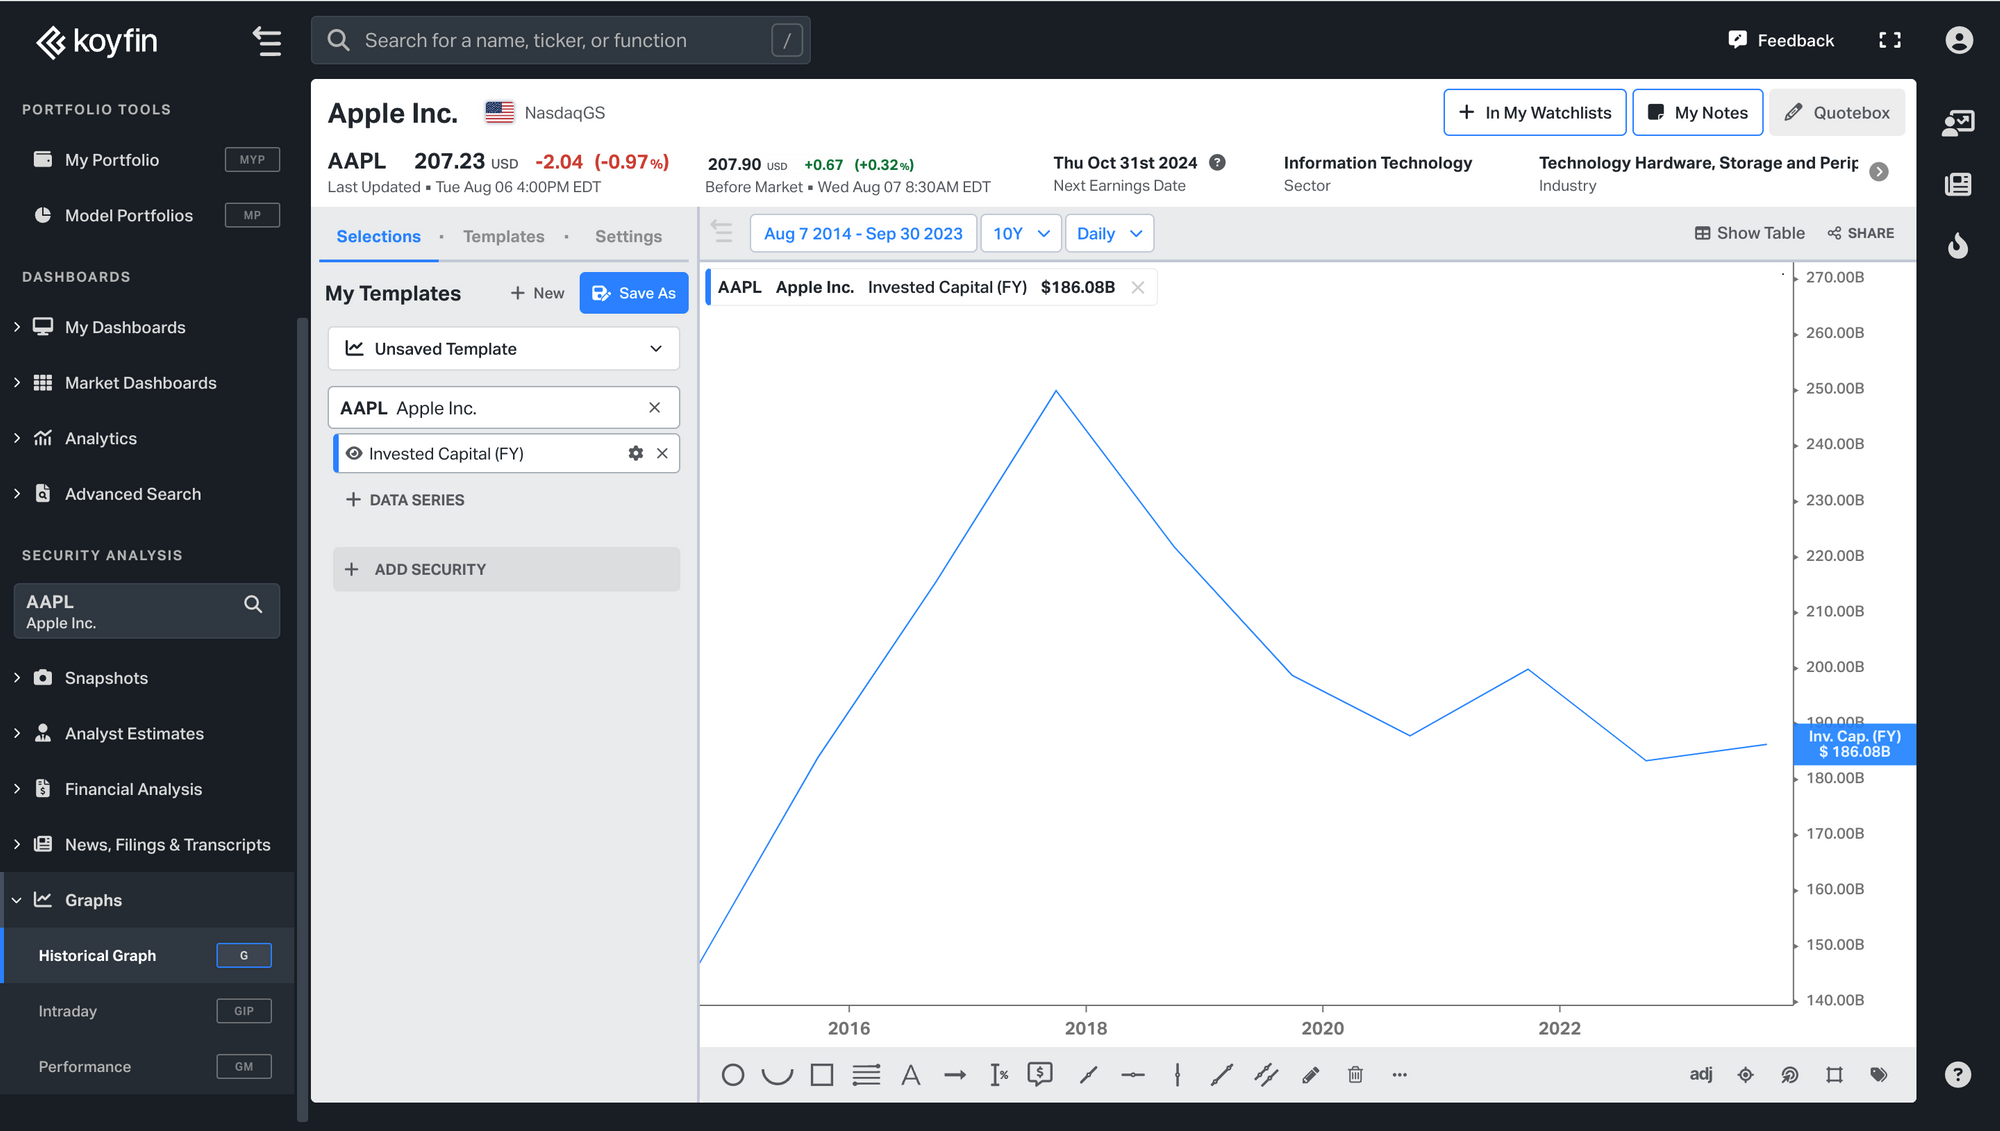
Invested Capital
The formula we use to calculate Invested Capital is:
Invested Capital = (Long-Term Debt + Short-Term Debt + Shareholder Equity + Current Leases + Long-Term Leases)
It doesn't adjust for serial asset write-offs.
The G chart allows you to visualize Invested Capital.
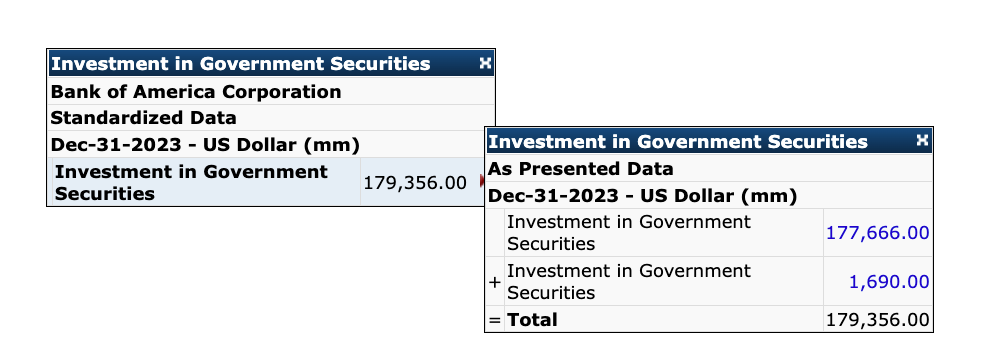
Investment in Government Securities
Investment in Government Securities represents investments in negotiable securities issued by national government institutions and includes treasury bills, notes, and bonds.
This item includes:
• U.S. Government and agency securities
• Foreign government securities
• Federal agency securities
This item excludes:
• State and municipal
• U.S. Government mortgage backed securities
The example below is for Bank of America Corporation as of December 31, 2023.
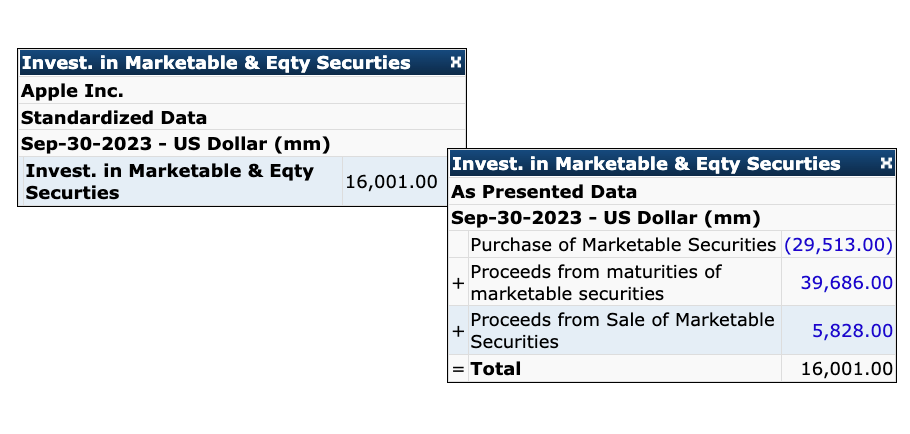
Investment in Marketable and Equity Securities
Investment in Marketable and Equity Securities is a line item that consists of the following components:
• Investment in Joint Ventures, Affiliates & Partnerships
• Decrease (Increase) in Marketable Securities
• Investments in Marketable and Equity Securities
• Maturity of Debt Securities
• Cash Investment in Debt Securities
• Maturity of Preferred Securities
• Cash Investment in Preferred Securities
• Maturity of Equity Securities
• Cash Investment in Equity Securities
• Maturity of Other Investments
• Purchase/Sale-Other Investments
This line item excludes:
• Sale/purchase of restricted investments
• Acquisition/disposal of subsidiaries or change in holding in subsidiaries
The example below shows the calculation for Bank of America Corporation as of September 30, 2023.
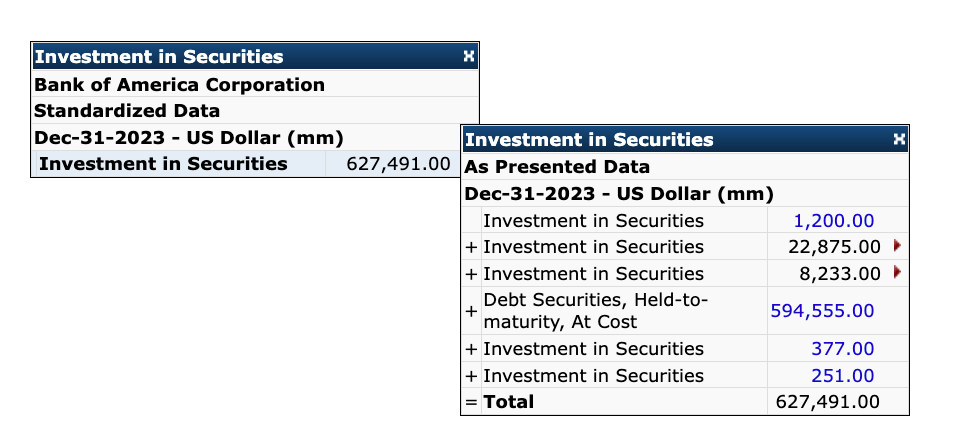
Investment in Securities
Investment in Securities is a line item that represents the residual category of investments made by the bank.
This item includes:
• Securities available for sale, at fair value
• Investments in unconsolidated affiliates
• Held-to-maturity securities
• Corporate bonds
• Equity securities
This data item excludes:
• U.S. Government and agency securities
• FNMA mortgage-backed securities
• Mortgage-backed securities
• State and municipal
The example below is for Bank of America Corporation as of December 31, 2023.
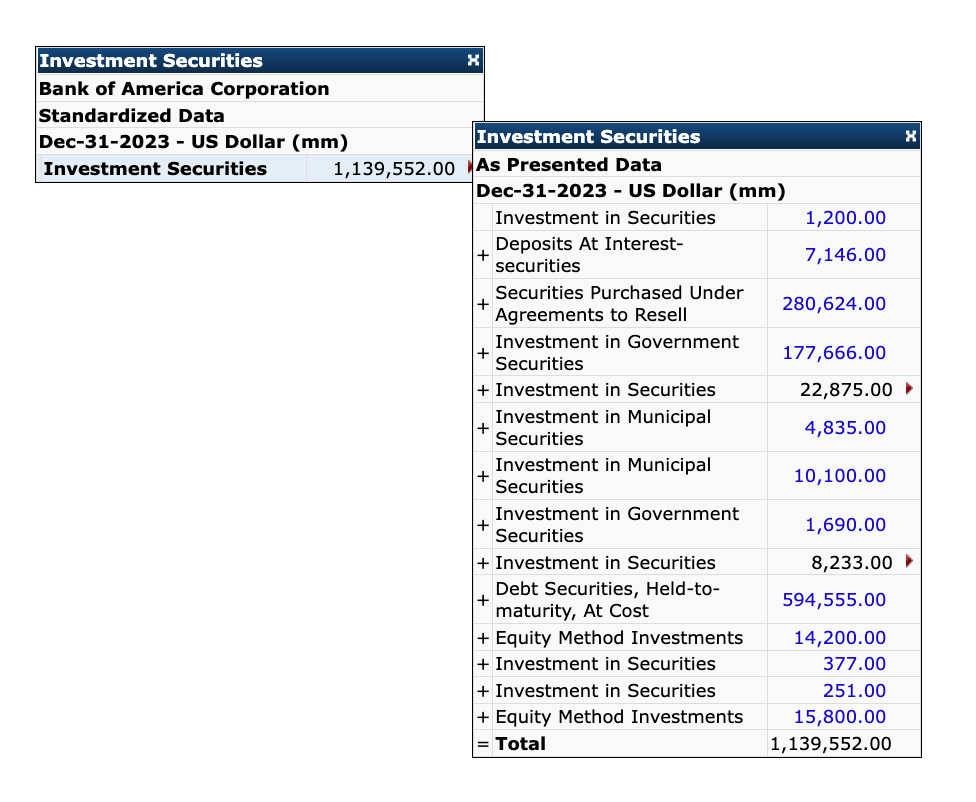
Investment Securities, Total
Investment Securities, Total is a line item for banks with the following components:
• Deposits at Interest in Securities
• Investment in Government Securities
• Investment in Securities
• Investment in Municipal Securities
• Securities Purchased Under Agreements to Resell
• Equity Method Investments
The example below is for Bank of America Corporation as of December 31, 2023.
Kurtosis (All Funds)
Kurtosis measures the tail behaviour of a fund's return distribution relative to a normal distribution. Higher Kurtosis indicates a greater probability of extreme return outcomes in either direction. A normal distribution has a Kurtosis of 3.
This item is calculated using the following formula:
- K = [n(n+1) / ((n−1)(n−2)(n−3))] × Σ((Ri − R̄) / σ)⁴ − [3(n−1)² / ((n−2)(n−3))]
where
- K = Kurtosis
- Ri = Return of the fund in period i
- R̄ = Mean return
- σ = Standard deviation
- n = Number of observations
Data is sourced from Morningstar and is available for 1Y, 3Y, 5Y, 10Y, and 15Y periods.
Leverage Ratio %
Leverage Ratio is a metric specific to banks and related institutions. The formula to calculate the Leverage Ratio % is:
Tier 1 Capital / Adjusted Average Total Assets
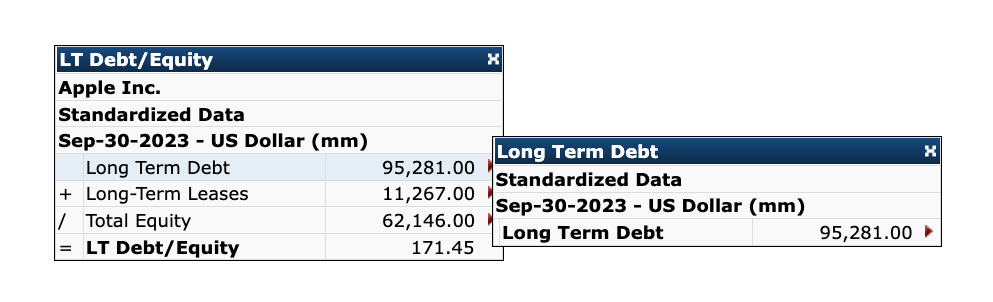
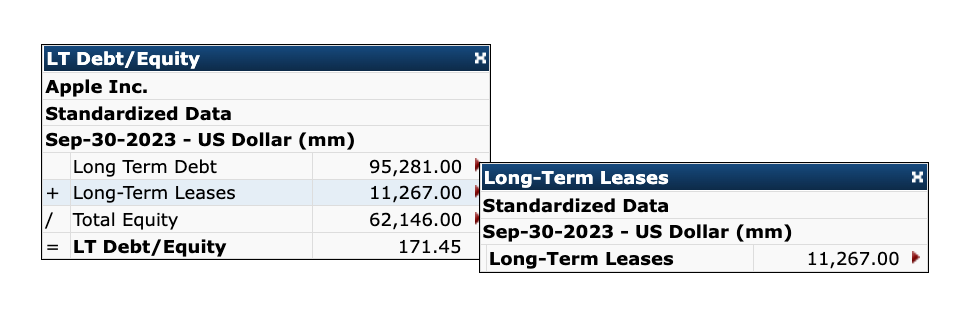
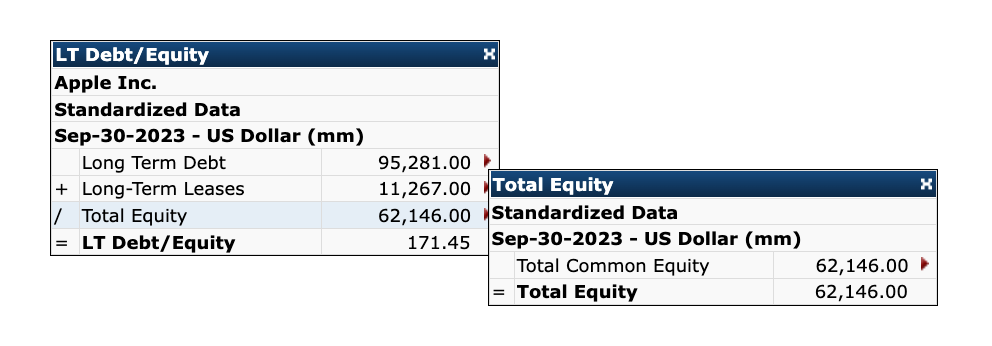
Long-Term Debt / Equity
We use the following formula to calculate the Long-Term Debt / Equity ratio:
Long-Term Debt / Equity = (Finance Division Debt Non-Current + Long-Term Debt + Long-Term Leases) / Total Equity
The example below shows the calculation for Apple Inc. as of September 30, 2023.
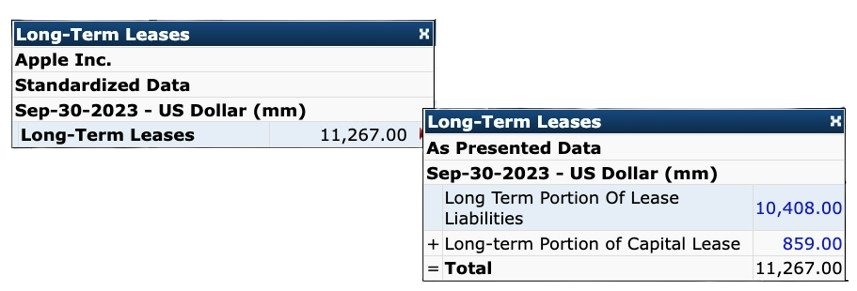
Long-Term Leases
Long-Term Leases is a line item that represents the sum of the following components:
• Finance Leases, Long Term
• Long Term Portion of Operating Lease Liabilities
The example below is for Apple Inc. as of September 30, 2023.
Months with Positive Performance (All Funds)
Months with Positive Performance is a count of the number of months in the current calendar year in which the fund posted a positive return.
Data is sourced from Morningstar and is returned as a single integer value for the current calendar year.
Months with Negative Performance (All Funds)
Months with Negative Performance is a count of the number of months in the current calendar year in which the fund posted a negative return.
Data is sourced from Morningstar and is returned as a single integer value for the current calendar year.
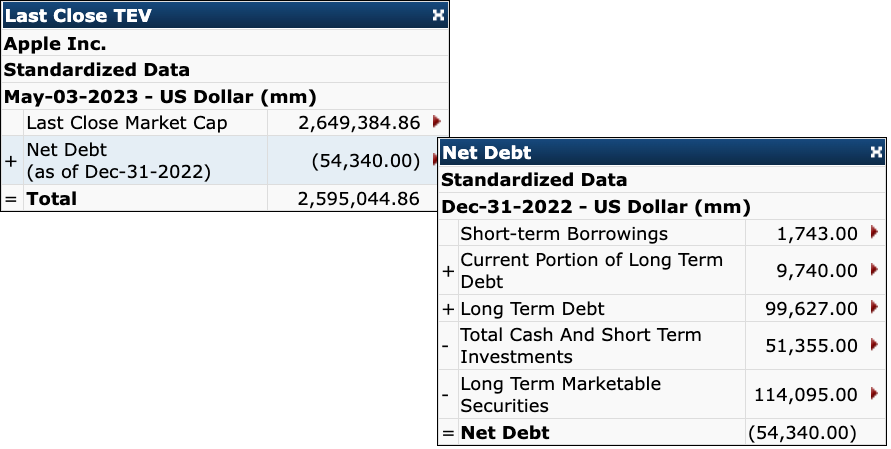
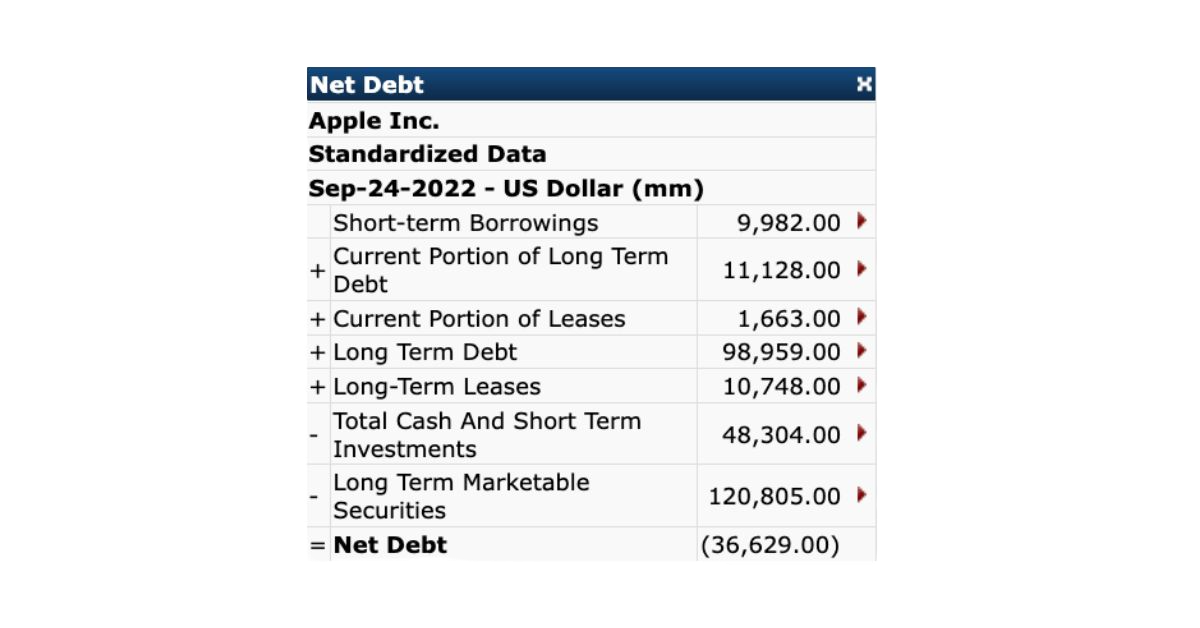
Net Debt
Net Debt is a financial metric that measures a company's debt obligations after taking into account its available cash and short-term investments.
Standard Template
Net Debt = Total Debt - Total Cash & Short-term Investments - Long Term Marketable Securities
The following example shows the calculation for Apple Inc. as of September 24, 2022.
Insurance Template
Please note that companies classified as Insurance companies will use an insurance template to calculate net debt. Which is as follows:
Net Debt = Total Debt - Cash & Equivalents
Key Difference:
The standard template deducts both cash and short-term investments (plus long-term marketable securities).
The Insurance template deducts only cash and equivalents because short-term investments for insurers are treated as operating assets, not financial assets.
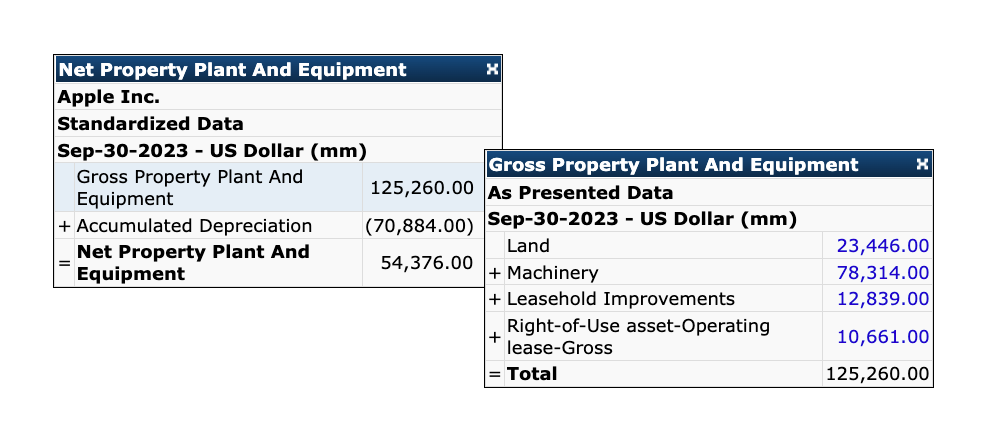
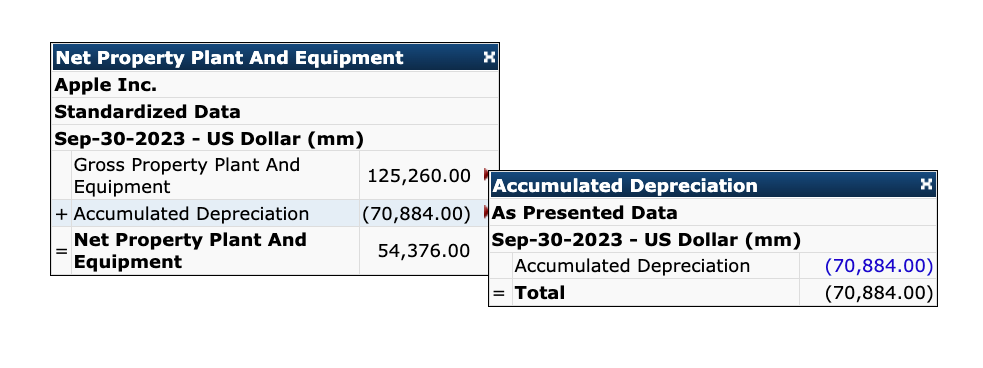
Net Property, Plant and Equipment
Net Property, Plant and Equipment is a line item that includes the following components:
• Gross Property Plant And Equipment
• Accumulated Depreciation
• Right-of-Use Assets - Gross
• Right-of-Use Assets - Operating Lease - Gross
• Right-of-Use Assets - Capital Lease - Gross
• Right-of-Use Assets - Accumulated Depreciation
• Right-of-Use Assets - Capital Lease - Accumulated Depreciation
• Right-of-Use Assets - Operating Lease - Accumulated Depreciation
Note: In the cases where a breakdown of Net Property into Gross and Accumulated Depreciation is not reported the following Net Values are collected directly:
• Net PP&E
• Right-of-Use Assets – Net
• Right-of-Use Assets - Capital Lease – Net
• Right-of-Use Assets - Operating Lease – Net
The following example illustrates the calculation for Apple Inc. as of September 30, 2023.
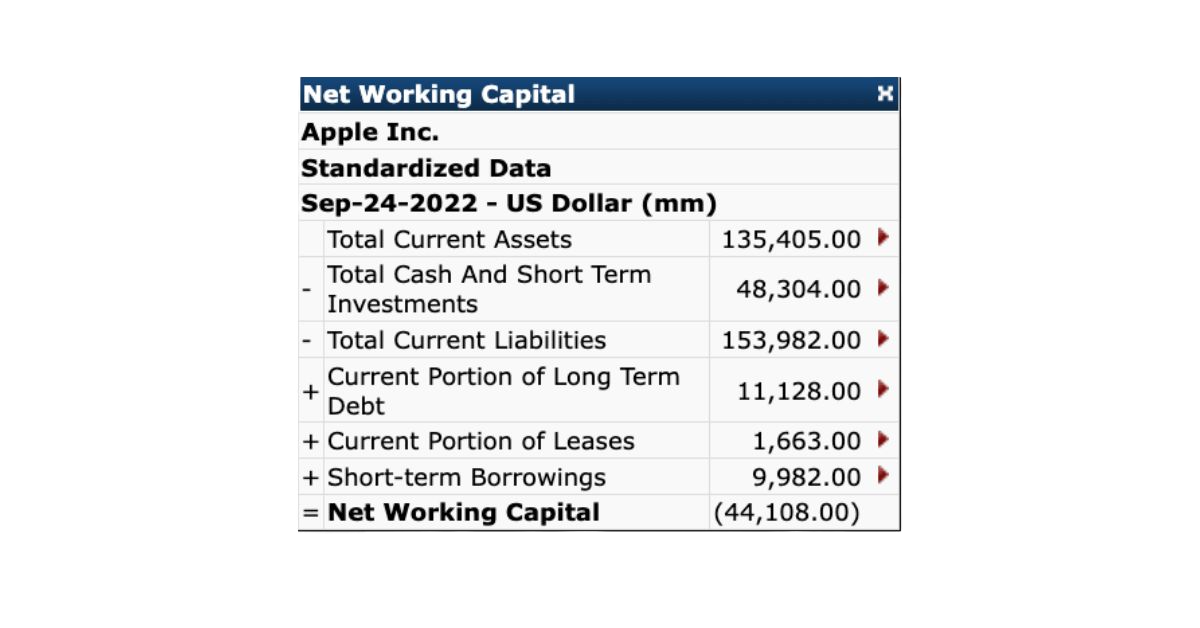
Net Working Capital
While Working Capital is a simple measure of current assets less current liabilities, Net Working Capital excludes cash and short term debt.
Net Working Capital = Current Assets - Cash & Short Term Investments - Current Liabilities + Current Portion of LT Debt + Current Portion of Leases + Short Term Borrowings
The example below is for Apple Inc. as of September 24, 2022.
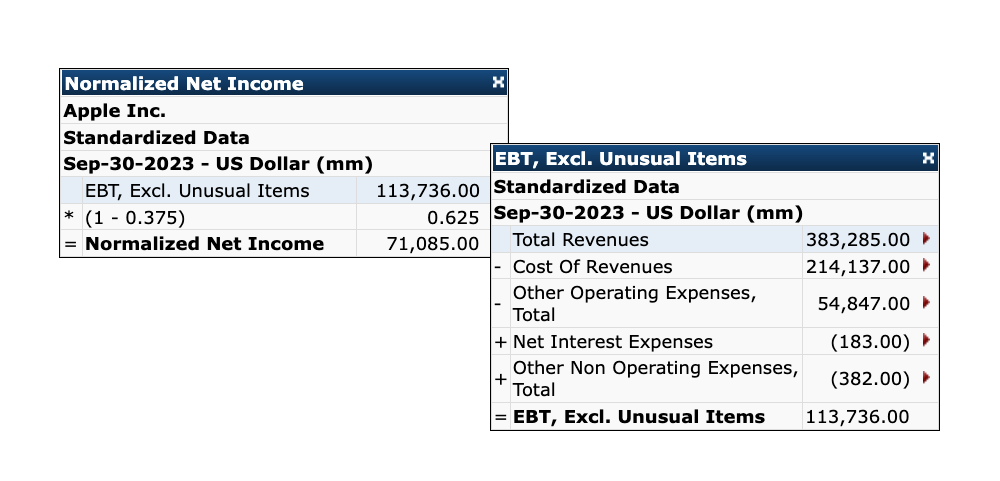
Normalized Net Income
Normalized Net Income is calculated using the following formula:
Normalized Net Income = EBT (Excluding Unusual Items) * (1 - Statutory Tax Rate) + Minority Interest in Earnings
Note: Capital IQ (the vendor) assumes a statutory tax rate of 37.5% for all companies.
The example below illustrates the calculation for Apple Inc. as of September 30, 2023.
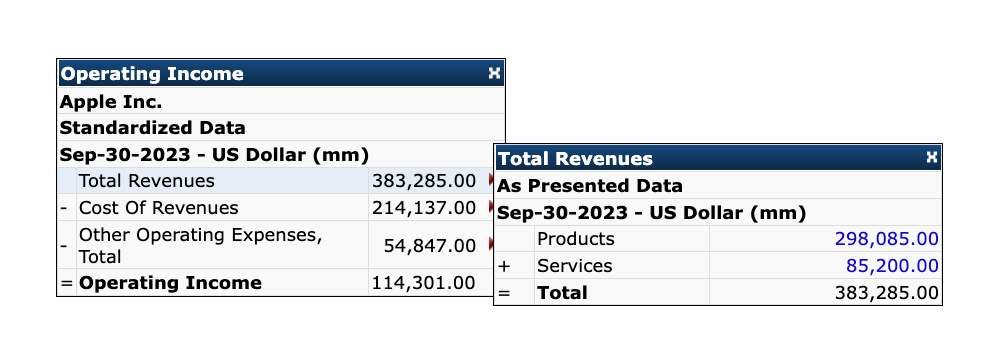
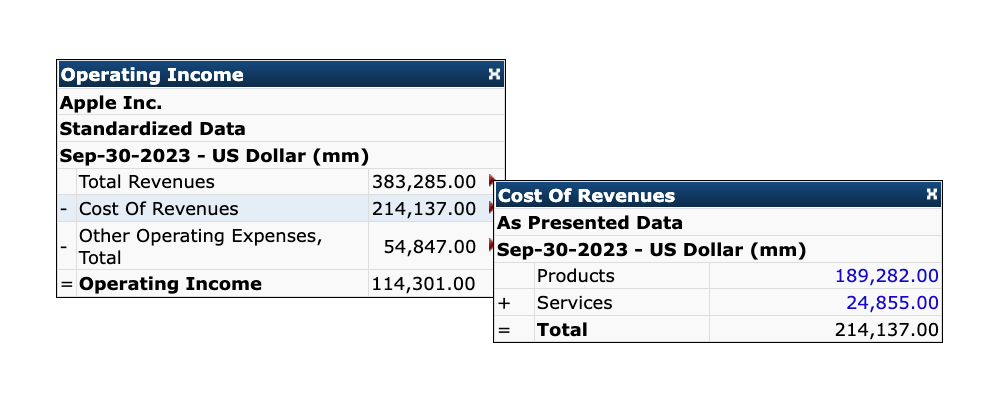
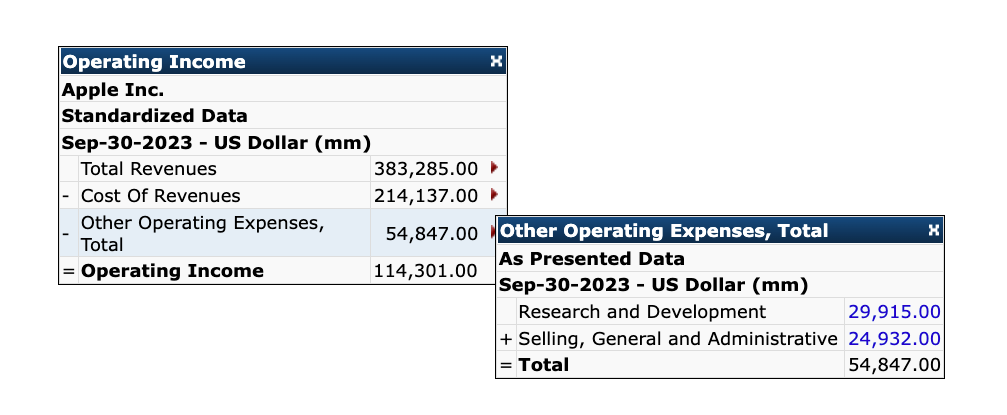
Operating Income
Operating income is a line item that consists of the following components:
• Total Revenues
• Total Operating Expenses
The example below shows the calculation for Apple Inc. as of September 30, 2023.
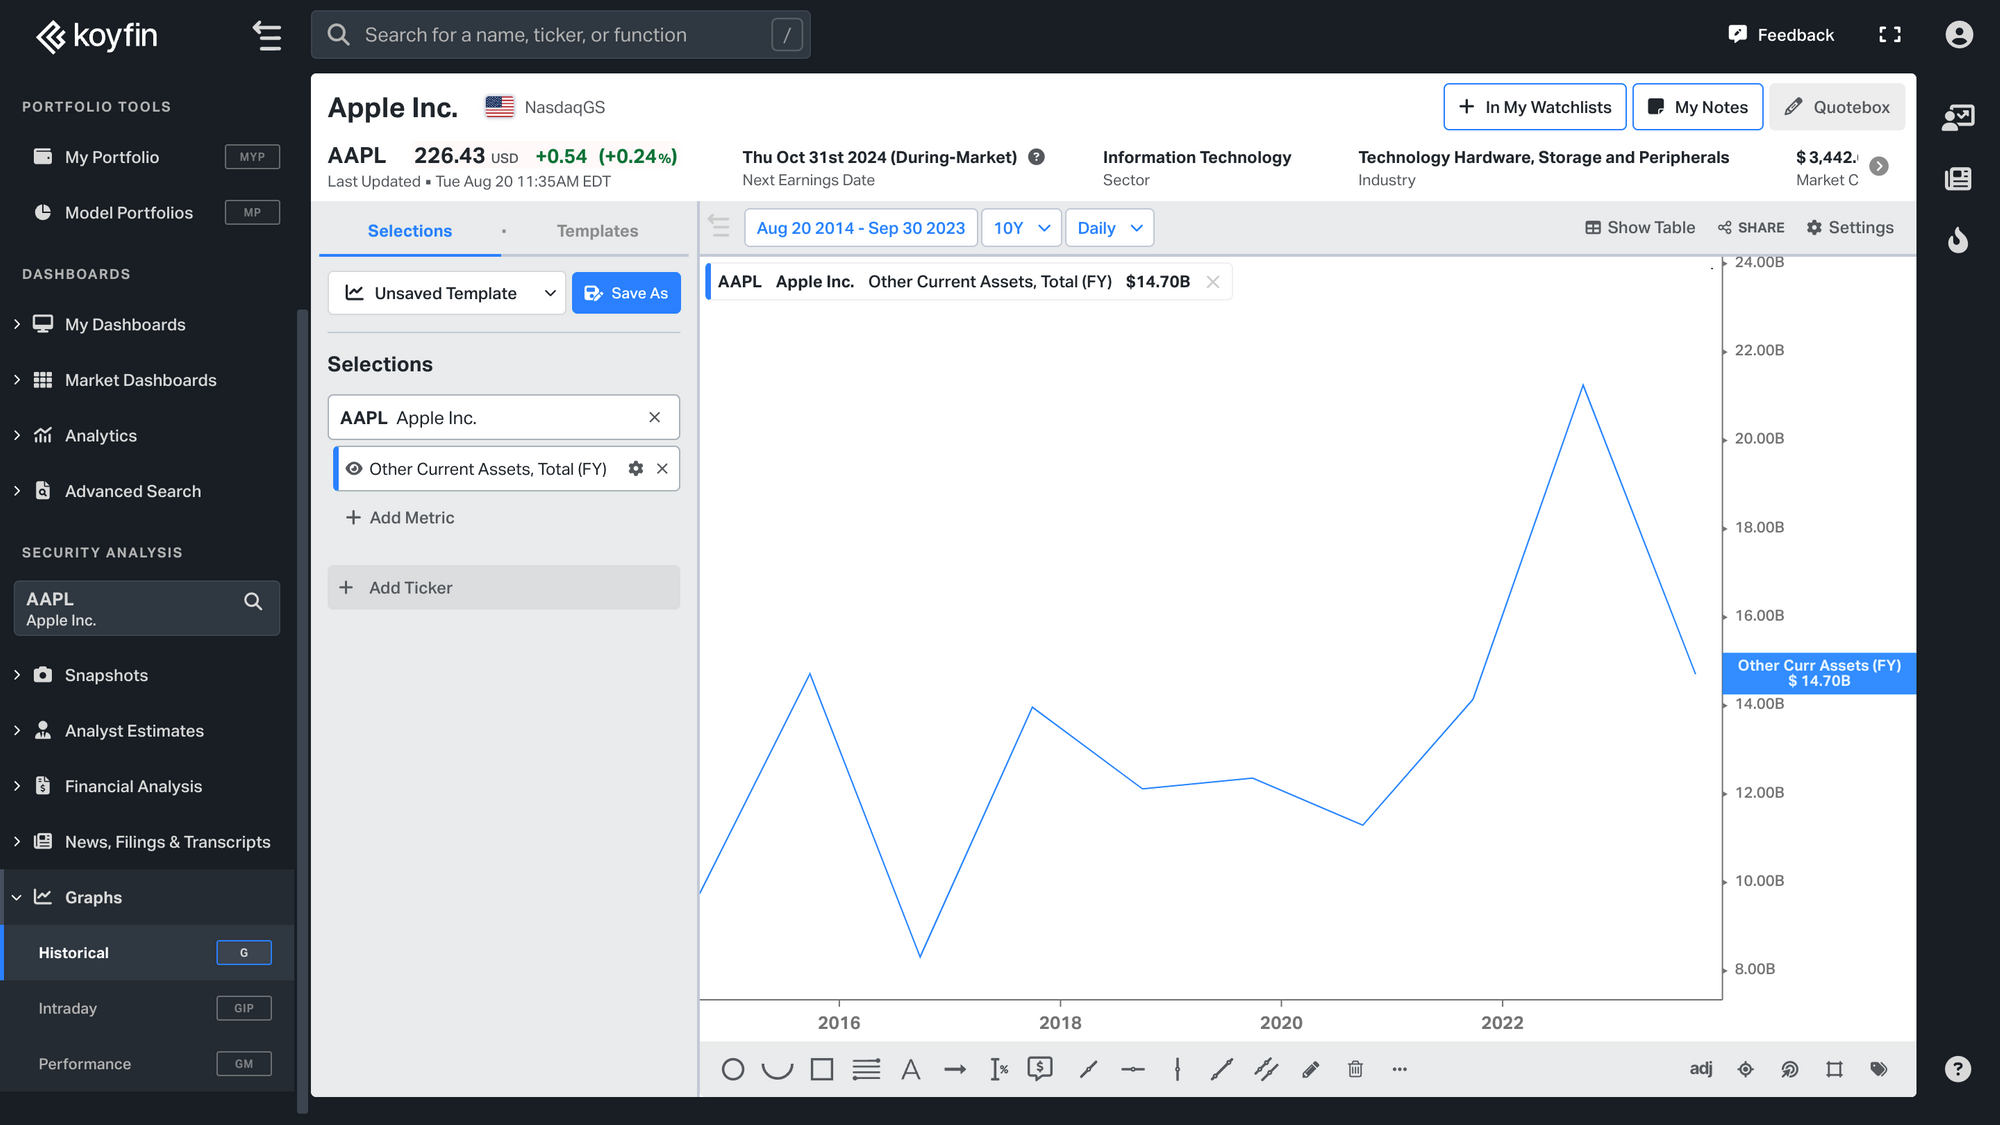
Other Current Assets, Total
Other Current Assets, Total is a line item that includes the following components:
• Accrued Interest Receivable
• Accrued Investment Income
• Customer Acceptance
• Assets of Discontinued Operations Current
• Derivative Assets Current
• Deferred Charges Current
• Film Contract and Broadcasting Rights Current
• Reinsurance Recoverable - Current
• Other Current Assets - (Collected)
• Restricted Investments - Current
If you wish to graph Other Current Assets, Total for a particular stock, you can use the G chart on Koyfin.
Outperformance Rate (All Funds)
Outperformance Rate measures the percentage of months in a given period in which a fund met or exceeded its benchmark return. A value of 50 means the fund matched or beat the benchmark half of the time; a value of 100 means it outperformed in every month.
This item is calculated using the following formula:
- OR = (Mn / Mt) × 100
where
- OR = Outperformance Rate
- Mn = Number of months the fund met or exceeded the benchmark return
- Mt = Total number of months in the period
Data is sourced from Morningstar and is available for 1Y, 3Y, 5Y, 10Y, and 15Y periods.
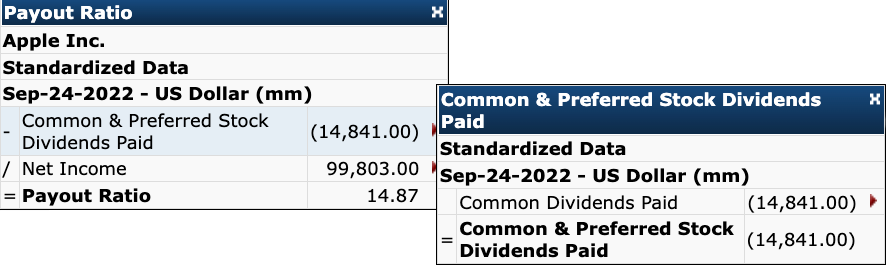
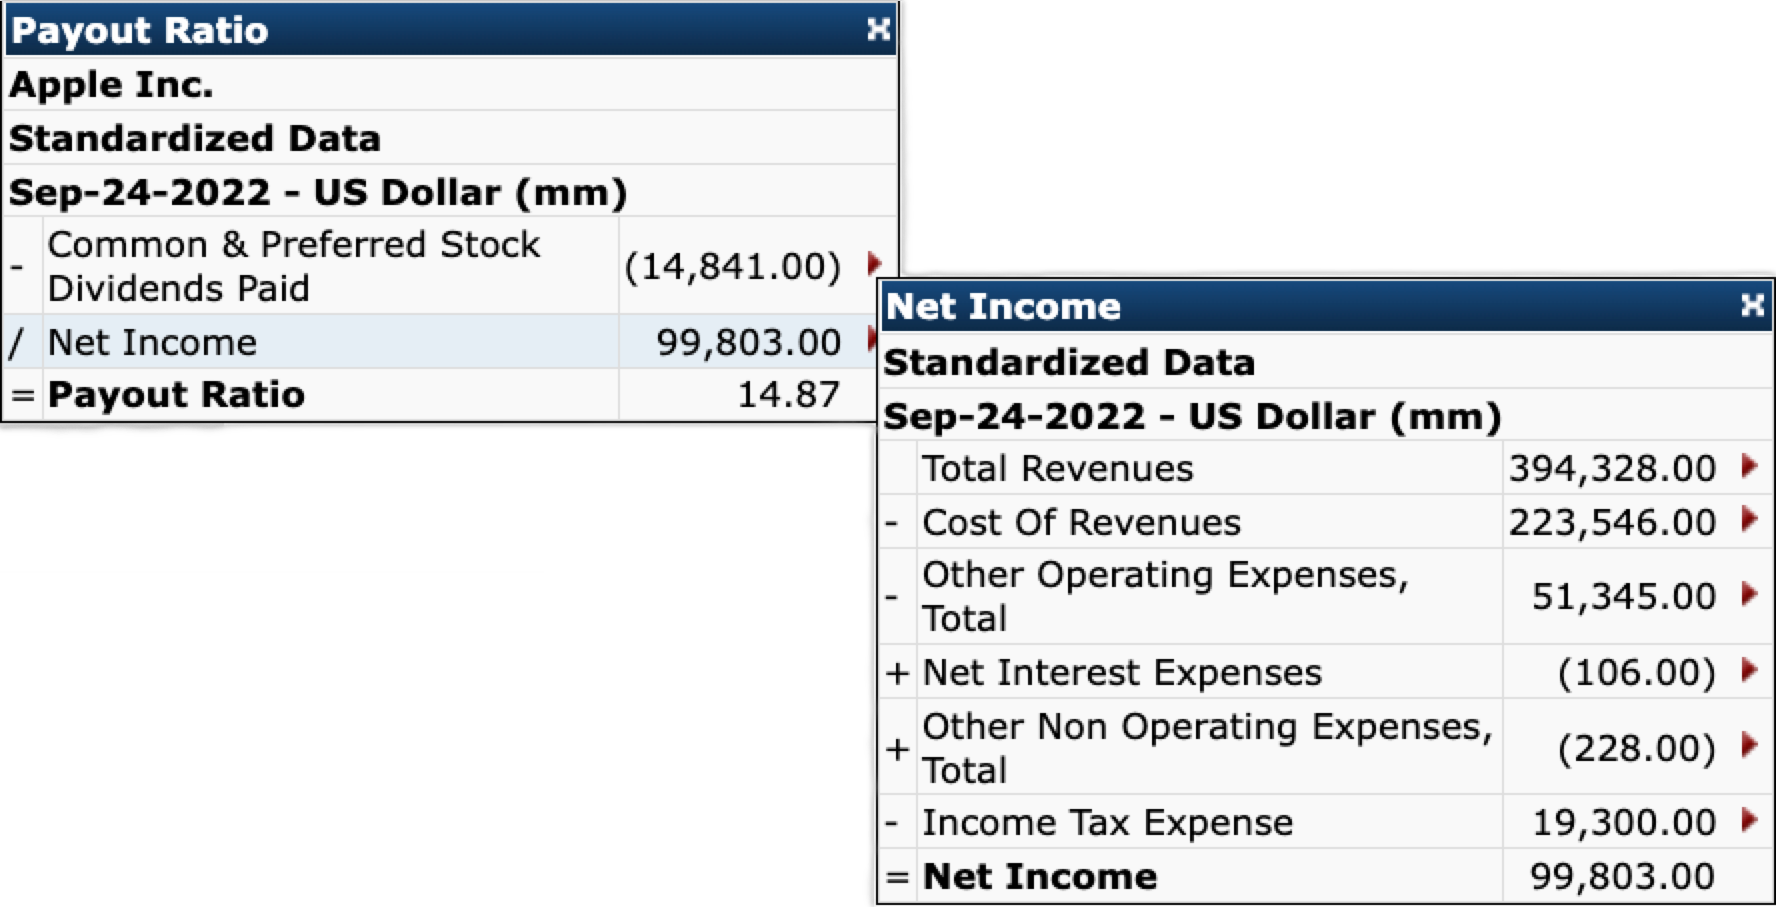
Payout Ratio
The Payout Ratio is calculated using the following formula:
Payout Ratio = Common & Preferred Stock Dividends Paid / Net Income
The example below is for Apple Inc. as of September 24, 2022.
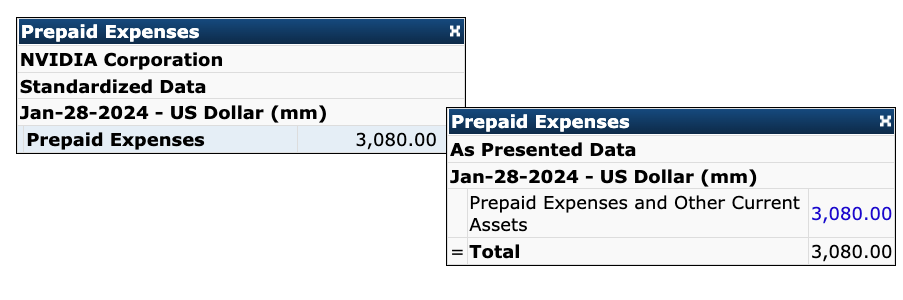
Prepaid Expenses
Prepaid Expenses represents amounts paid to other parties for services to be rendered in the future. They expire and become expenses with the passage of time, usage or events, e.g., prepaid rent, prepaid insurance, etc. Prepaid Expenses are assets created by the prepayment of cash or incurrence of a liability.
This item includes:
• Prepaid insurance
• Prepaid expenses
• Prepaid taxes
• Prepayments
This item excludes:
• Prepayments to suppliers
• Compensation related, pension related, and employee benefit related line items such as prepaid pension and prepaid compensation.
The example below is for Apple Inc. as of January 28, 2024.
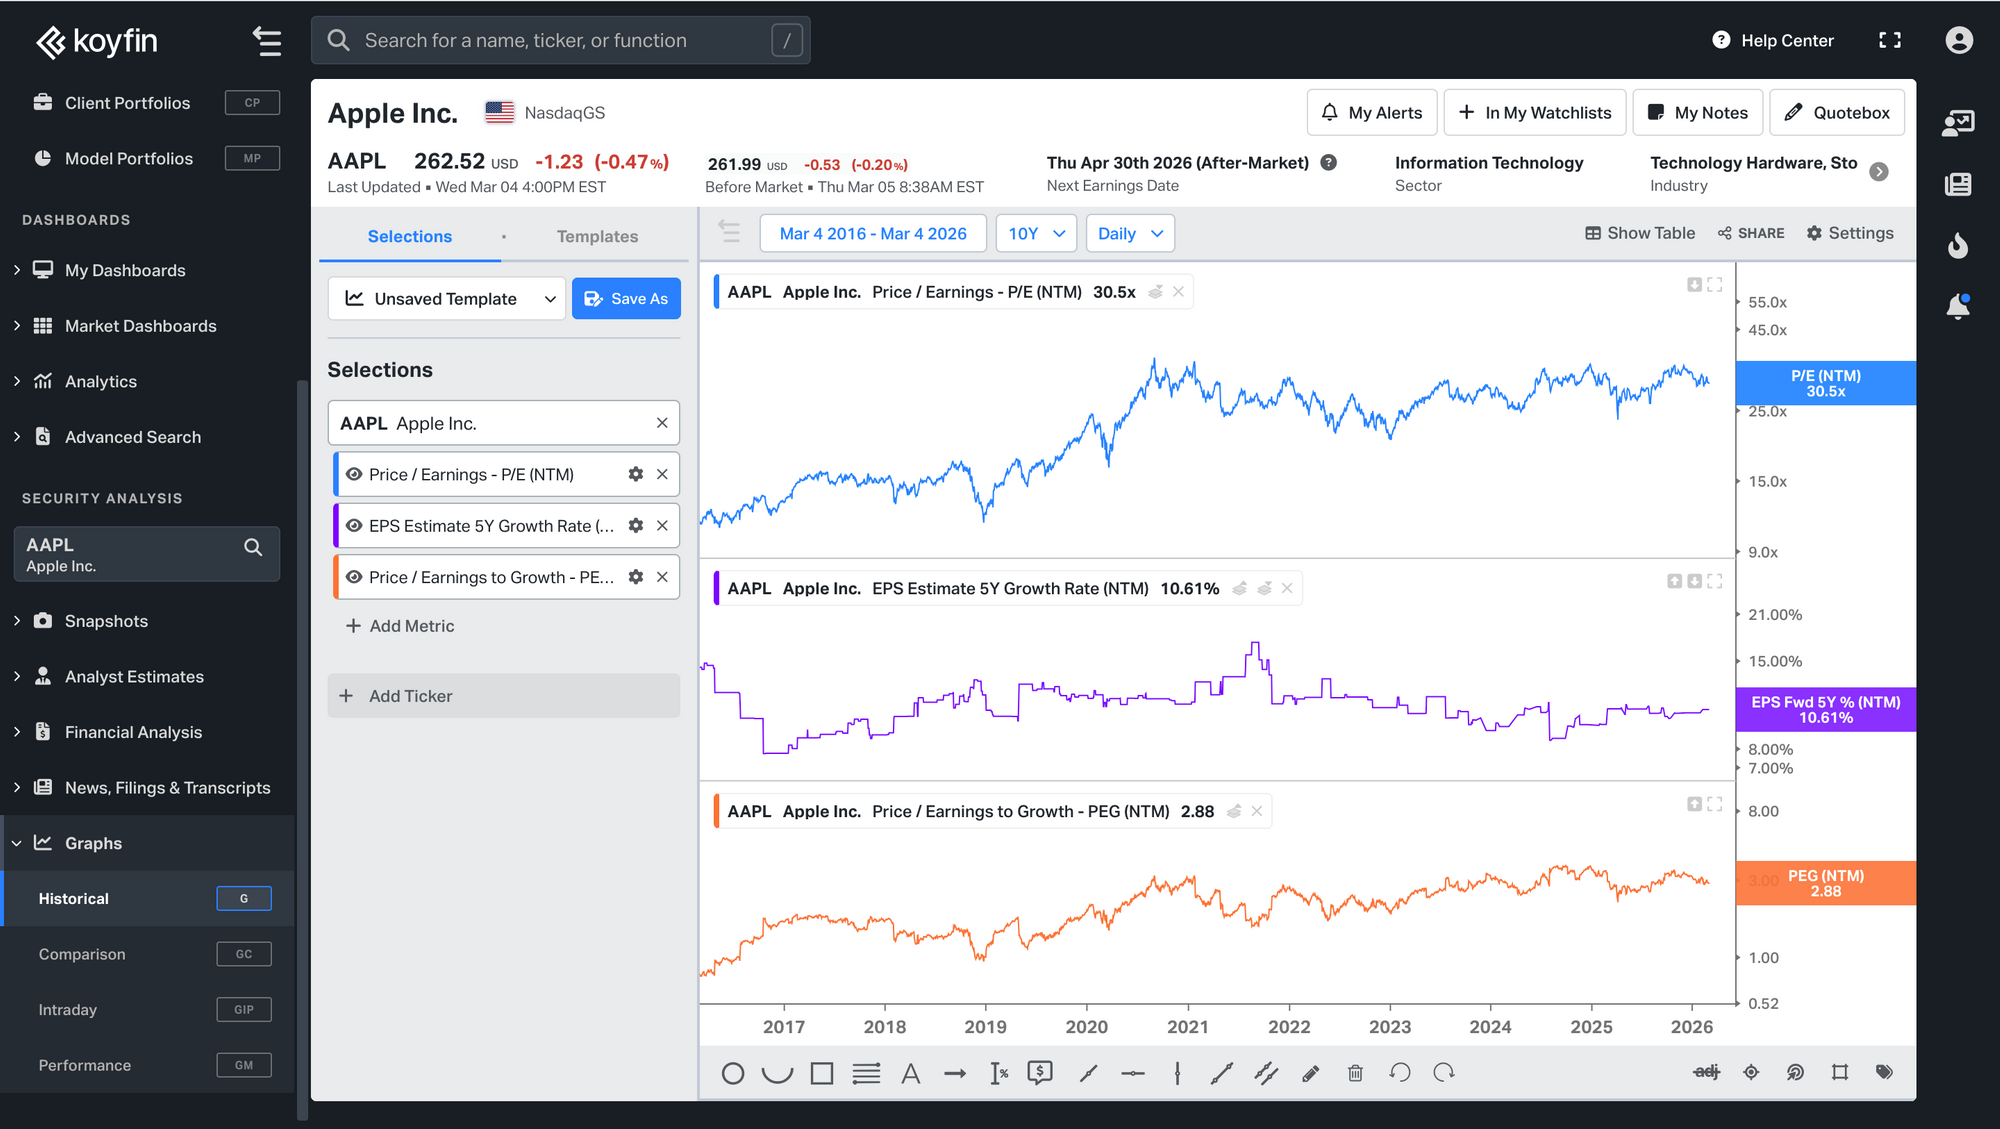
Price / Earnings to Growth (PEG) (NTM)
We use the following formula to calculate the Price / Earnings to Growth (PEG) ratio:
Price / Earnings to Growth (PEG) = P/E (NTM) / EPS Estimate 5Y Growth Rate (NTM)
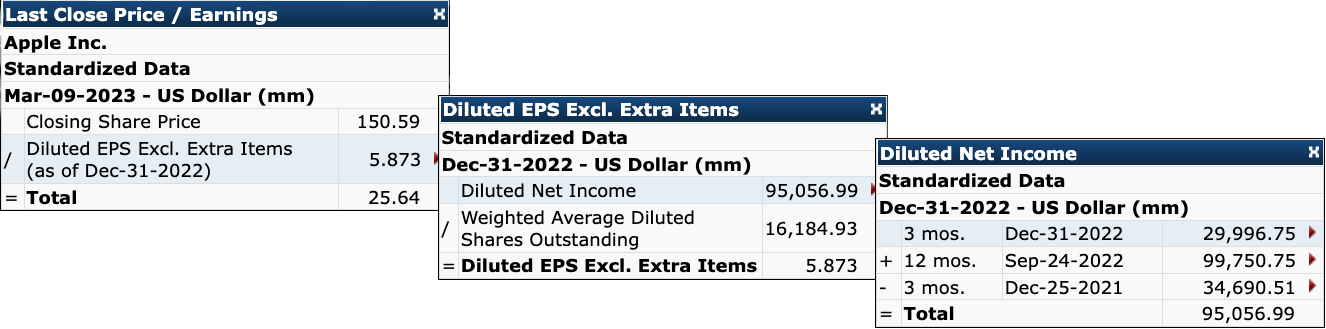
Price / Earnings (LTM)
We use the following formula to calculate the Price / Earnings (LTM) ratio:
Price / Earnings (LTM) = Stock Price / Diluted EPS before extra
The EPS used in this calculation is a GAAP value reported by the company.
The example below is for Apple Inc. as of March 9, 2023.
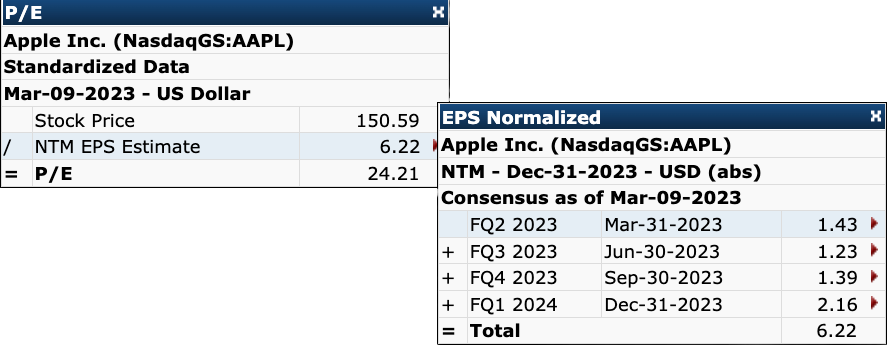
Price / Earnings (NTM)
To calculate the Price / Earnings (NTM) ratio, we use the following formula:
Price / Earnings (NTM) = Stock Price / NTM EPS Mean Estimate
The EPS used in this calculation is Pro Forma and excludes certain accounting expenses like options.
The following example shows the calculation for Apple Inc. as of March 9, 2023.
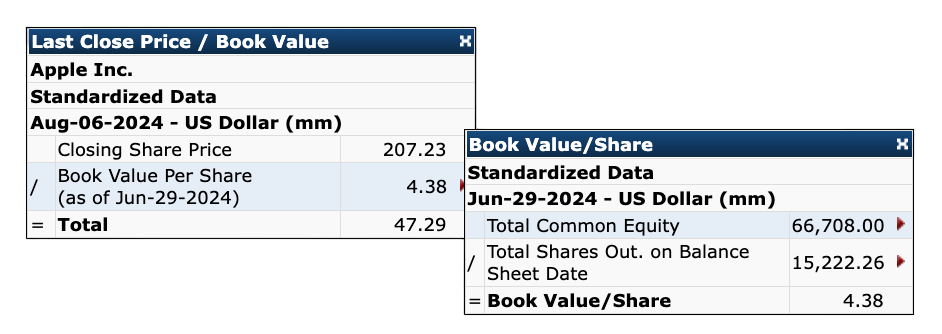
Price / Book
We use the following formula to calculate the Price / Book ratio:
Price / Book Value = Closing Share Price / Book Value Per Share
The example below shows the calculation for Apple Inc. as of August 6, 2024.
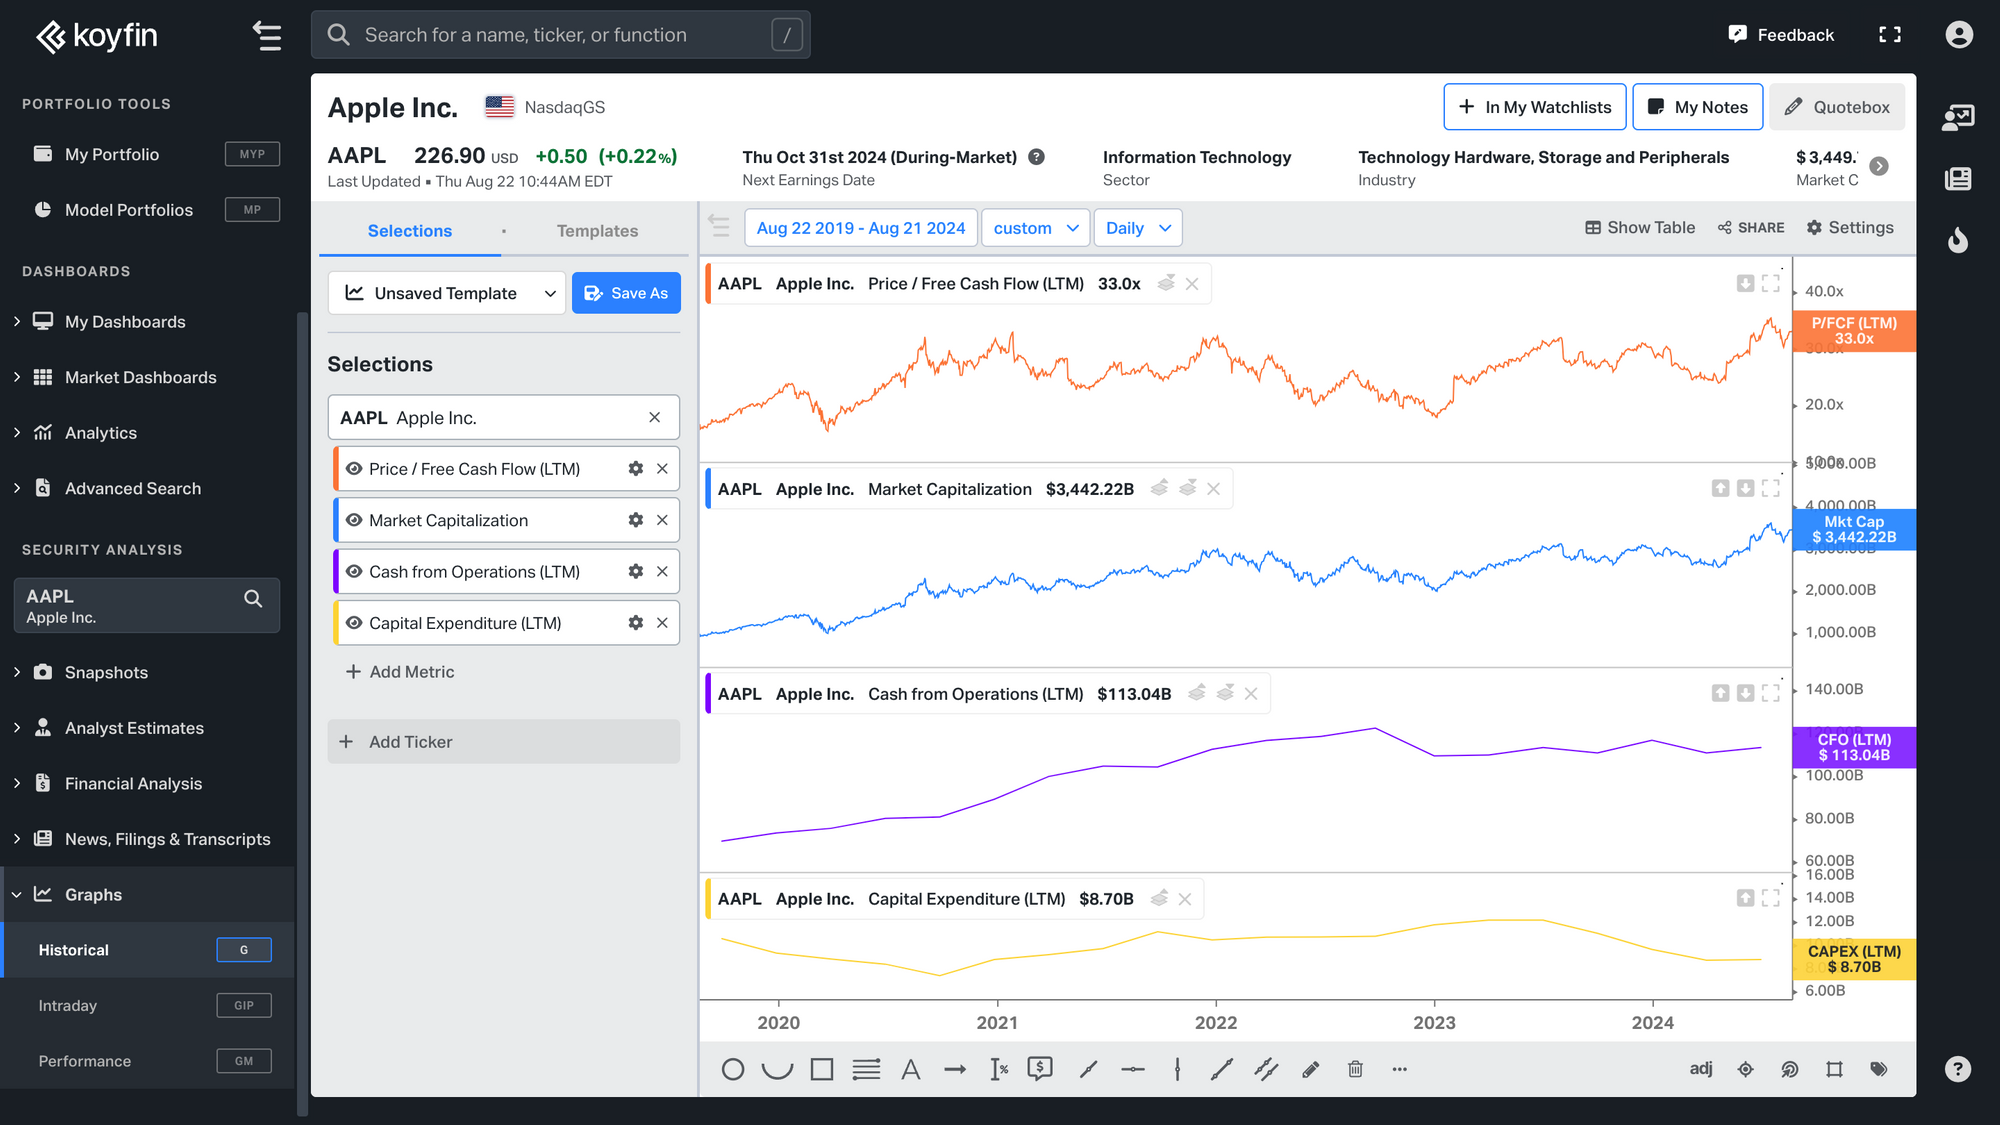
Price / Free Cash Flow
To calculate the Price/Free Cash Flow ratio, we use the following formula:
Price/Free Cash Flow = Market Cap / ((Cash from Operations) - (CAPEX))
You can view a graph of Apple Inc.'s Price/Free Cash Flow on Koyfin.
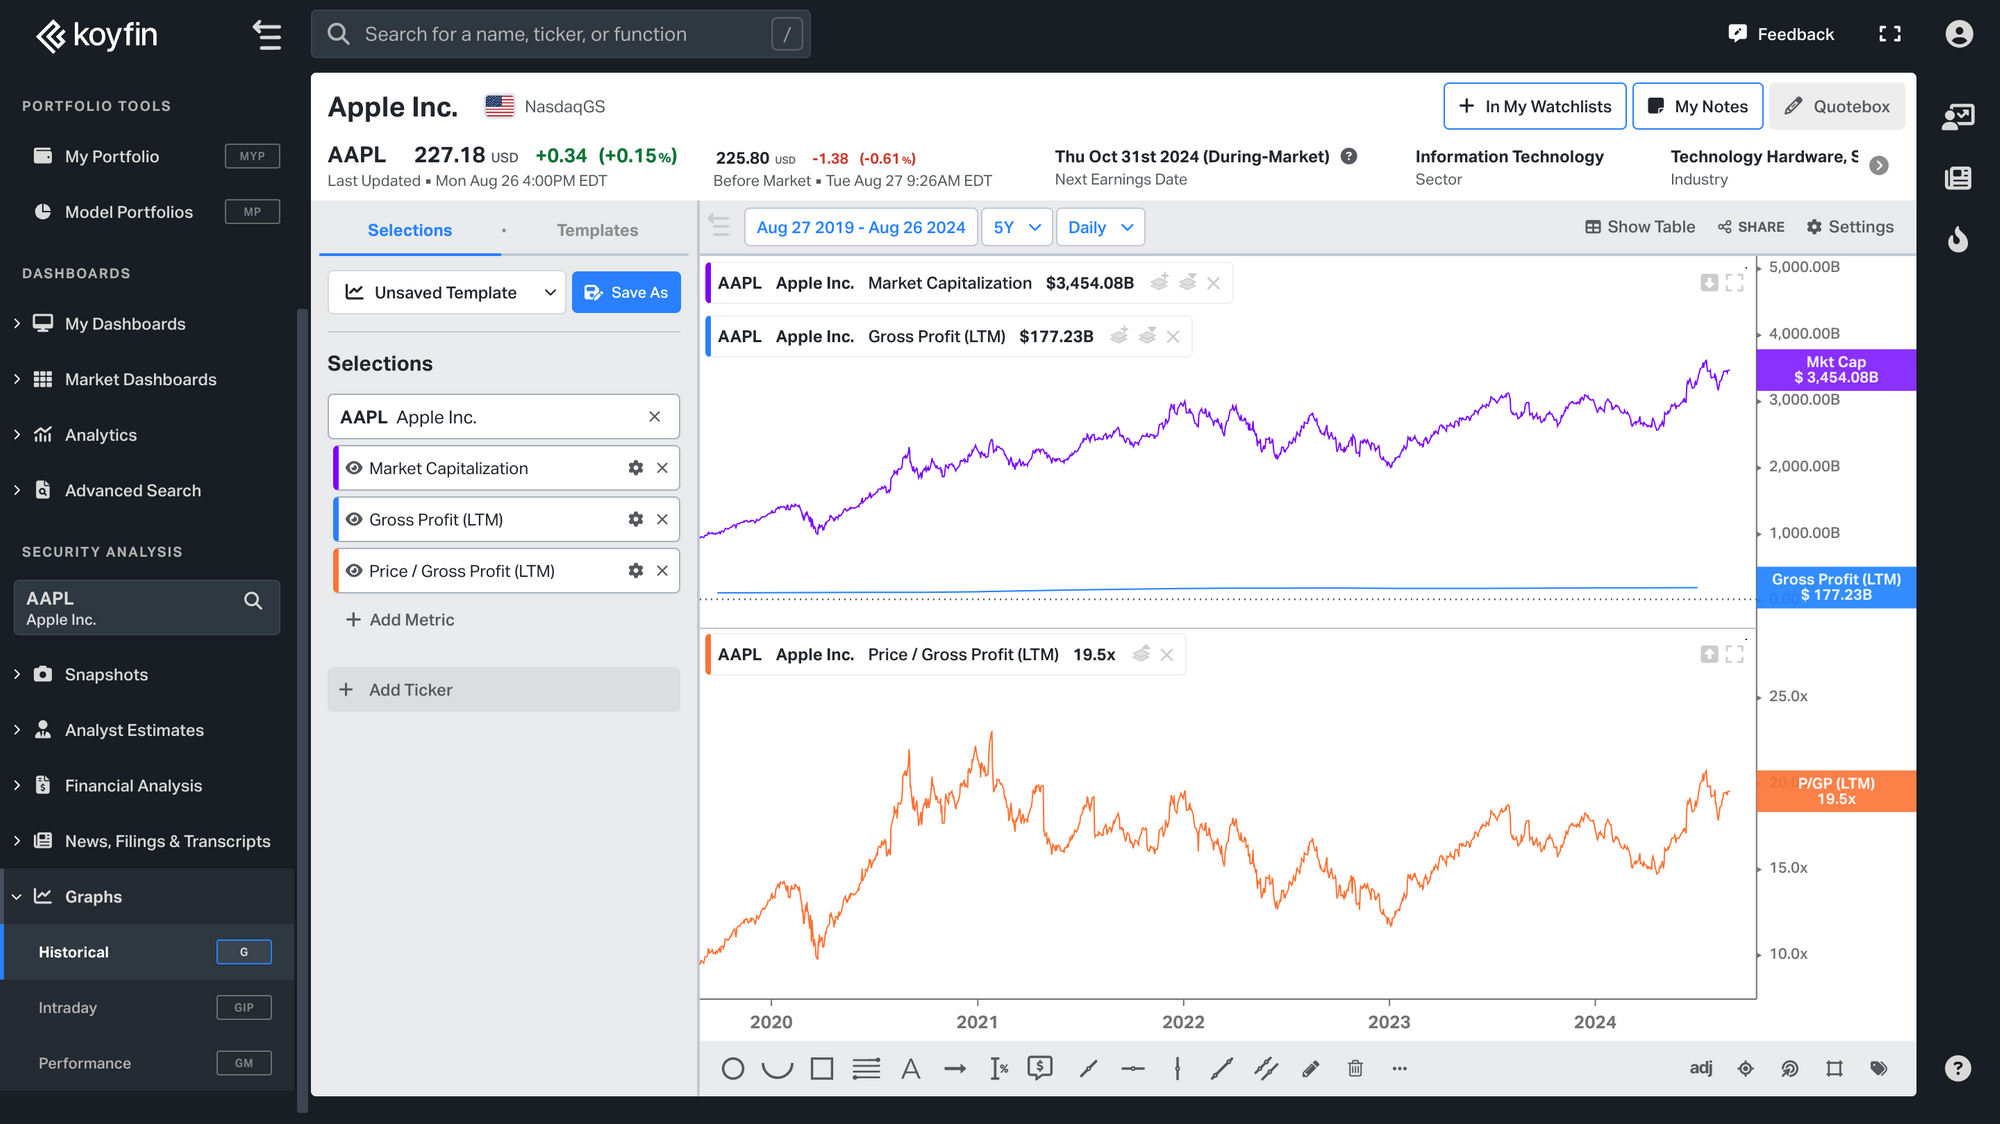
Price / Gross Profit
We use this formula to calculate the Price / Gross Profit ratio:
Price / Gross Profit = Market Cap / Gross Profit
Below is an example of a graph showing the Price / Gross Profit ratio for Apple Inc.
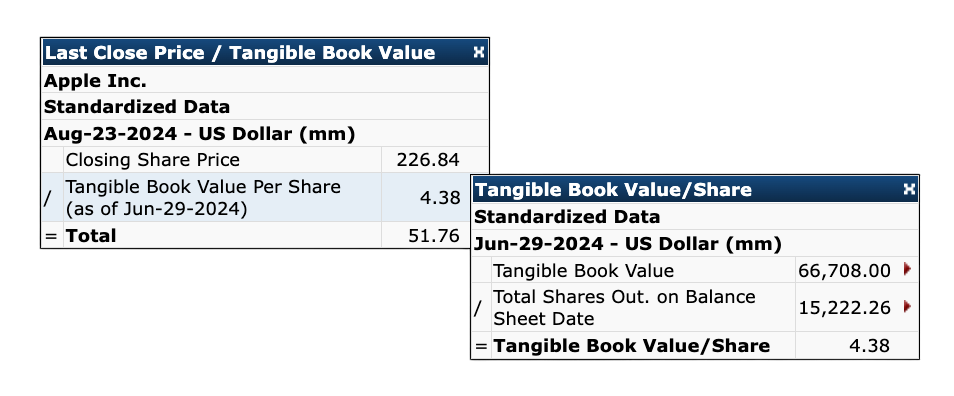
Price / Tangible Book Value
Price / Tangible Book Value is a ratio calculated using the following formula:
Price / Tangible Book Value = Closing Share Price / Tangible Book Value Per Share
Below is an example for Apple Inc. as of August 23, 2024.
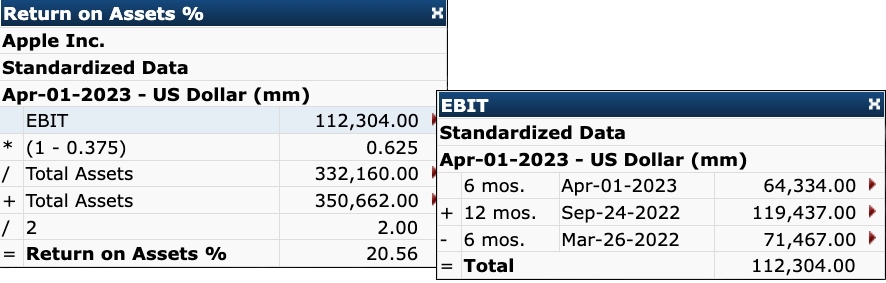
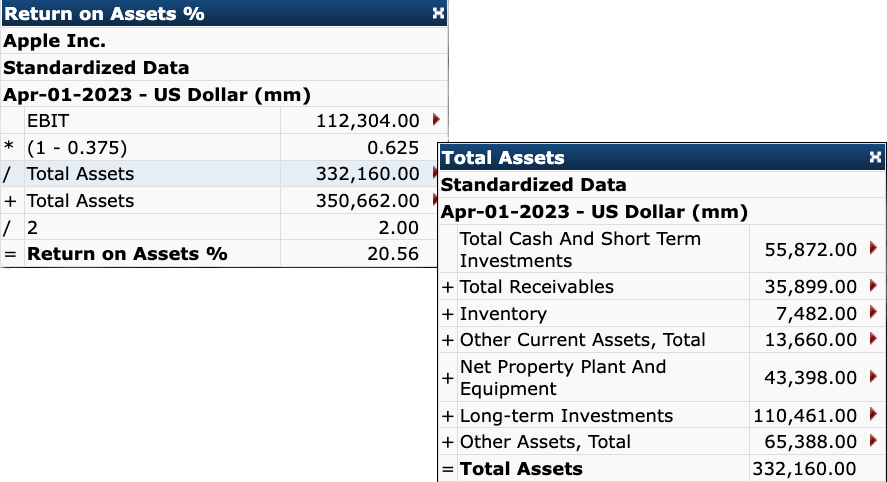
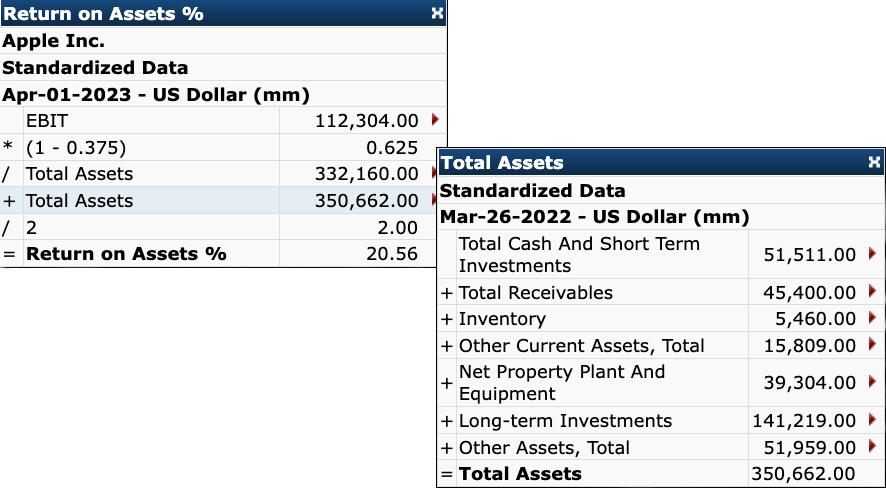
Return on Assets (ROA) %
We calculate Return on Assets % by using the following formula:
Return on Assets % = (EBIT * 0.625) / ((Total Assets (t) + Total Assets (t-1)) / 2)
The example below is for Apple Inc. as of April 1, 2023.
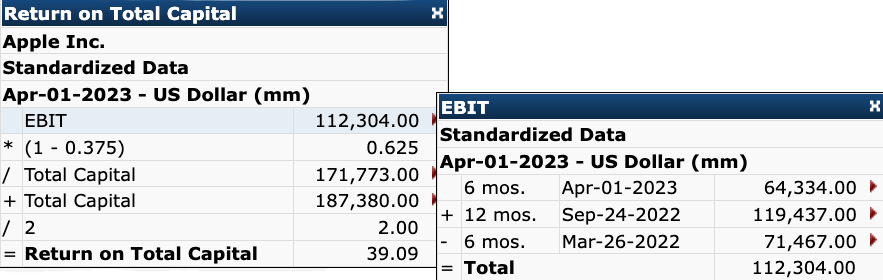
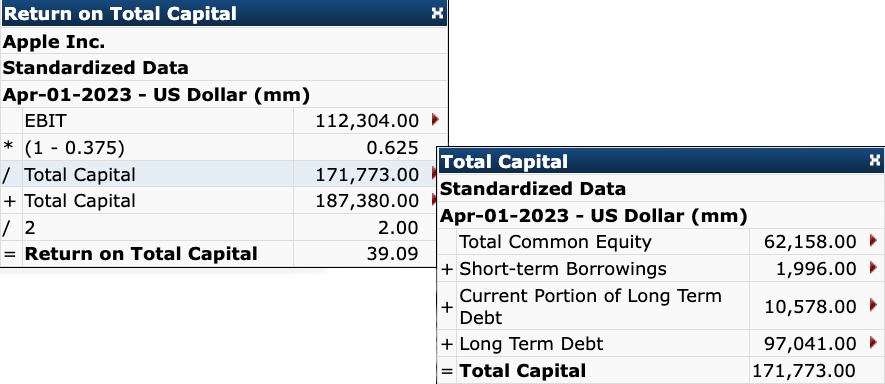
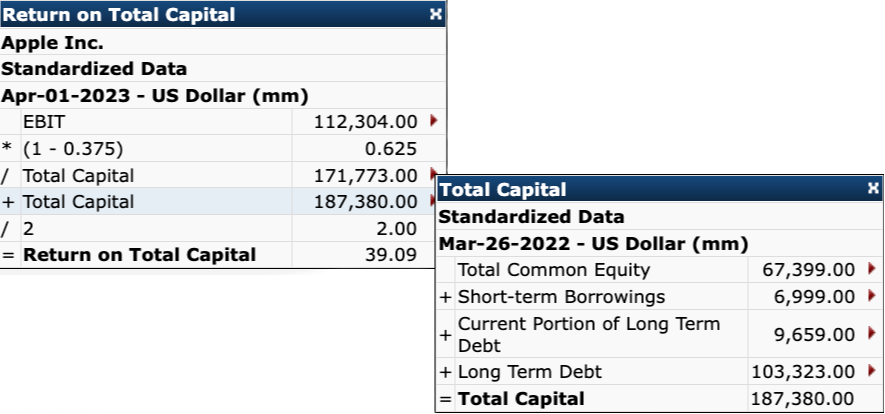
Return on Capital (ROC) %
We use the following formula to calculate Return on Capital %:
Return on Capital % = EBIT * (1-0.375) / ((Total Capital (t) + Total Capital)(1-t))/2)
Note: Capital IQ (the vendor) assumes a statutory tax rate of 37.5% for all companies.
The following example shows the calculation for Apple Inc. as of April 1, 2023.
Return on Capital Employed (ROCE)
Return on Capital Employed is a profitability ratio that measures how efficiently a company generates profit from its capital. It answers the question: how much operating profit does the company produce for every pound/dollar of capital it has deployed?
It is calculated using the following formula:
- EBIT / (Total Assets - Current Liabilities) * 100
A higher ROCE indicates more efficient use of capital.
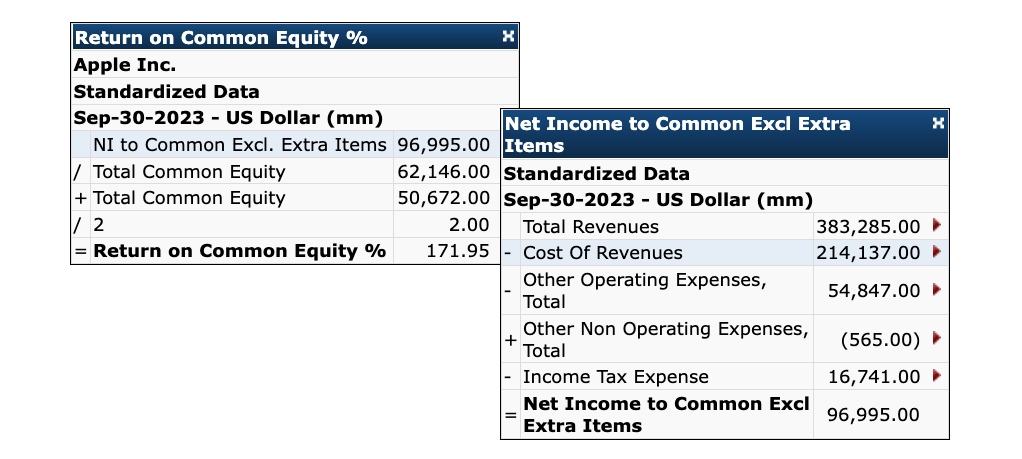
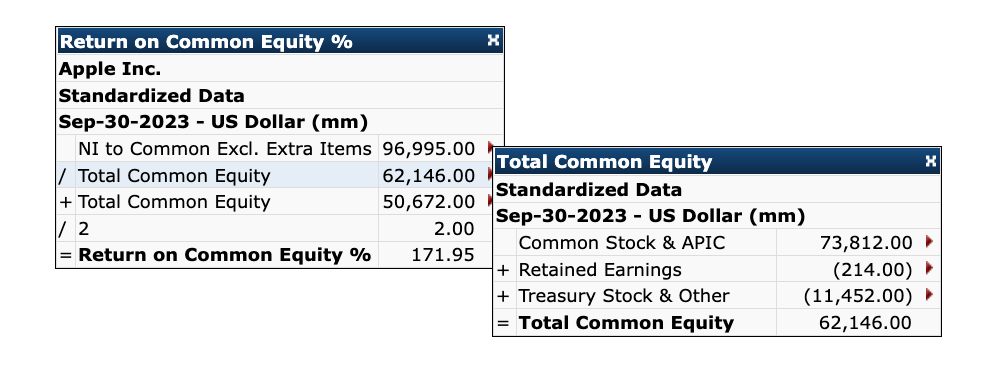
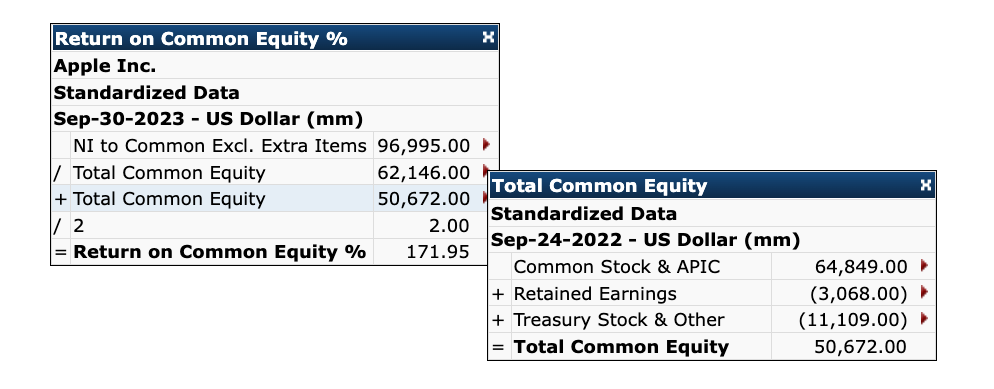
Return on Common Equity %
A profitability ratio that measures the return generated specifically for common (ordinary) shareholders — i.e. how effectively management is using equity capital to generate net income.
We use the following formula to calculate Return on Common Equity %:
Return on Common Equity % = Net Income to Common Excluding Extra Items / ((Total Common Equity (t) + Total Common Equity (t-1)) / 2)
The example below shows the calculation for Apple Inc. as of September 30, 2023.
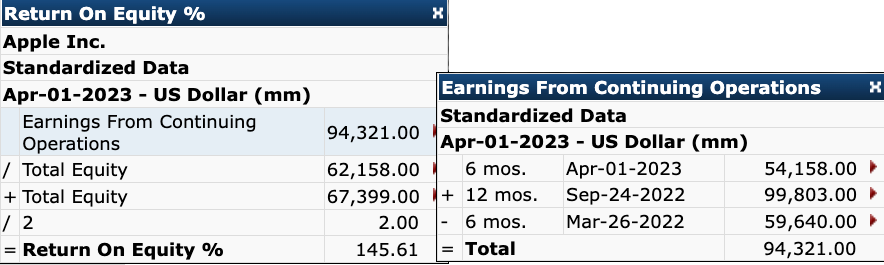
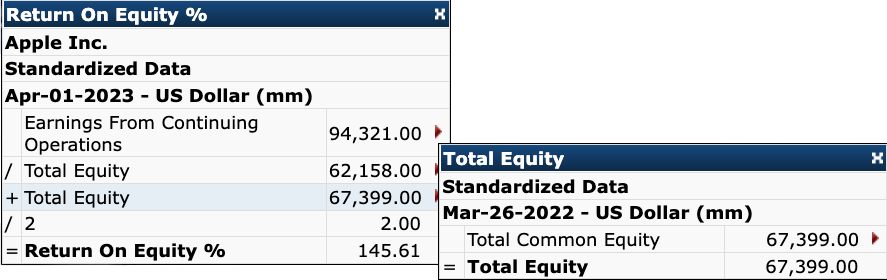
Return on Equity %
To calculate Return on Equity %, we use the following formula:
Return on Equity % = Earnings From Continuing Operations / ((Total Equity (t) + Total Equity (t-1)) / 2)
The example below is for Apple Inc. as of April 1, 2023.

Return on Invested Capital (ROIC) %
ROIC is calculated using the following formula:
ROIC = NOPAT / Average Invested Capital
Where;
NOPAT = EBIT less income tax expense.
Invested Capital = (Long-term debt + short-term debt + shareholder equity + current leases + long-term leases)
Average Invested Capital = (Invested Capital Y0 + Invested Capital Y-1) / 2
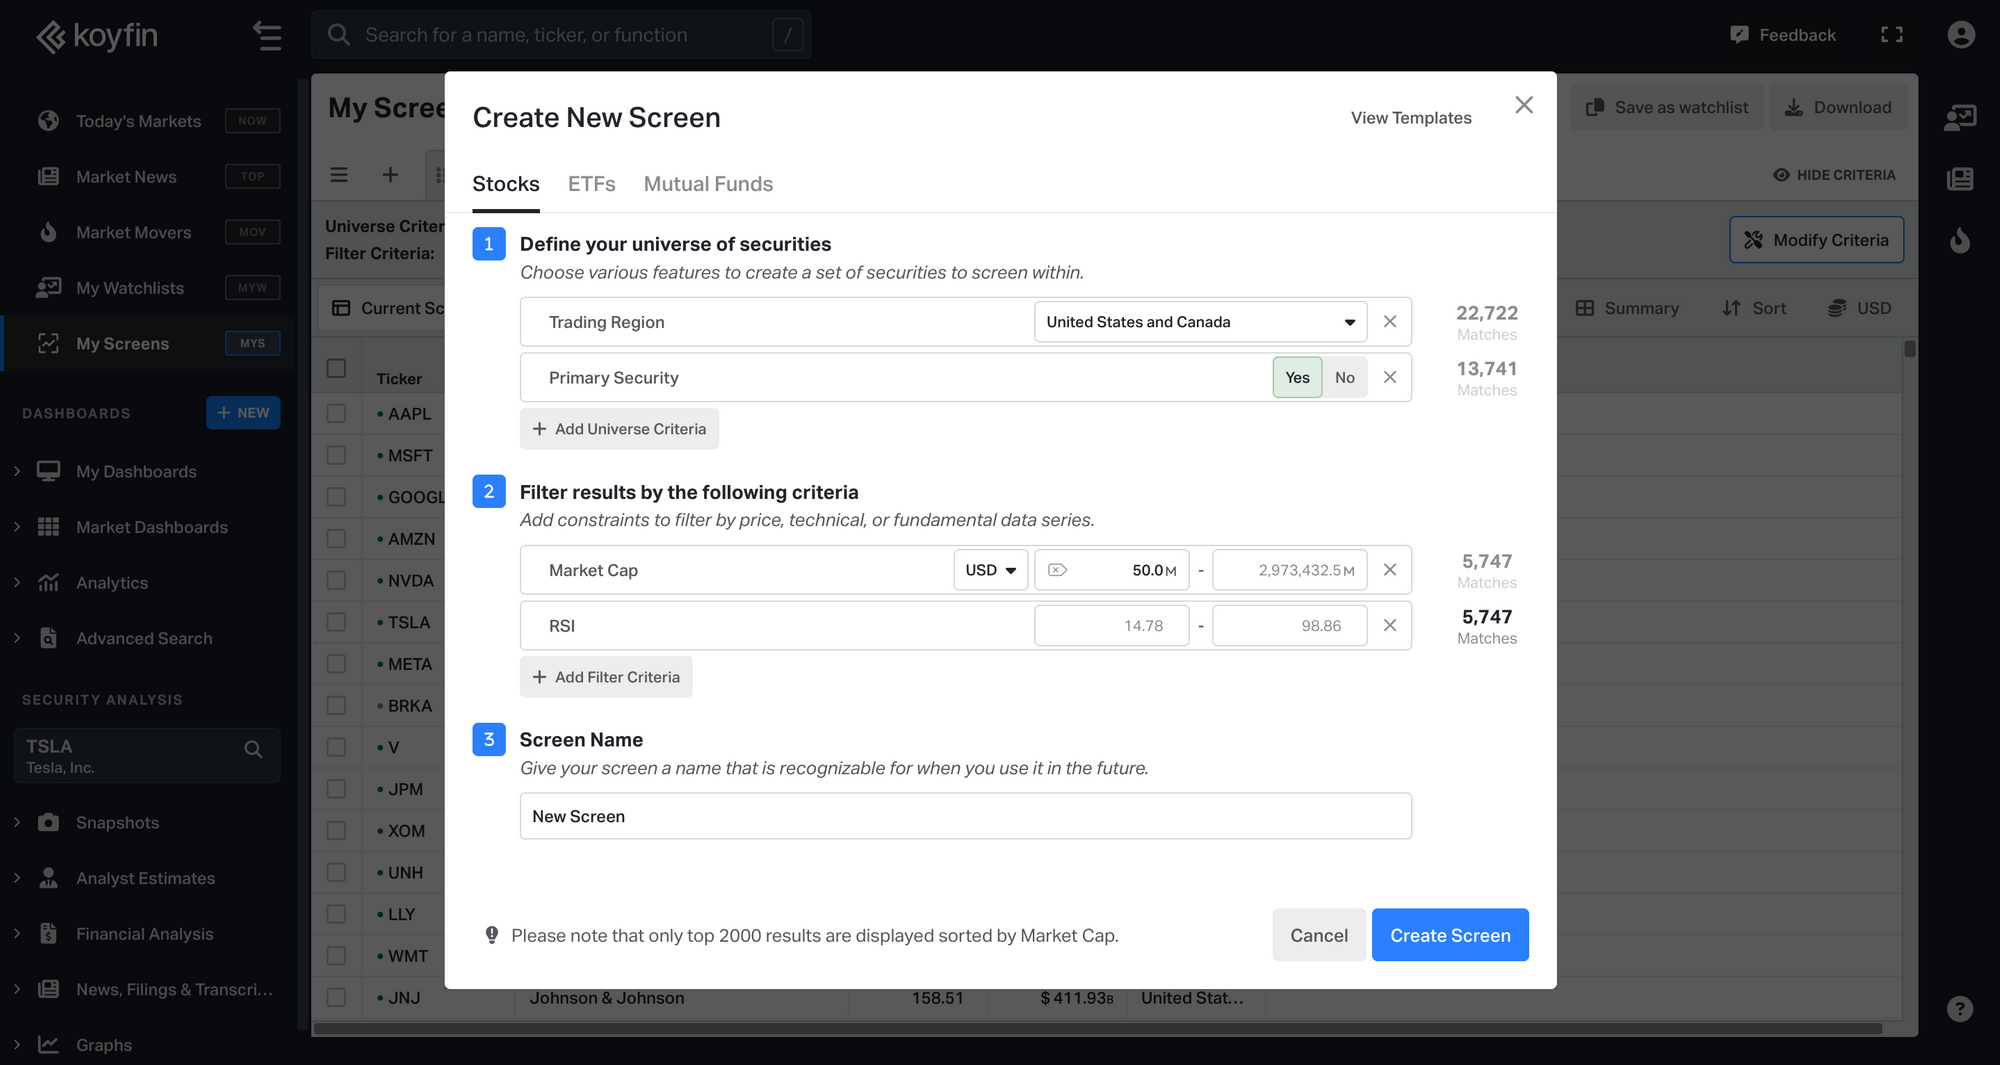
RSI
RSI is calculated using the following formula:
RSI = 100 – (100 / [1 + {14-Day Average Gain / 14-Day Average Loss}])
You can use our My Screens functionality to screen for stocks based on their RSI values. To do this, create a new screen and add RSI as a criterion.
R-Squared (All Funds)
R-Squared represents the percentage of a fund's return movements that can be explained by movements in its benchmark. A value of 100 indicates perfect correlation with the benchmark; a value of 0 indicates no correlation. R-Squared ranges from 0 to 100.
This item is calculated using the following formula:
- R² = Cov(Rf, Rb)² / (Var(Rf) × Var(Rb))
where
- R² = R-Squared
- Cov(Rf, Rb) = Covariance of the fund's returns and the benchmark's returns
- Var(Rf) = Variance of the fund's returns
- Var(Rb) = Variance of the benchmark's returns
Data is sourced from Morningstar and is available for 1Y, 3Y, 5Y, 10Y, and 15Y periods.
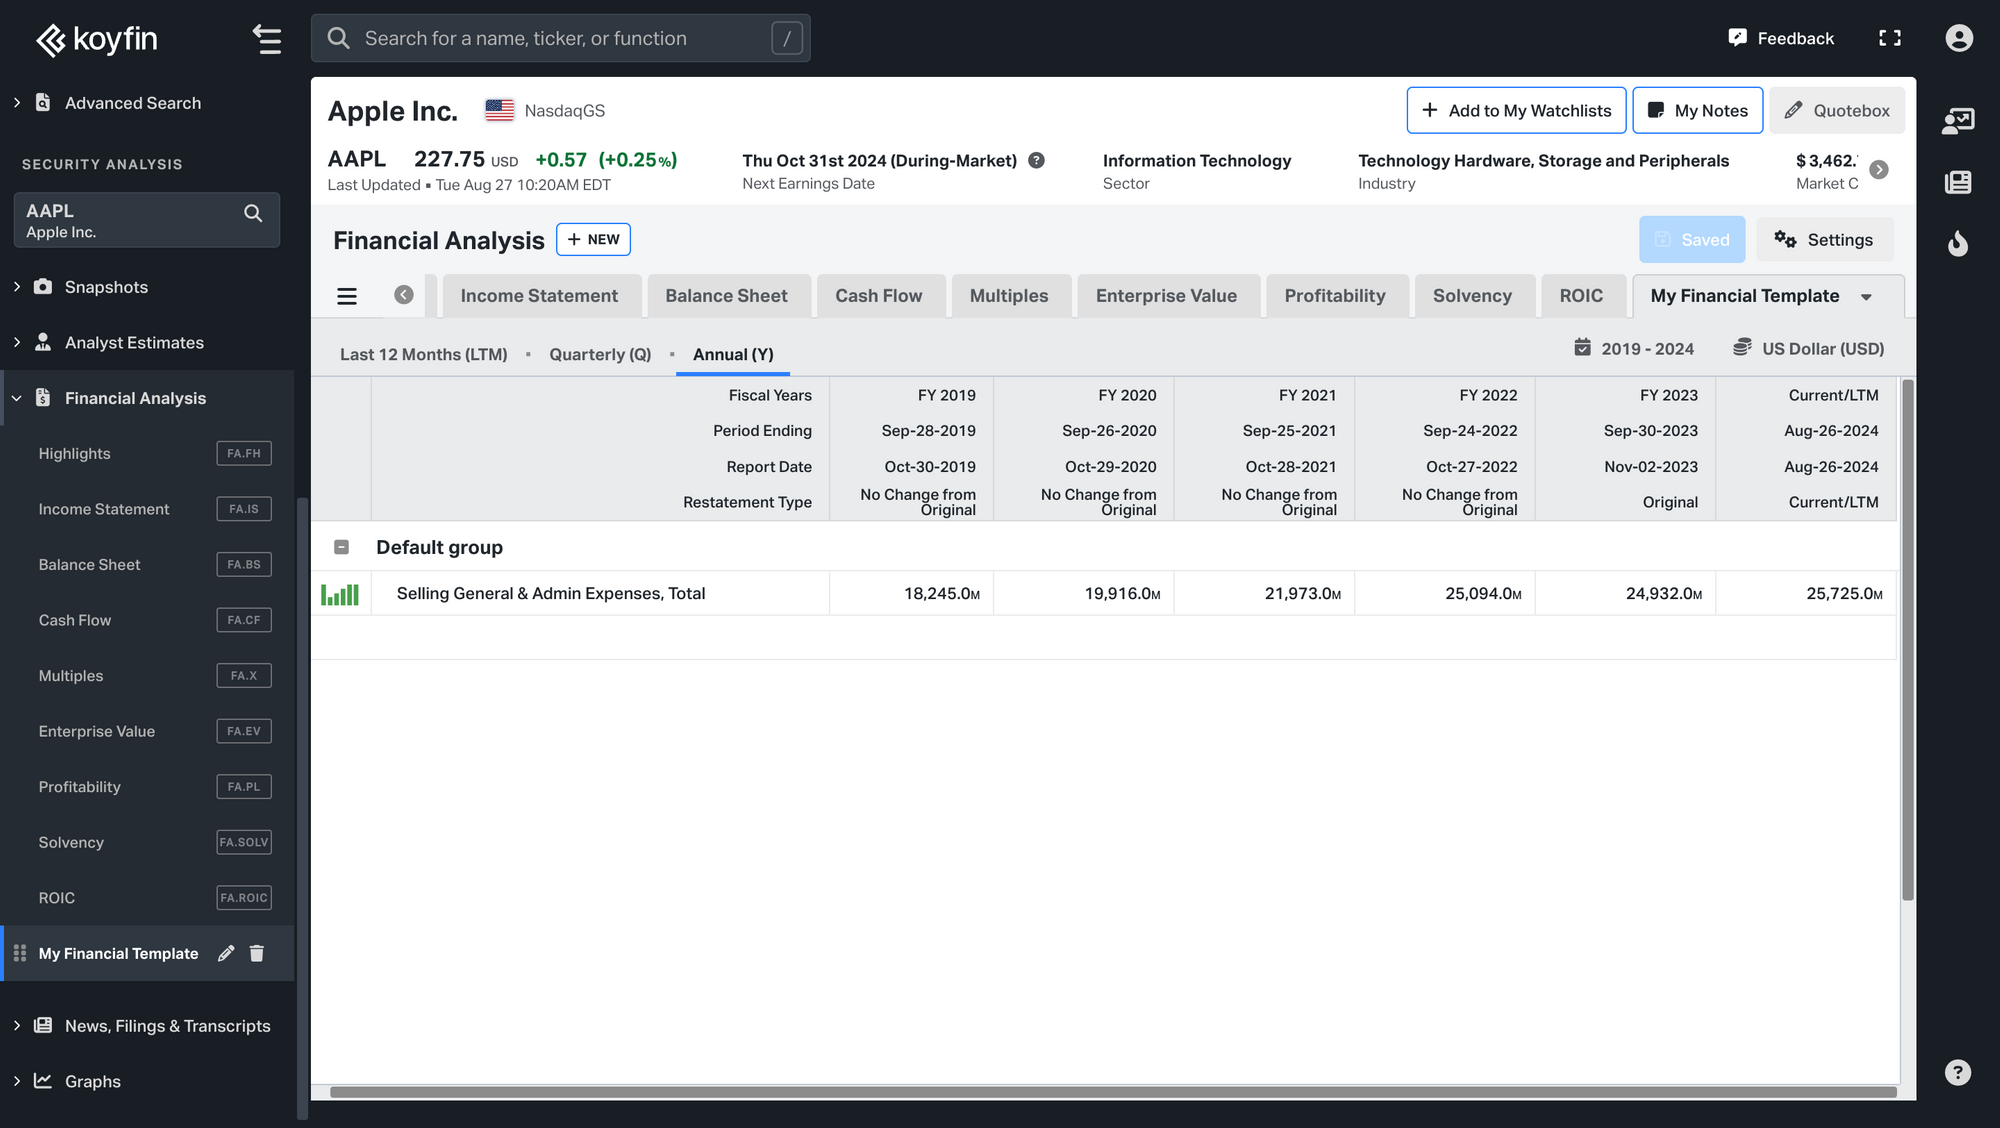
Selling General and Admin Expenses, Total
Selling General and Admin Expenses, Total is a summary line item with the following components:
• Selling General and Admin Expenses
• Exploration / Drilling Costs
• Stock-Based Compensation (IS)
• Provision for Bad Debts
• Pre-Opening Cost
In our paid plans, you can create a custom Financial Analysis (FA) template and include this data item. For more information about this feature, please see this article.
Shareholder Yield %
Shareholder Yield % is based on three important components compared to the Market Capitalization:
- Dividend Yield % — the amount of dividends paid to shareholders
- Buyback Yield % — the amount spent repurchasing shares. This may indicate that management believes a stock is undervalued
- Debt Paydown Yield % — the net change in long term debt over the trailing twelve months. Some investors consider that debt paydown is a way to enhance shareholder value by increasing the equity holder’s claim on the assets
You can find the Shareholder Yield % of a company in the Dividend Snapshot.
Sharpe Ratio (All Funds)
The Sharpe Ratio measures a fund's risk-adjusted return by calculating how much excess return it earns per unit of total risk. A higher Sharpe Ratio indicates better historical risk-adjusted performance.
This item is calculated using the following formula:
- Sharpe Ratio = (Ri − RFi) / StDev
where
- Ri = Return of the fund in period i
- RFi = Return of the risk-free investment in period i
- StDev = Standard deviation of the fund's annualised excess returns
Data is sourced from Morningstar and is available for 1Y, 3Y, 5Y, 10Y, and 15Y periods.
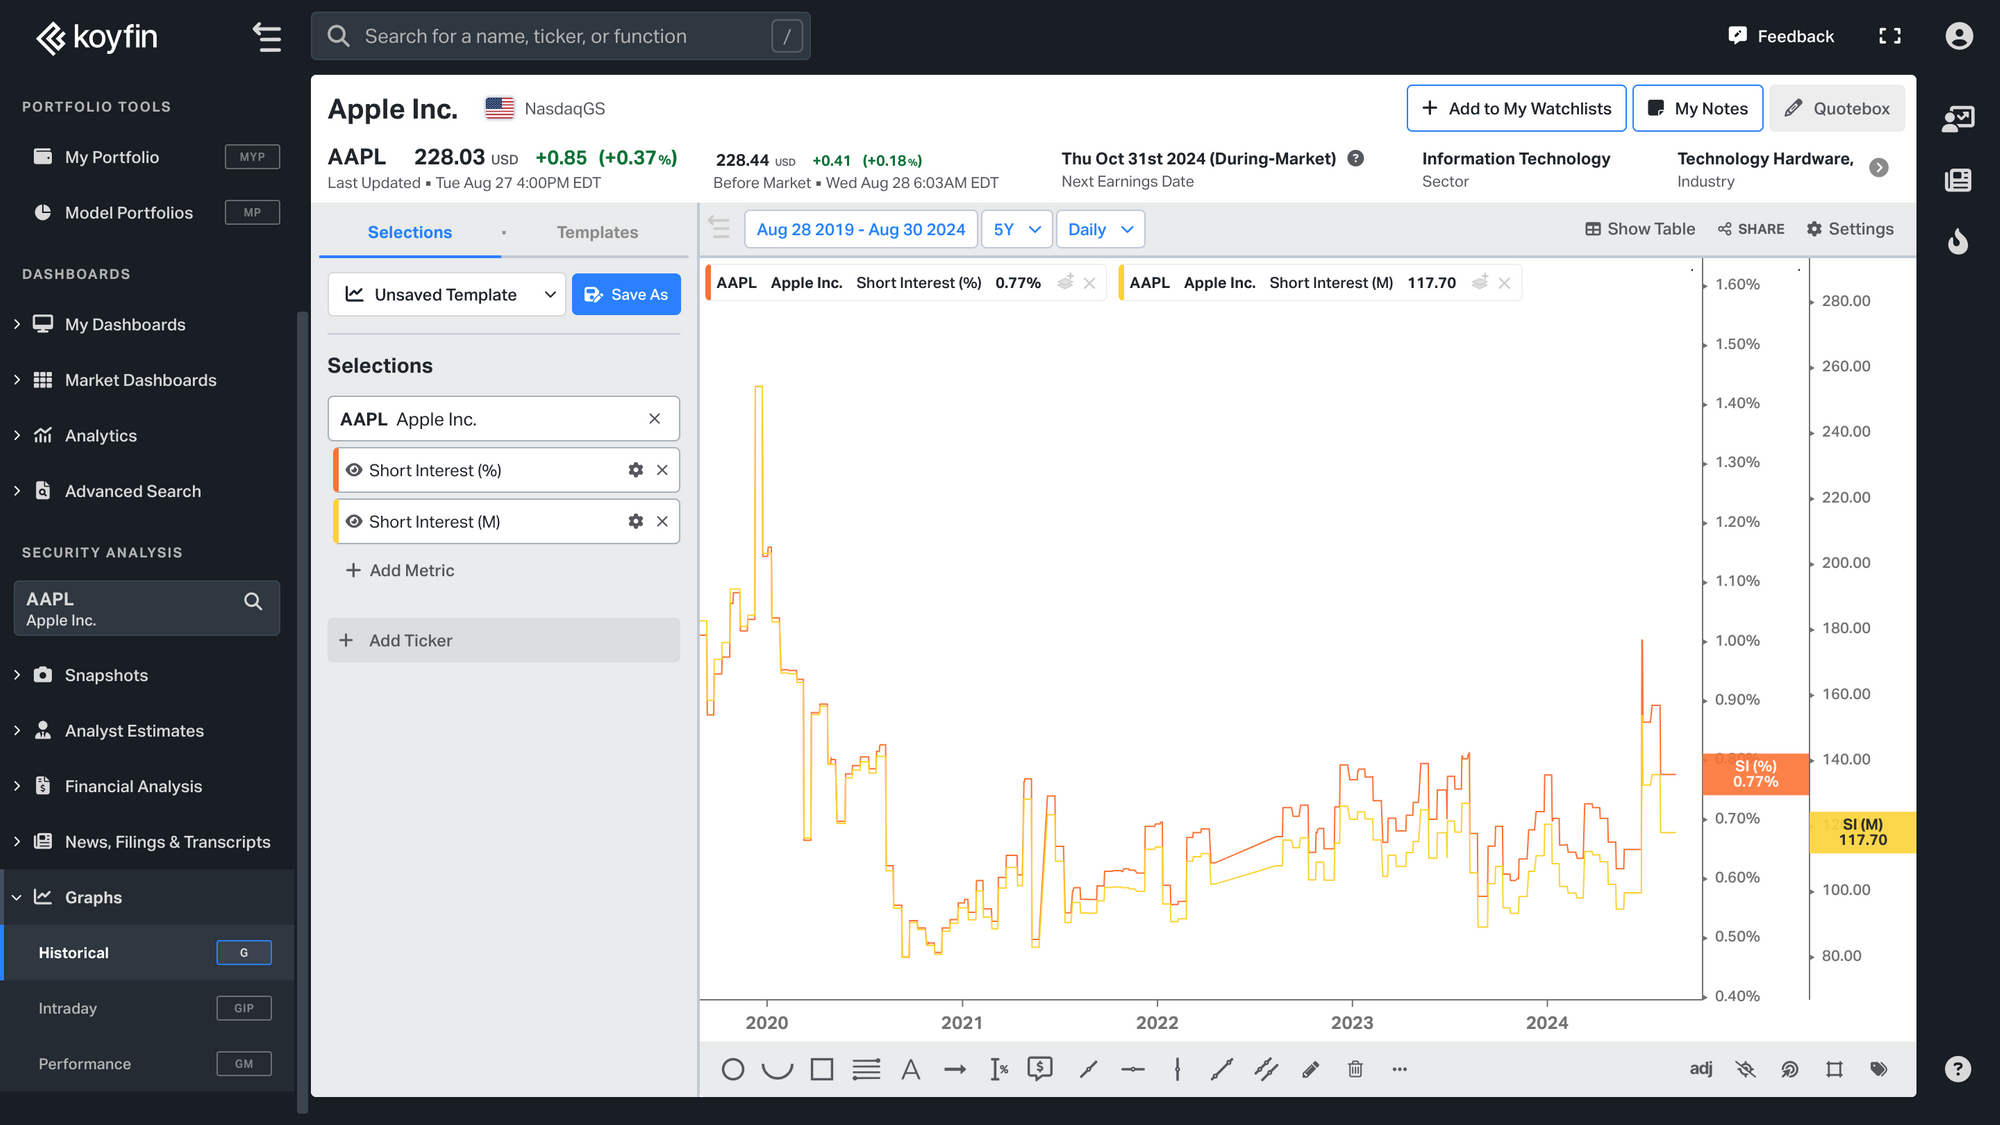
Short Interest (% and Notional)
Our Short Interest data is updated every 2 weeks with a 3-day delay. The data comes from the exchange. Short Interest data covers all stocks traded on US exchanges.
You can view a historical time series of Short Interest Notional and Short Interest % of Market Cap in the G chart.
Short Term Investments
Short Term Investments are a line item with the following components:
• Deposits at interest in securities
• Securities borrowed
• Cash and securities segregated
• Securities owned
• Securities purchased under agreements to resell
On Koyfin, this data item can be found under the Balance Sheet section of the Financial Analysis.
Skewness (All Funds)
Skewness measures the asymmetry of a fund's return distribution. A negative Skewness indicates a longer left tail, meaning a higher likelihood of extreme negative returns. A positive Skewness indicates a longer right tail. A perfectly symmetrical distribution has a Skewness of 0.
This item is calculated using the following formula:
- S = [n / ((n−1)(n−2))] × Σ((Ri − R̄) / σ)³
where
- S = Skewness
- Ri = Return of the fund in period i
- R̄ = Mean return
- σ = Standard deviation
- n = Number of observations
Data is sourced from Morningstar and is available for 1Y, 3Y, 5Y, 10Y, and 15Y periods.
Sortino Ratio (All Funds)
The Sortino Ratio is a useful way for investors, analysts, and portfolio managers to evaluate an investment's return for a given level of bad risk. Since this ratio uses the downside deviation as its risk measure, it addresses the problem of using total risk, or standard deviation, as upside volatility is beneficial to investors. Like the Sharpe Ratio, a higher Sortino Ratio is better. When looking at two similar investments, the one with the higher Sortino Ratio is earning more return per unit of bad risk.
This item is calculated using the following formula:
- S = (⟨R⟩ − Rf) / σd
where
- S = Sortino Ratio
- ⟨R⟩ = Expected return
- Rf = Risk-free rate of return
- σd = Downside deviation
Data is sourced from Morningstar and is available for 1Y, 3Y, 5Y, 10Y, and 15Y periods.
Standard Deviation (All Funds)
Standard Deviation measures the dispersion of a fund's monthly returns around its average return, annualised. A higher Standard Deviation indicates greater return variability and therefore higher volatility. Morningstar computes Standard Deviation using trailing monthly total returns for the relevant period, then annualises the result.
This item is calculated using the following formula:
- σ = √(Σ(Ri − R̄)² / (n − 1))
where
- σ = Standard deviation
- Ri = Return of the fund in month i
- R̄ = Average monthly return of the fund
- n = Number of months in the period
Data is sourced from Morningstar and is available for 1Y, 3Y, 5Y, 10Y, and 15Y periods.
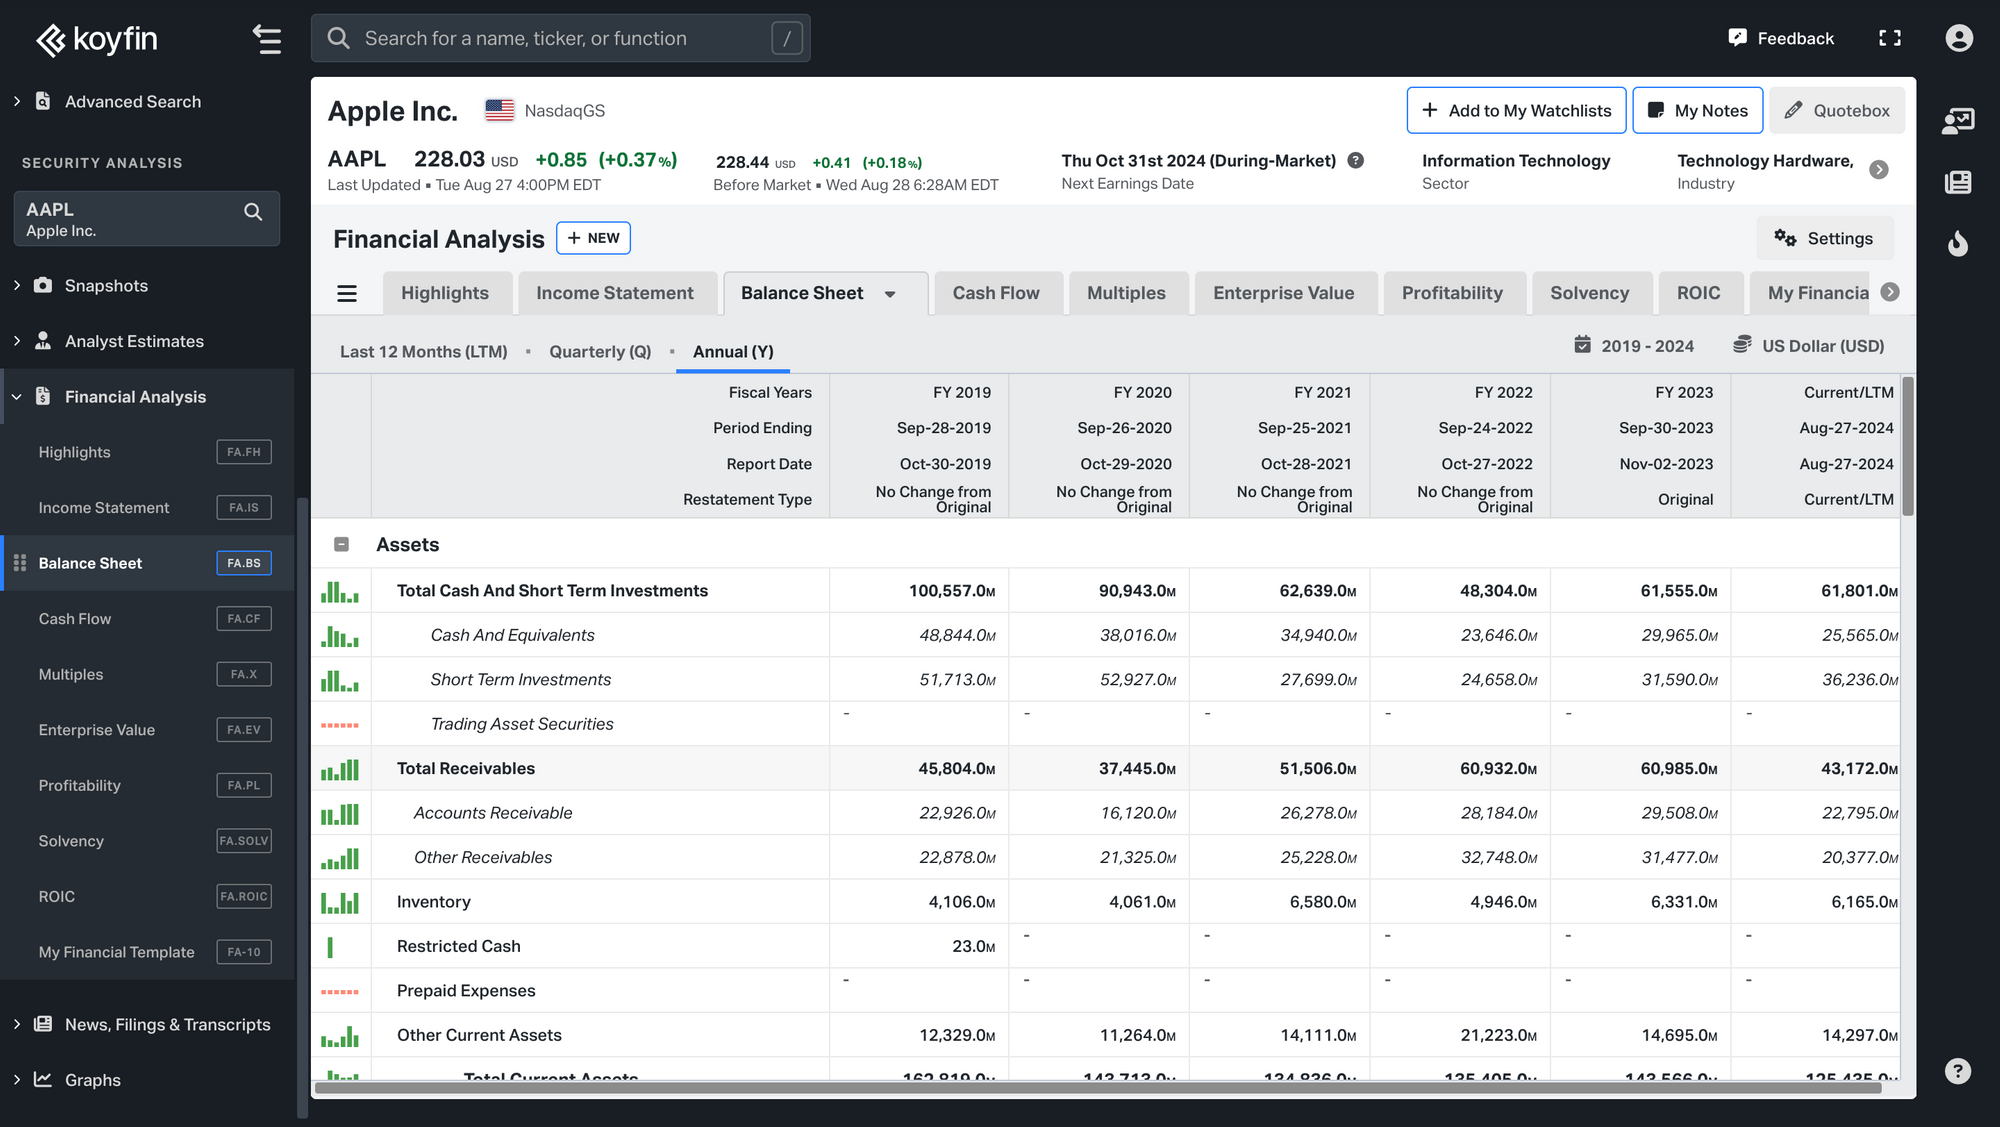
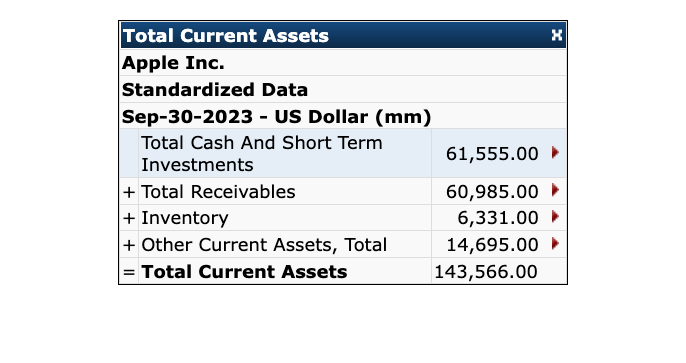
Total Current Assets
Total Current Assets is a line item with the following components:
• Total Cash and Sort Term Investments
• Total Receivables
• Inventory
• Prepaid Expenses
• Finance Division Loans and Leases, Short-Term
• Finance Division Other Current Assets, Total
• Other Current Assets, (Summary Subtotal)
The example below is for Apple Inc. as of September 30, 2023.
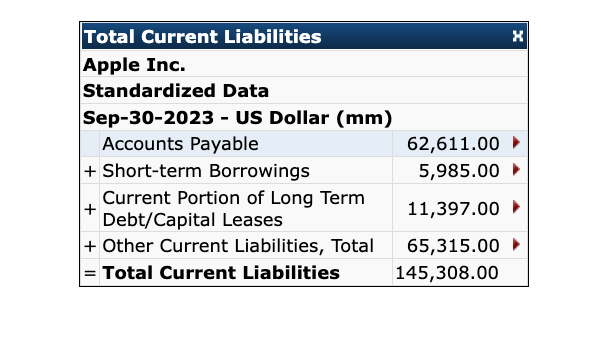
Total Current Liabilities
Total Current Liabilities is an essential financial indicator that provides valuable insights into a company's short-term financial obligations. It is a subtotal line item in the standard financial template and consists of various components:
• Accounts Payable, Total
• Accrued Expenses, Total
• Short-term Borrowings
• Current Portion of Long Term Debt/Capital Leases
• Finance Division Debt Current
• Finance Division Other Current Liabilities, Total
• Other Current Liabilities, Total
The following example shows the calculation for Apple Inc. as of September 30, 2023.
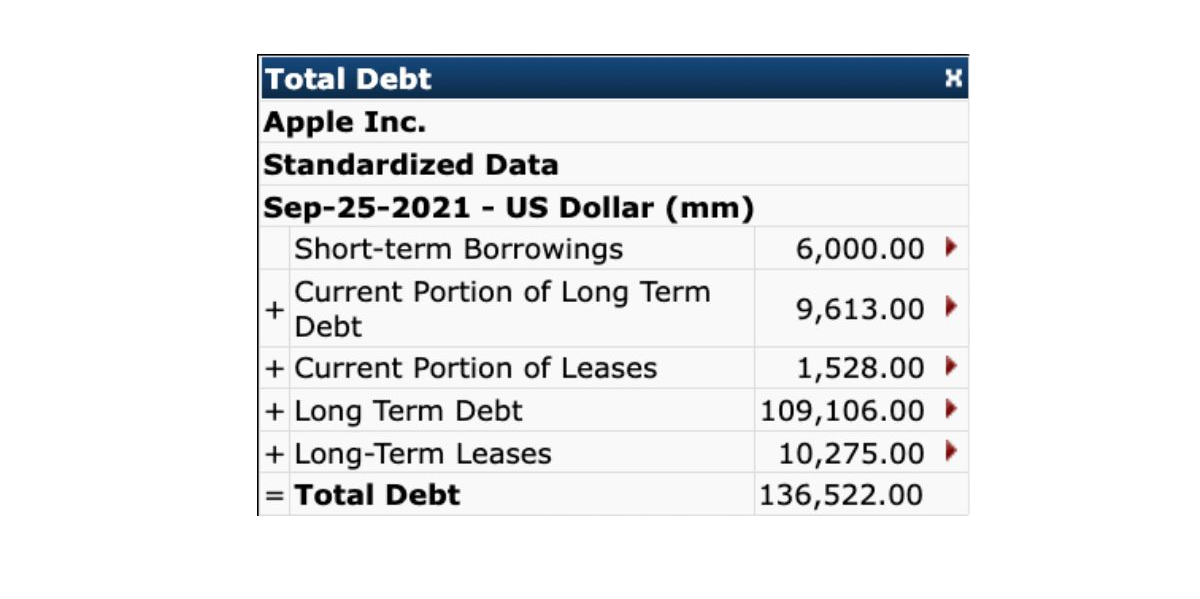
Total Debt
Total Debt is a financial metric that measures the total amount of money a company owes to its creditors.
Total Debt consists of the following components:
• Short-term Borrowings
• Current Portion of Long-Term Debt
• Current Portion of Leases
• Long-Term Debt
• Long Term Leases
• Finance Div. Debt Current
• Finance Div. Debt Non-Curr.
The example below is for Apple Inc. as of September 25, 2021.
Long-Term Debt and Current Portfolio of Long-Term Debt refer to the term debt the company presents on the balance sheet. Typically, the current portion (found in current liabilities) is term debt due within 12 months, while Long-Term Debt (found in non-current liabilities) is due > 12 months.
Total Debt to Capital %
The Total Debt to Capital % metric measures how much of a company’s capital structure is funded by debt.
It is calculated as follows: Total Debt / (Total Preferred Equity + Total Common Equity + Total Debt + Minority Interest
If the denominator is less than or equal to zero then the ratio will be shown as '-'.
Total Debt / Equity %
Total Debt to Equity (%) is a ratio which expresses the relationship between total debt and total equity and is calculated as follows:
Total Debt / Total Equity.
If the denominator is less than or equal to zero then the ratio will be shown as '-'.
Total Equity
Total Equity represents owners’ residual interest in the company excluding liabilities. The metric is the sum of:
• Total Preferred Equity
• Total Common Equity
• Total Minority Interest
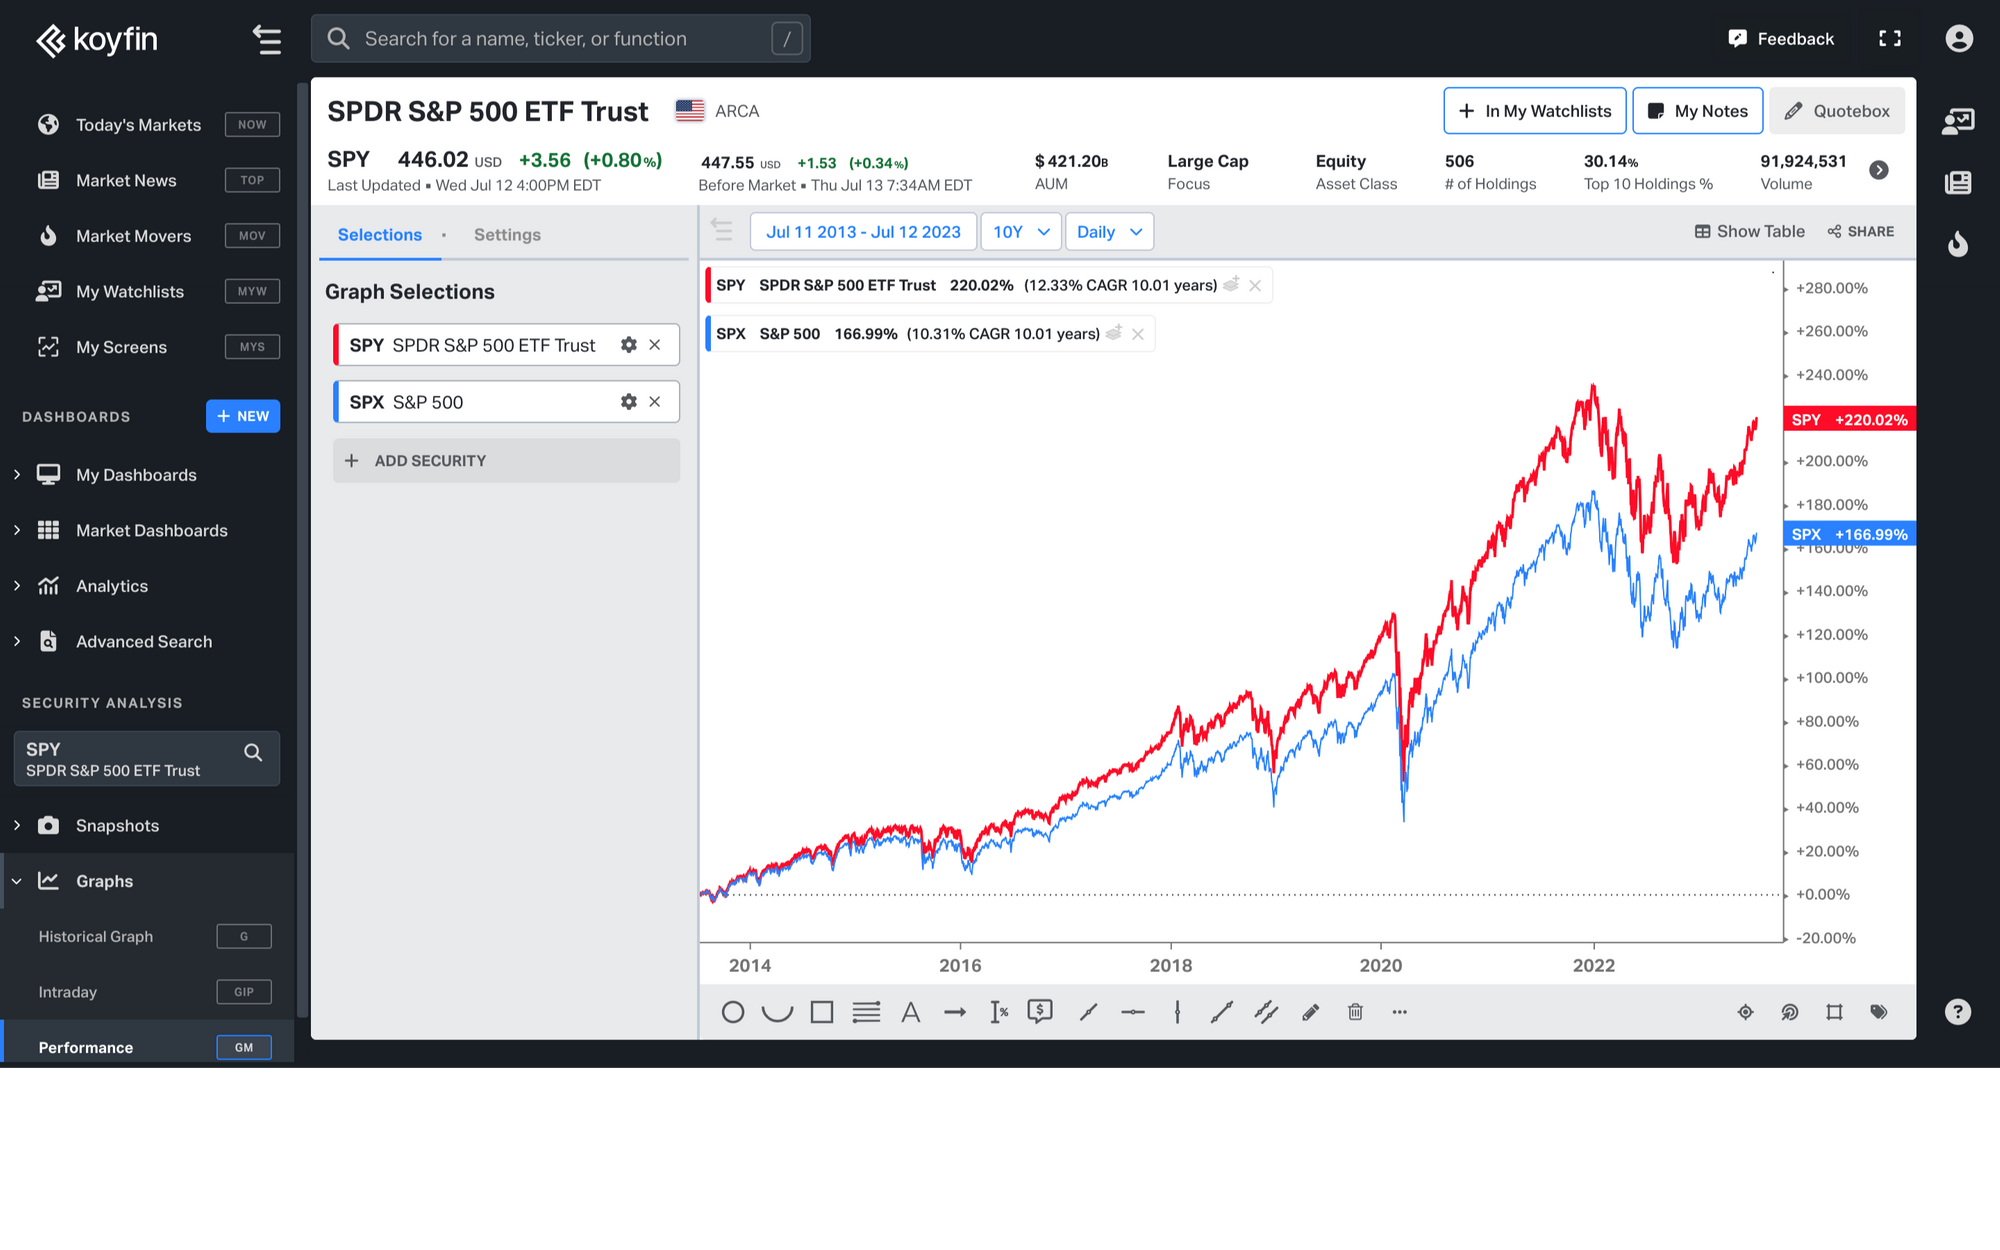
Total Return and Price Change %
Total Return is a metric that captures the full impact of dividends on the value of a stock or ETF, beyond just the changes in its market price. It is derived using the "adjusted price," a figure that adds dividends back to the stock's price at each distribution point, under the assumption these dividends are reinvested. This calculation combines the stock's Price Change and dividend payments to give a complete picture of its performance.
In Koyfin, Total Return can be analyzed using various features such as watchlists, graphs, and screeners.
The Historical Price Graph (G) displays both the Price Change and Total Return percentages as separate data series, allowing for a side-by-side comparison.
The Normalized Performance Graph (GM) shows the percentage change that represents the Total Return, calculated from the stock's or ETF's adjusted price history.
However, it's important to note that Koyfin does not compute Total Return for equity indices like the SPX, where the Normalized Performance Graph only displays Price Changes, excluding dividends. For an analysis inclusive of Total Return on an index similar to the SPX, the SPY ETF is a recommended alternative.
You can read more about Adjusted vs. Unadjusted prices here.
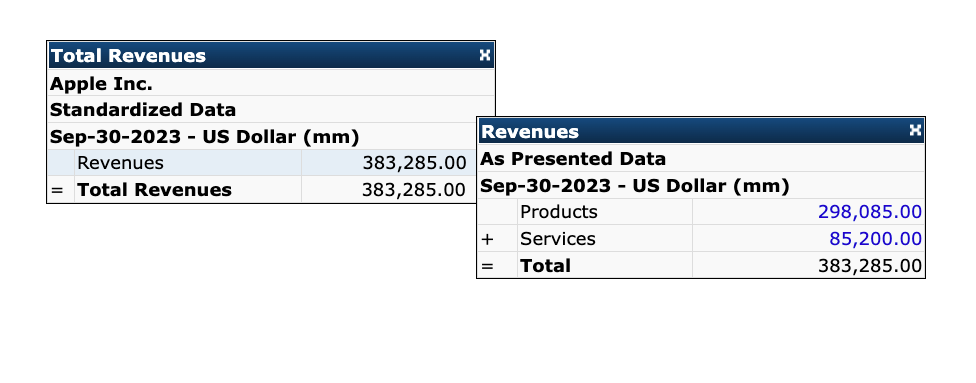
Total Revenues
Total Revenues is a line item comprised of the following components:
• Revenues
• Other Revenues, (Summary Subtotal)
The following example shows the calculation for Apple Inc. as of September 30, 2023.
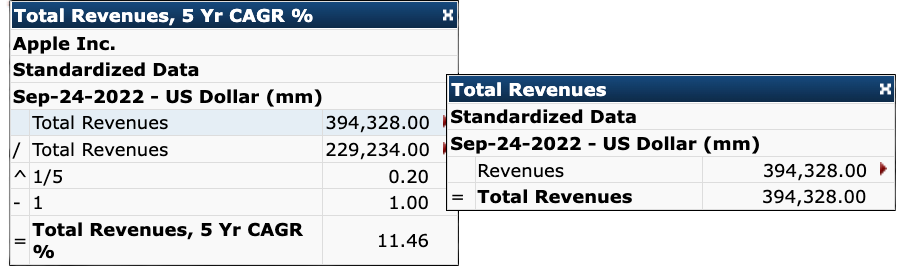
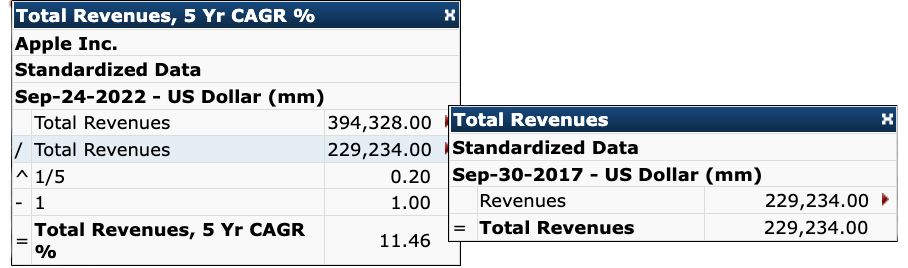
Total Revenues, CAGR
The Total Revenues, CAGR data series shows the historical annualized growth rate:
- 5 FY: CAGR of the latest fiscal year vs. the FY 5 years ago.
- 1 FQ: CAGR of the latest fiscal quarter value vs. the FQ 5 years ago.
- 1 TTM: CAGR of the trailing 12-month value vs. the trailing 12-month value 5 years ago.
The calculation for Apple Inc.'s Total Revenues, CAGR as of September 24, 2022, is shown below.
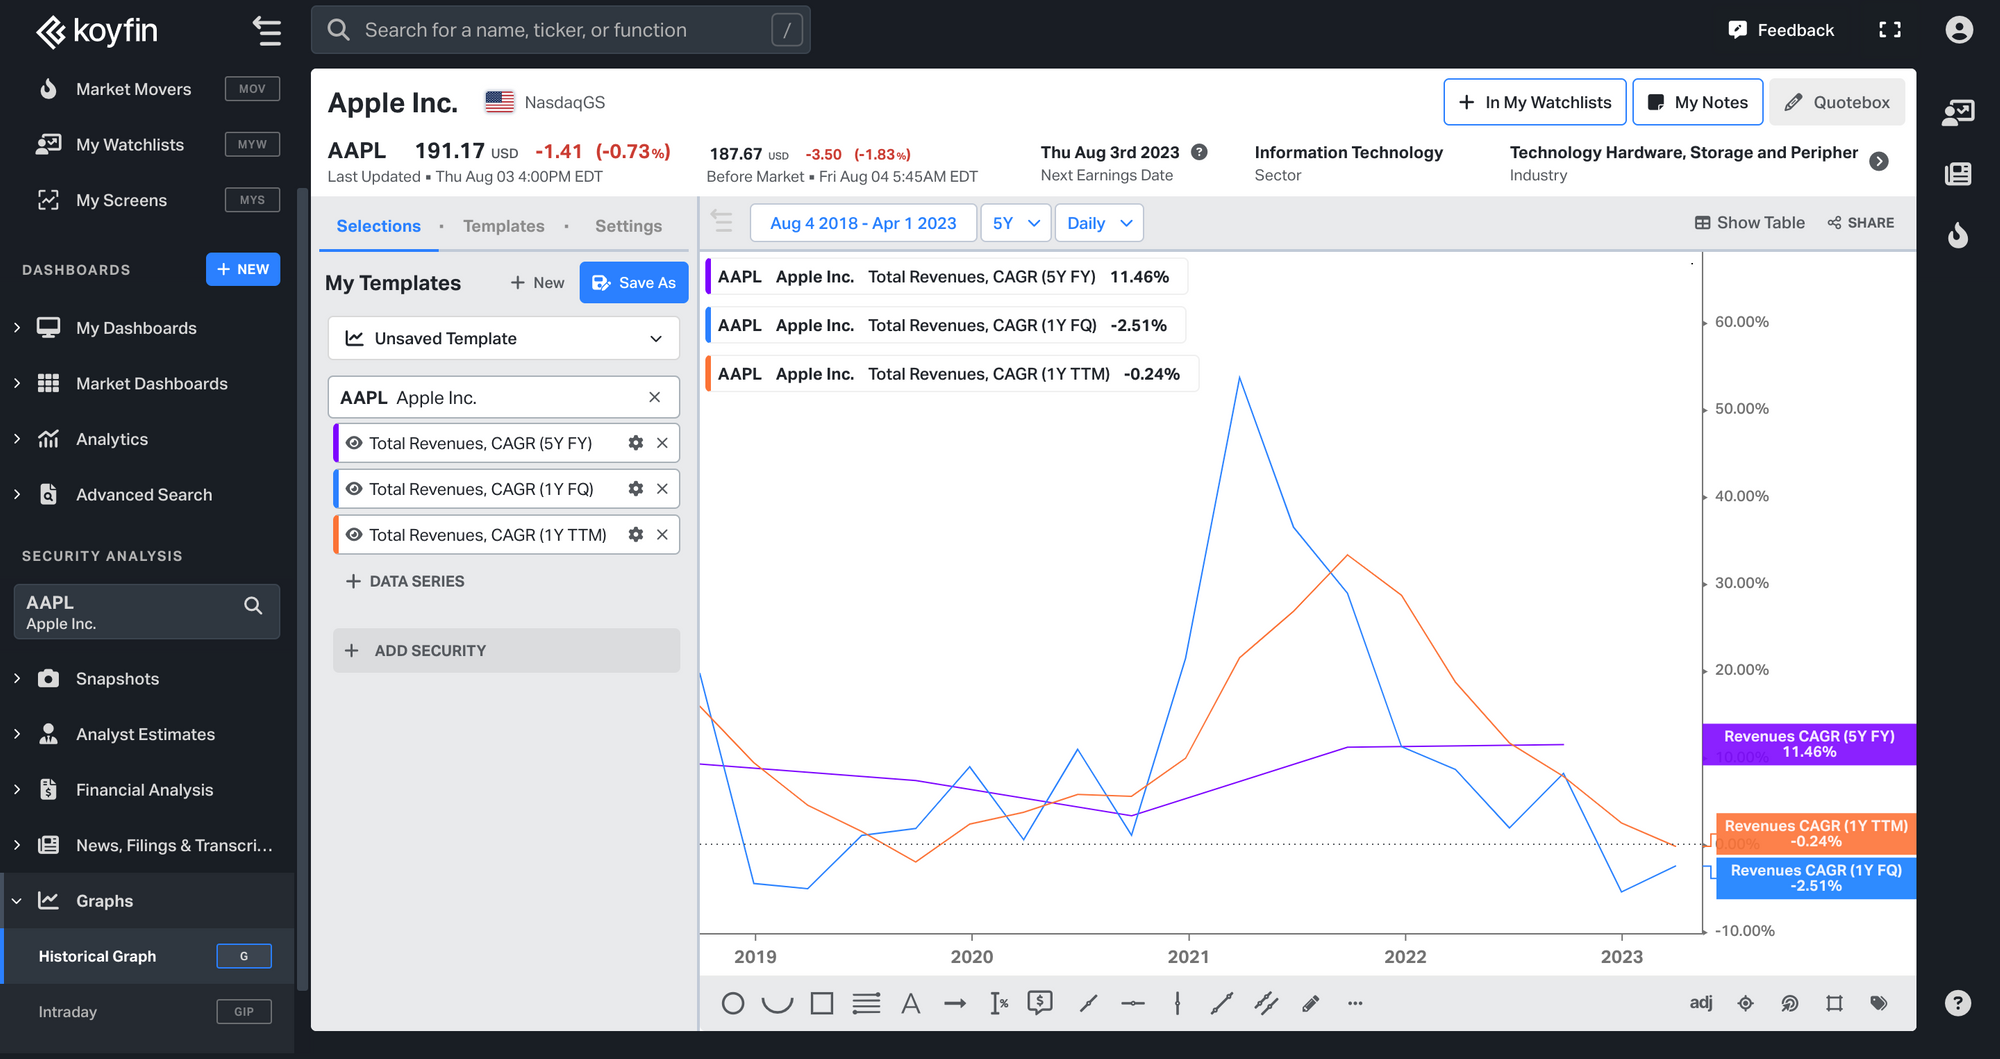
To visualize the Total Revenues, CAGR of a company, you can refer to the G chart. The graph below provides an illustration of Total Revenues, CAGR values for Apple Inc., including 1Y TTM, 1Y FQ, and 5Y FY.
Tracking Error (All Funds)
Tracking Error measures the consistency of a fund's returns relative to its benchmark. A higher Tracking Error indicates the fund's performance diverges more frequently from its benchmark.
This item is calculated using the following formula:
- TE = StDev(Rf − Rb)
where
- TE = Tracking Error
- Rf = Return of the fund in each period
- Rb = Return of the benchmark in each period
- StDev = Standard deviation of the return differences
Data is sourced from Morningstar and is available for 1Y, 3Y, 5Y, 10Y, and 15Y periods.
Treynor Ratio (All Funds)
The Treynor Ratio is a measurement of efficiency utilising the relationship between annualised risk-adjusted return and risk. Unlike the Sharpe Ratio, the Treynor Ratio uses market risk (Beta) instead of total risk (Standard Deviation). A higher Treynor Ratio indicates better return per unit of market risk.
This item is calculated using the following formula:
- T = (R − Rf) / β
where
- T = Treynor Ratio
- R = Return of the fund
- Rf = Risk-free rate of return
- β = Beta of the fund
Data is sourced from Morningstar and is available for 1Y, 3Y, 5Y, 10Y, and 15Y periods.
Volatility
Volatility is a measure of the statistical dispersion of the log returns for a given security or market index.
It is calculated as the standard deviation of the log price changes. You can take a look at this example sheet for more information.
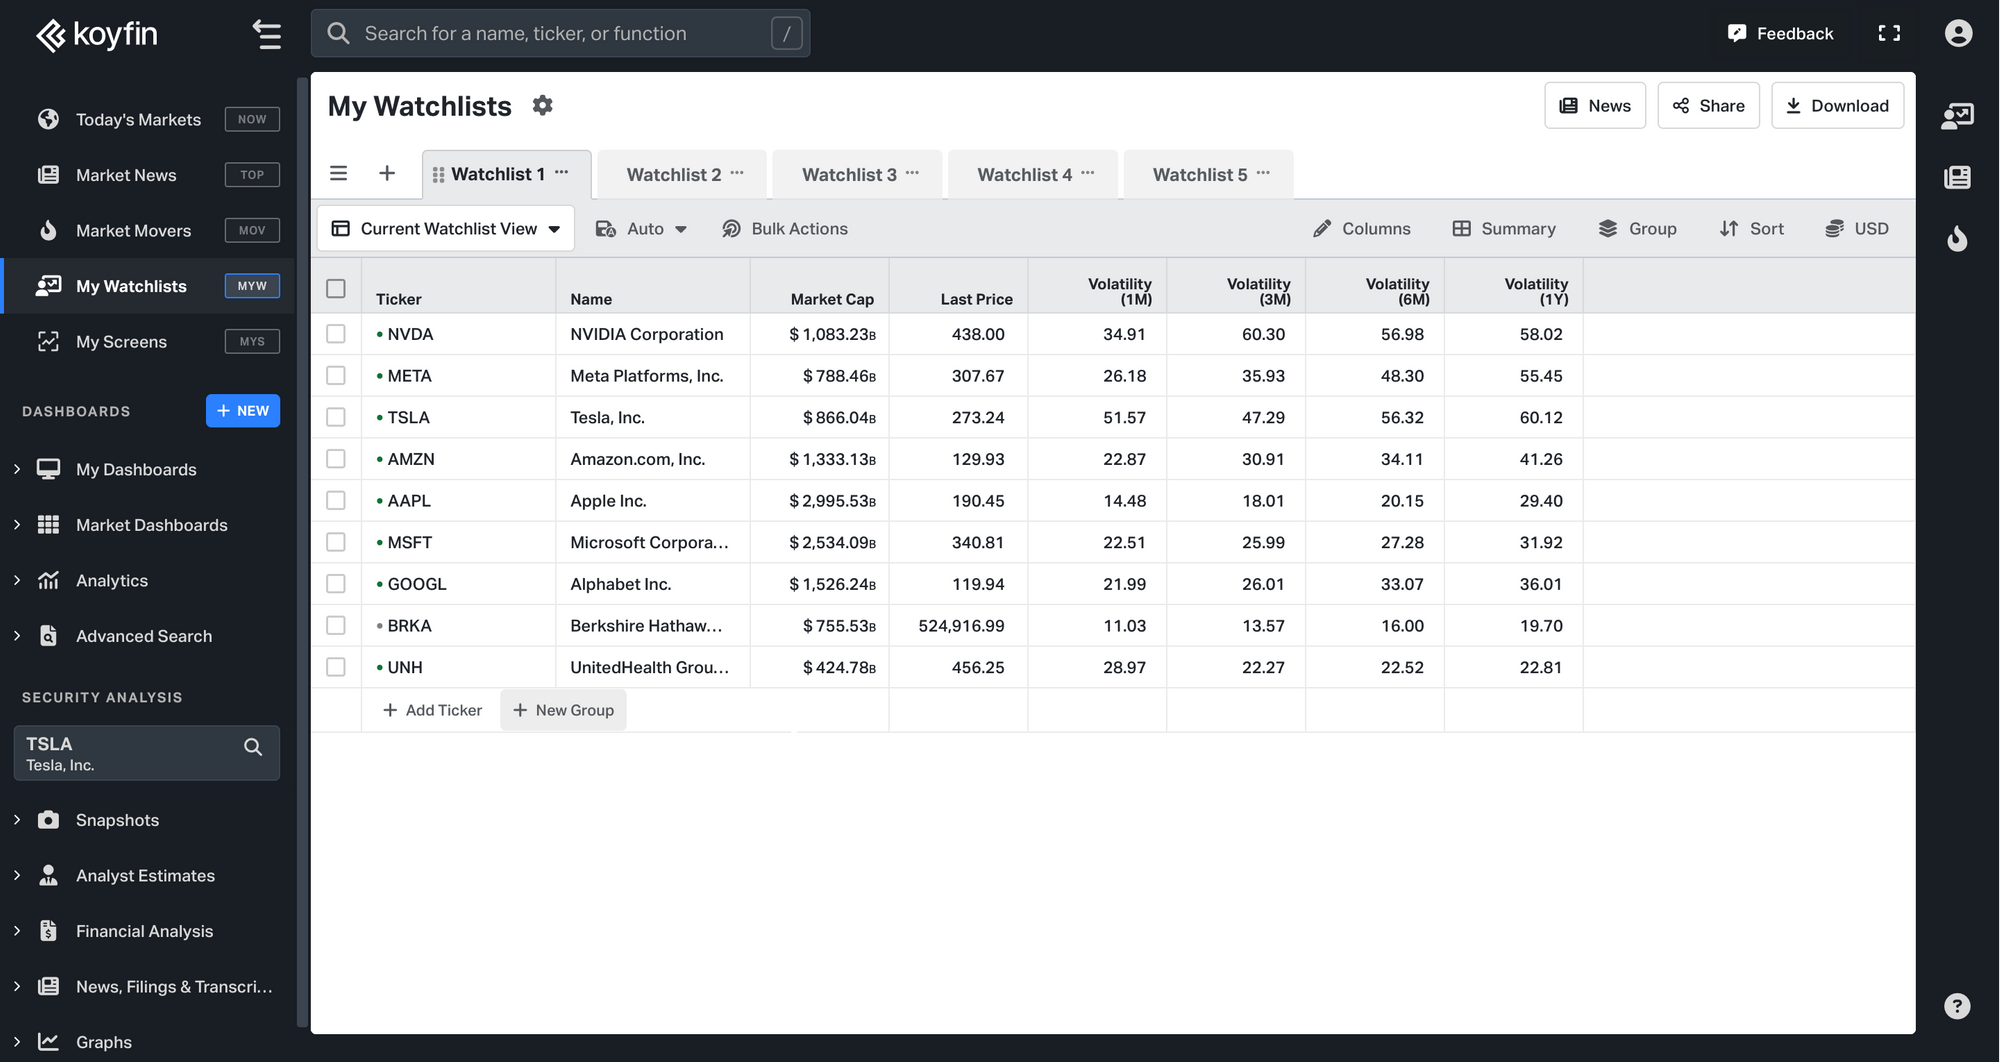
You can add a column for Volatility in My Watchlists. The Volatility column will display the realized volatility over a specified period.
Volatility Score (All Funds)
Volatility Score is a proprietary Morningstar measure of a fund's estimated return volatility, expressed as a score on a fixed scale. Higher scores indicate greater expected volatility.
The score bands are as follows:
- 0–23 Conservative,
- 24–47 Moderate,
- 48–78 Aggressive,
- 79–99 Very Aggressive,
- 100+ Extreme.
Data is sourced from Morningstar and is returned as a single current value with no period variants.
Upside Capture Ratio (All Funds)
The Upside Capture Ratio measures how much of a benchmark's positive return a fund captured during up-market months. A ratio above 100 indicates the fund outperformed the benchmark in up markets.
This item is calculated using the following formula:
- UCR = Ru / Rb
where
- UCR = Upside Capture Ratio
- Ru = Fund return during months when the benchmark return was positive
- Rb = Benchmark return during those same months
Data is sourced from Morningstar and is available for 1Y, 3Y, 5Y, 10Y, and 15Y periods.
Volume
Volume, Average
The Average Volume is the average number of Shares that are traded on a daily basis over the last 10 days of trading.
Volume, Notional Value
It is the $ amount (or other currency) which we calculate by multiplying Shares * Price.
Volume, Shares
The Volume is the number of Shares.
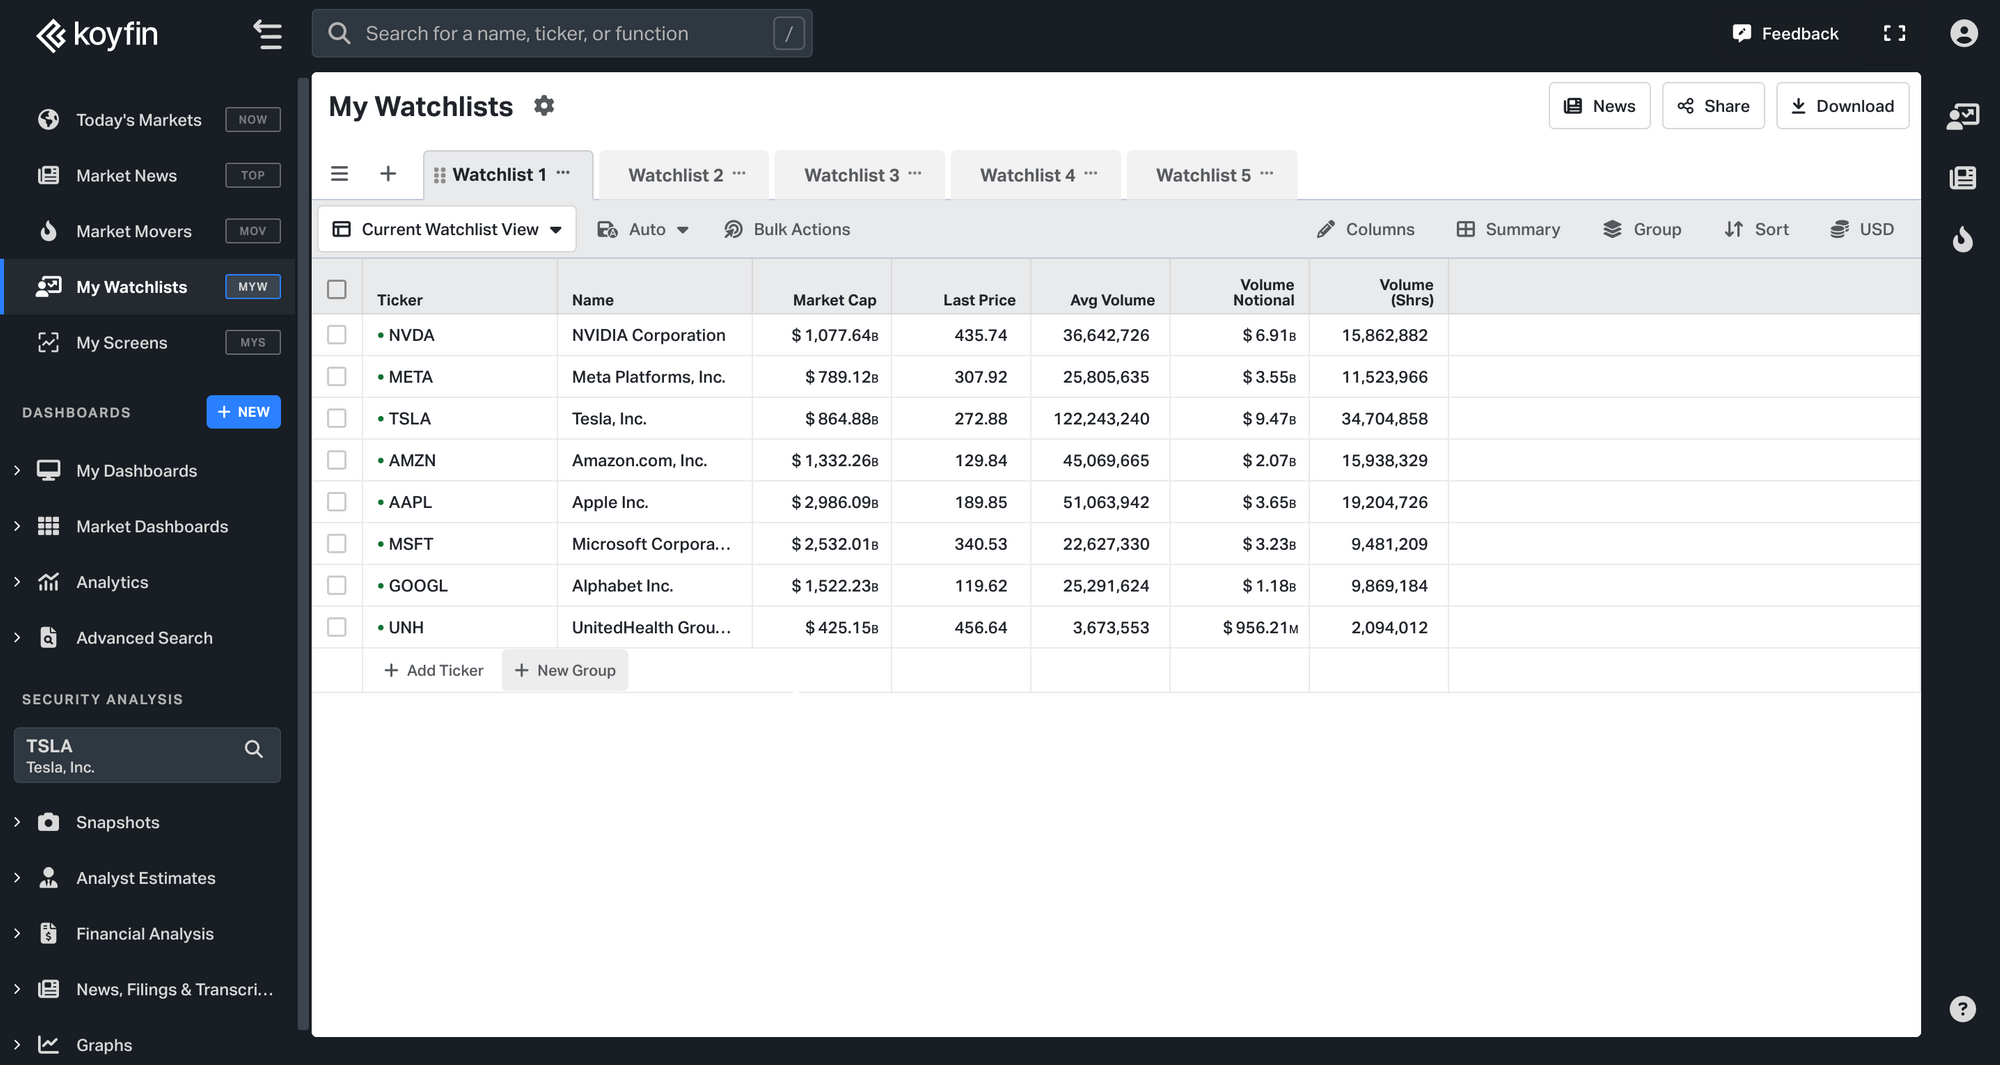
You can add the columns for Volume, Average, Volume, Notional Value, and Volume, Shares to your watchlist on Koyfin.
Relative Volume
Relative volume is calculated based on the specific time of day. For example, the relative volume at 11:00 AM ET is compared to the average volume recorded at 11:00 AM over the past 10 days. You can track Relative Volume in Market Movers, watchlists and screener.
Here are some examples:
Let’s say the 10-day average = 100
Today’s volume is 70. The Relative volume is 0.7 (70/100). This means it’s 30% below average.
Today’s volume is 1. The Relative volume is 0.01 (1/100). This means today’s volume is 99% below average.
Today’s volume is 200. The Relative volume is 2 (200/100). This means today’s volume is 100% above average.
Today’s volume is 0. The Relative volume is 0. You can’t calculate a % for 0.
Working Capital
Working Capital is a financial metric that represents the difference between a company's current assets and its current liabilities.
• Working Capital = Current Assets - Current Liabilities
It serves as an indicator of a company's short-term liquidity, reflecting its ability to cover short-term obligations using readily available resources.
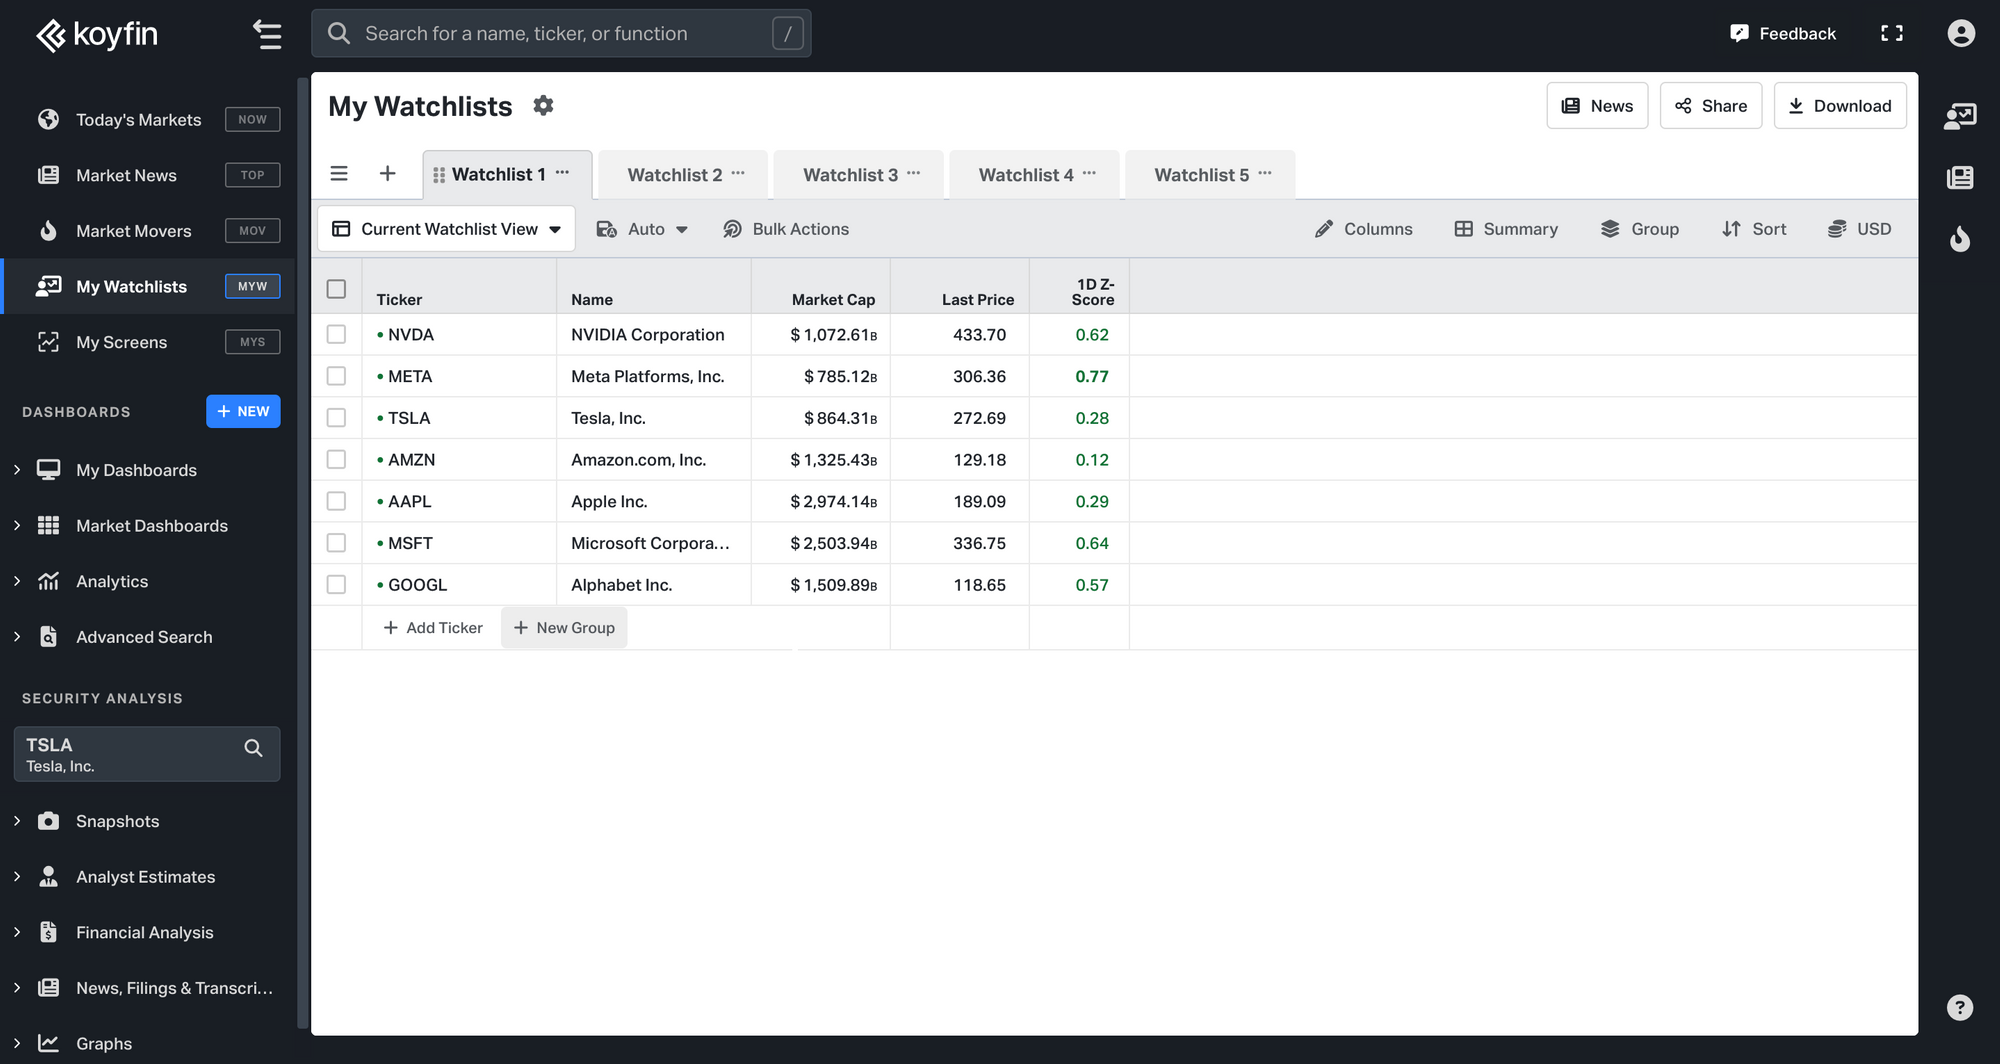
Z-Score
The Z-Score is calculated by dividing the 1D % Change by the Trailing 1-year Volatility. A Z-Score of 1 means the % Change today is equal to 1 Standard deviation relative to the past 1 year of daily Price change.
If you're interested in monitoring the Z-Score for various securities, you can add it as a column to your watchlist.