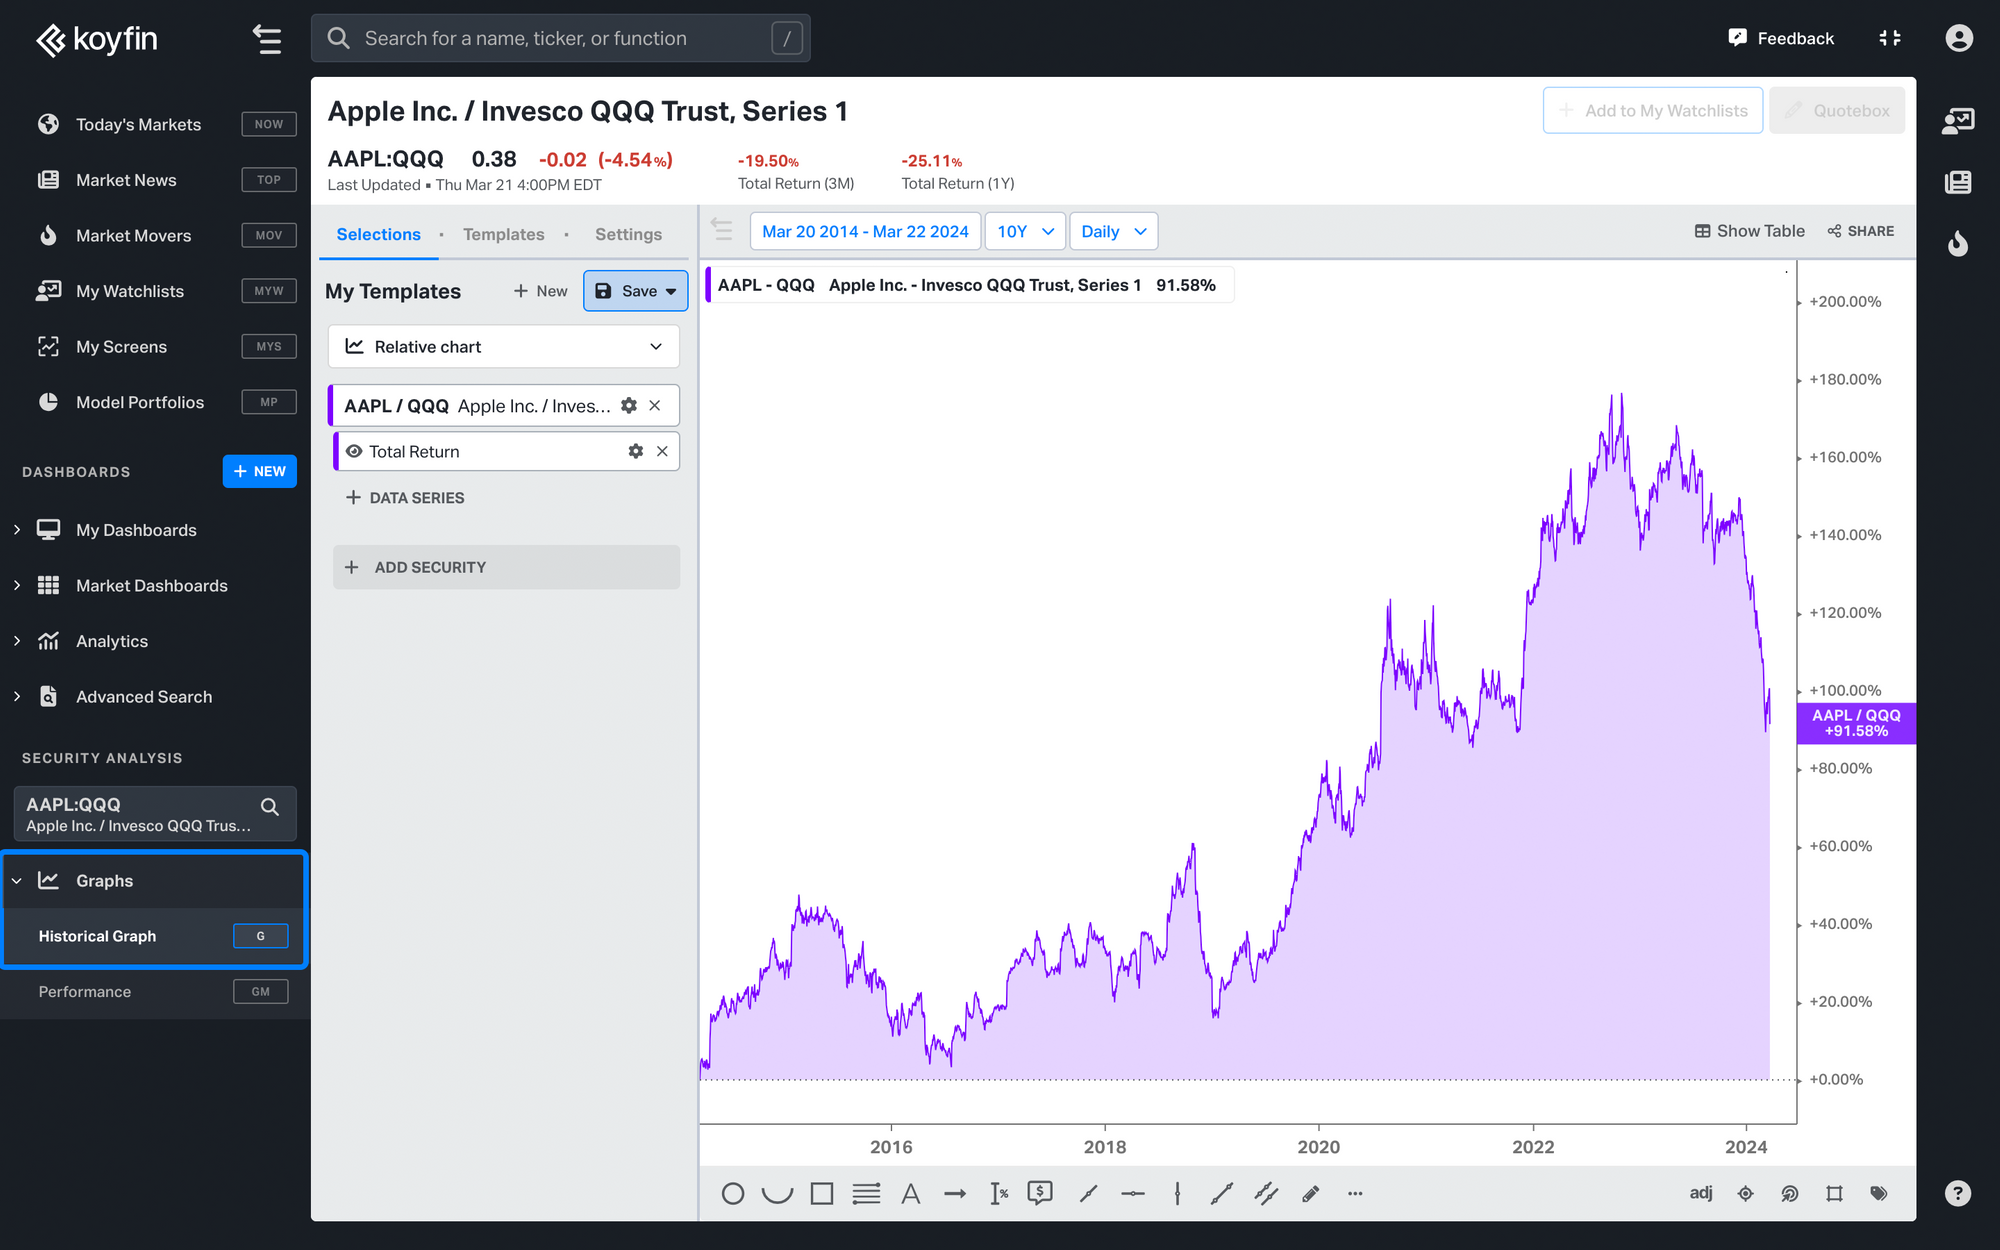
Relative charts are key for analyzing securities' performance, offering a clear view of their strength and trends compared to the market. They are especially useful in pairs trading, allowing investors to assess the comparative performance of securities like AAPL vs. QQQ directly on Koyfin.
Creating and Utilizing Relative Charts
Here’s a quick guide to compare securities, like the Russell 1000 Value and Russell 1000 ETF directly from the G chart:
- Open the Data Series picker and select a security for comparison.
- Type in a colon (:) after the first ticker to initiate the Relative Chart
- Select the comparison security
You can adjust timelines and labels to pinpoint specific trends, such as the fluctuating dominance between value and growth stocks.
While direct adjustments can be made in the G chart, the top search bar offers an alternative method for input.
Broad Applications and Analysis
Relative charts allow for pair trading analysis, like comparing Lululemon to Peloton using price ratios. This method reveals how to balance investments, demonstrating relative charts' utility in financial strategies.
Relative strength (A/B) is the ratio of two prices and approximates the performance of Long $1 of A vs. Short $1 of B with daily rebalancing to make the trade $ neutral ($1 long, $1 short).
Relative spread (%A - %B) is the performance spread of two assets. This assumes an investor is long $1 of A vs. short $1 of B at the start of the chart and doesn't rebalance the trade.
The Power of Relative Charts
These charts are an underused asset in financial analysis, providing deep insights into market movements and investment opportunities. They empower investors to make informed decisions by understanding the nuanced performances of their investment choices.
Check out this video to get more information about these features.