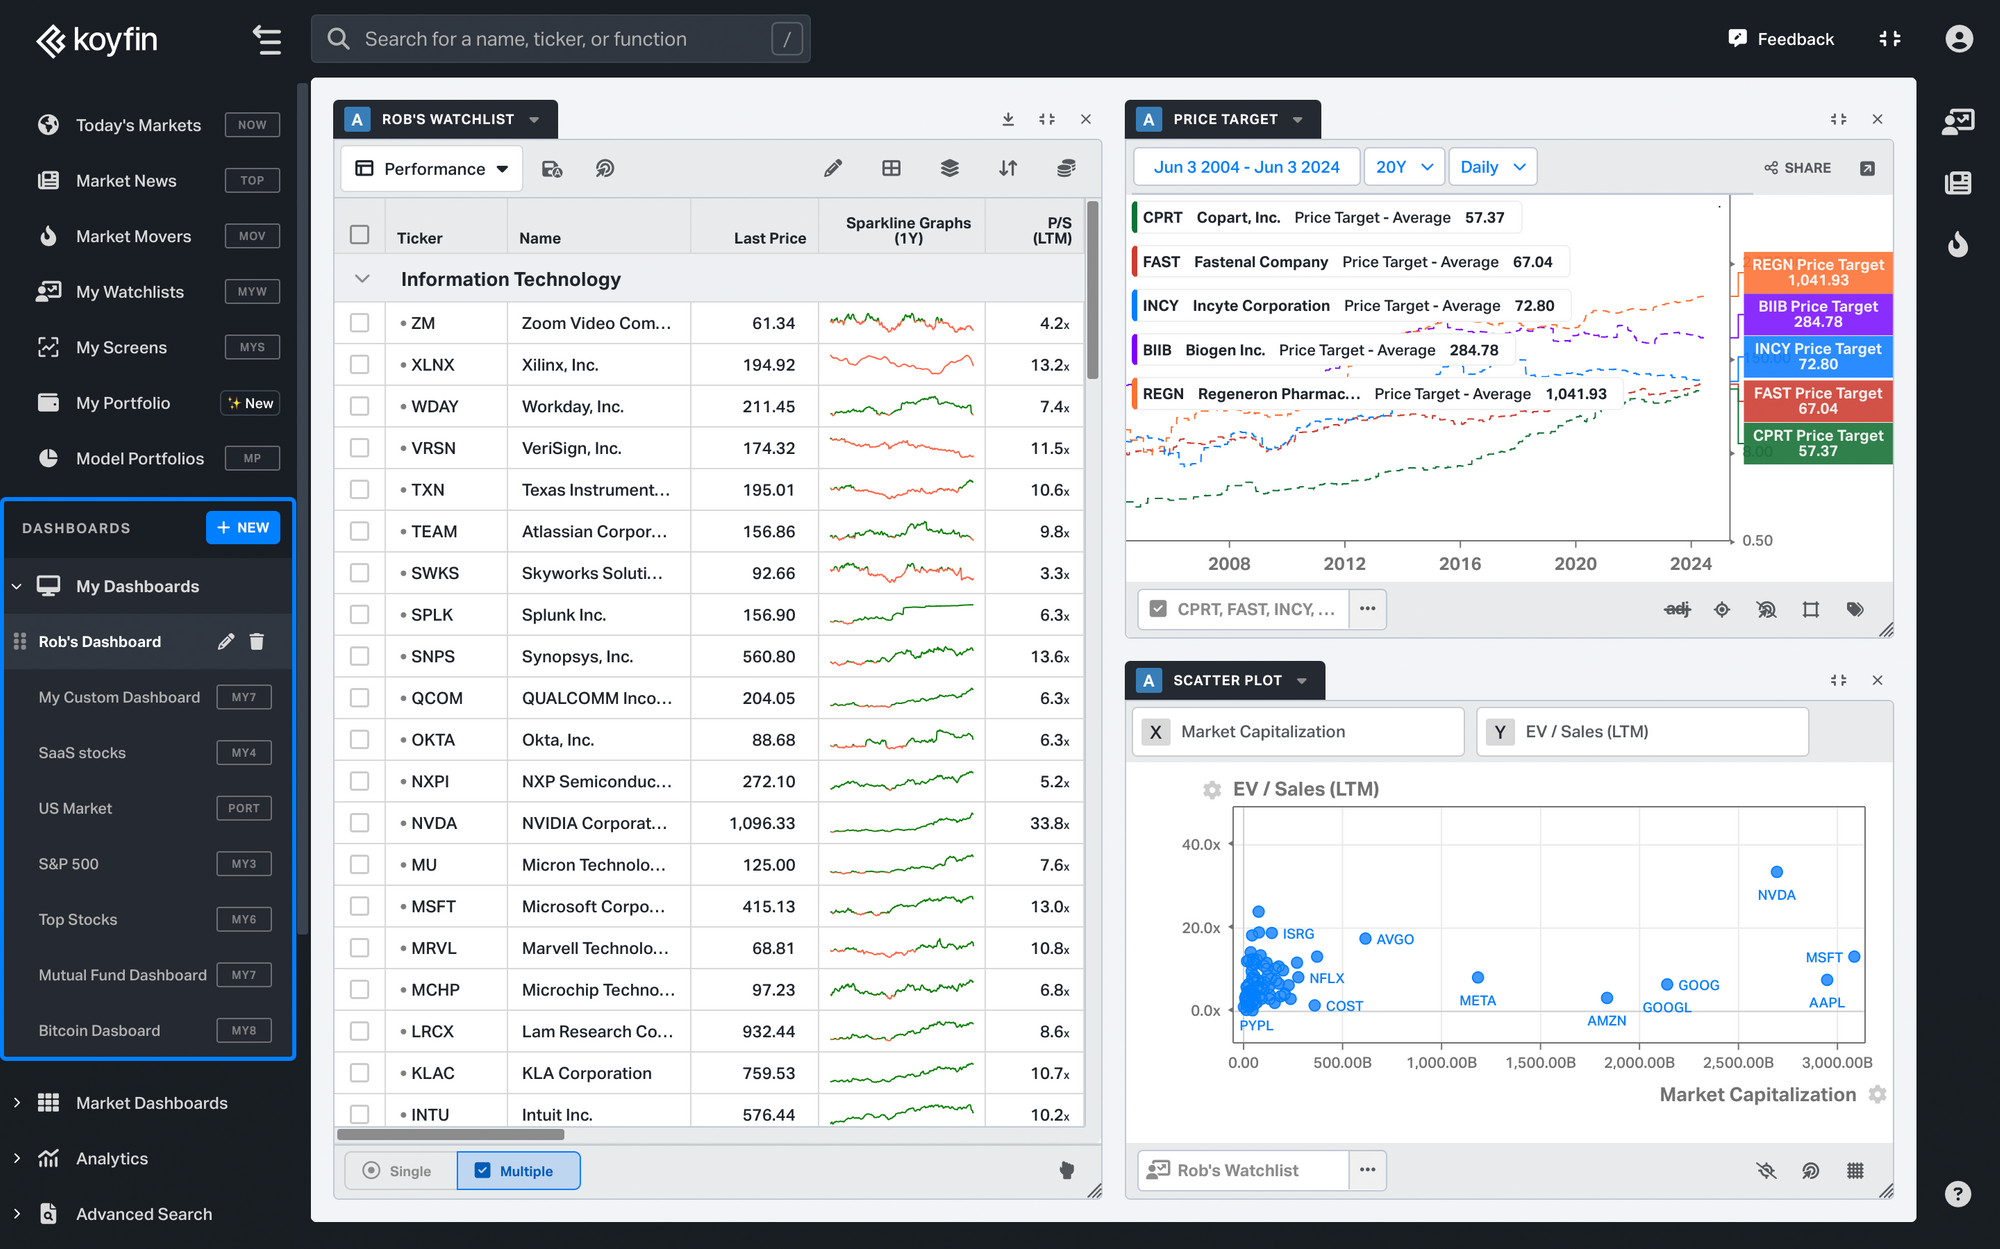
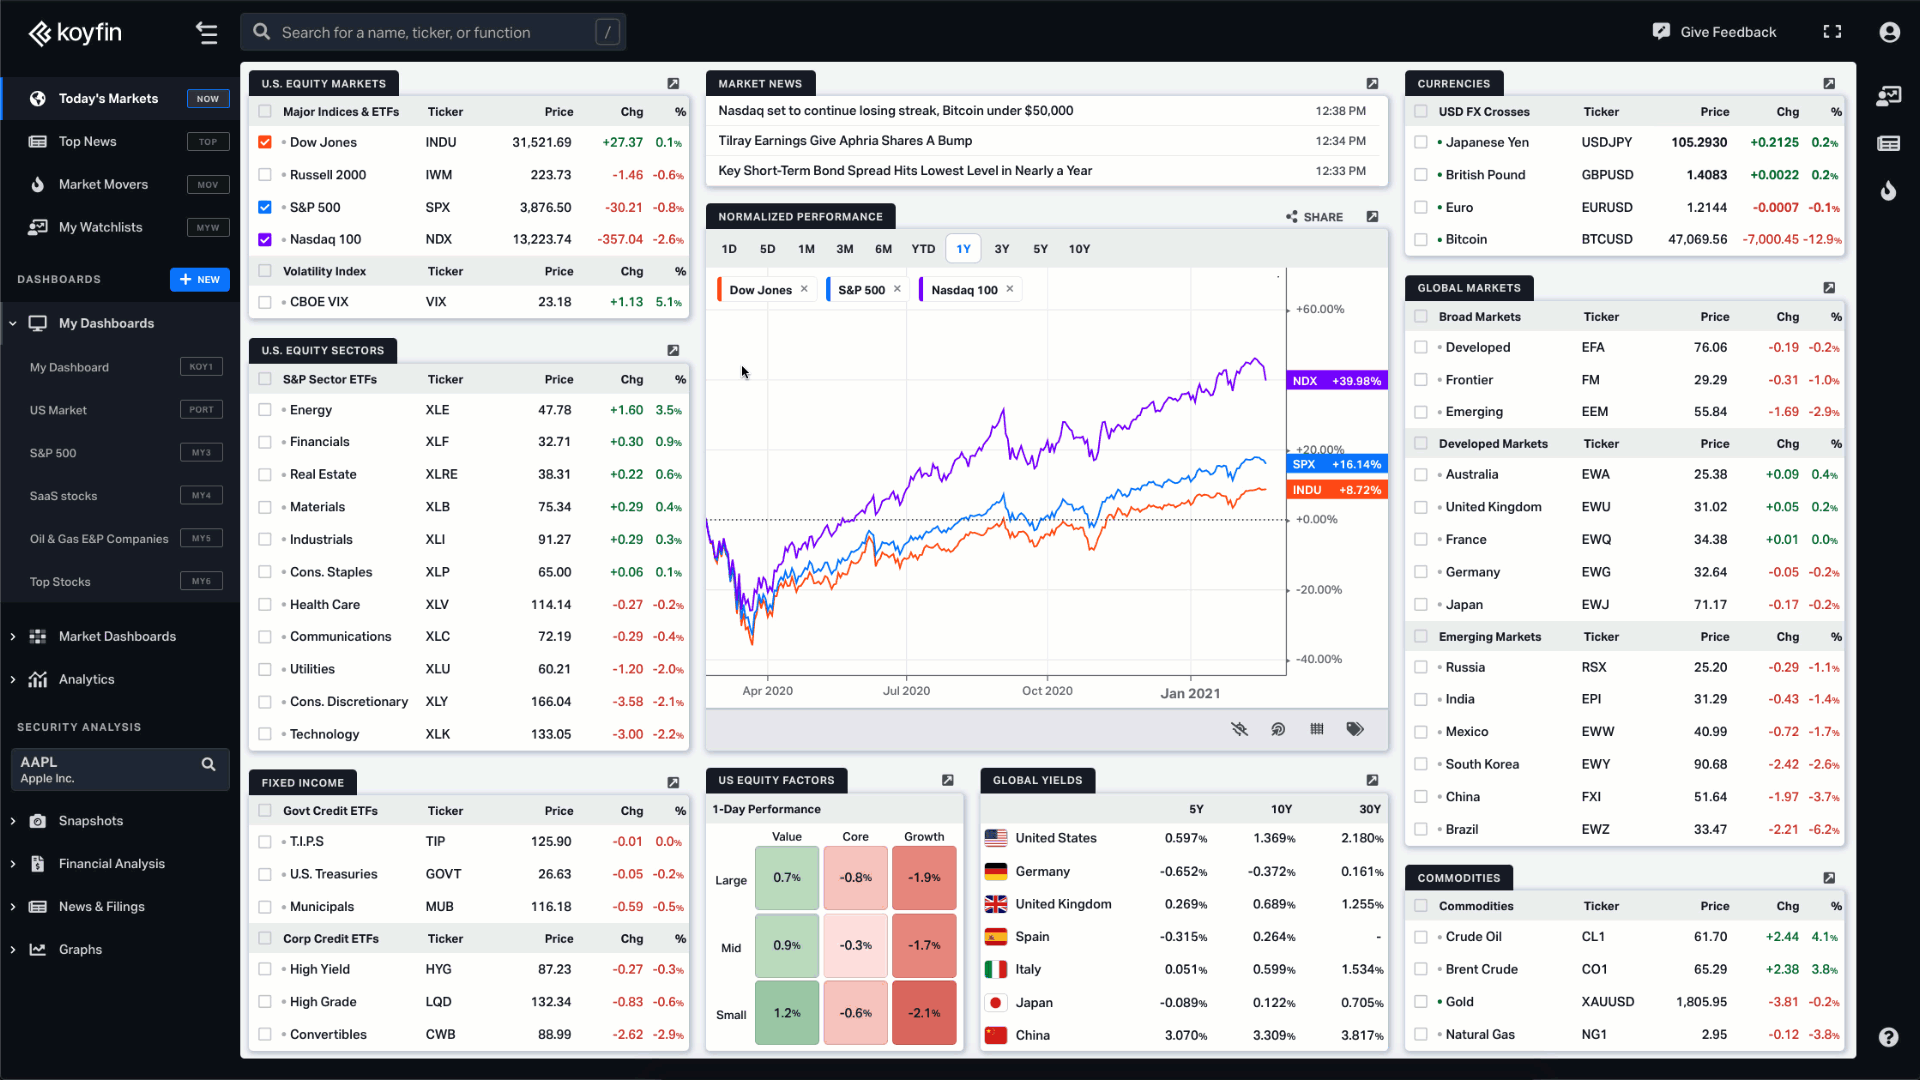
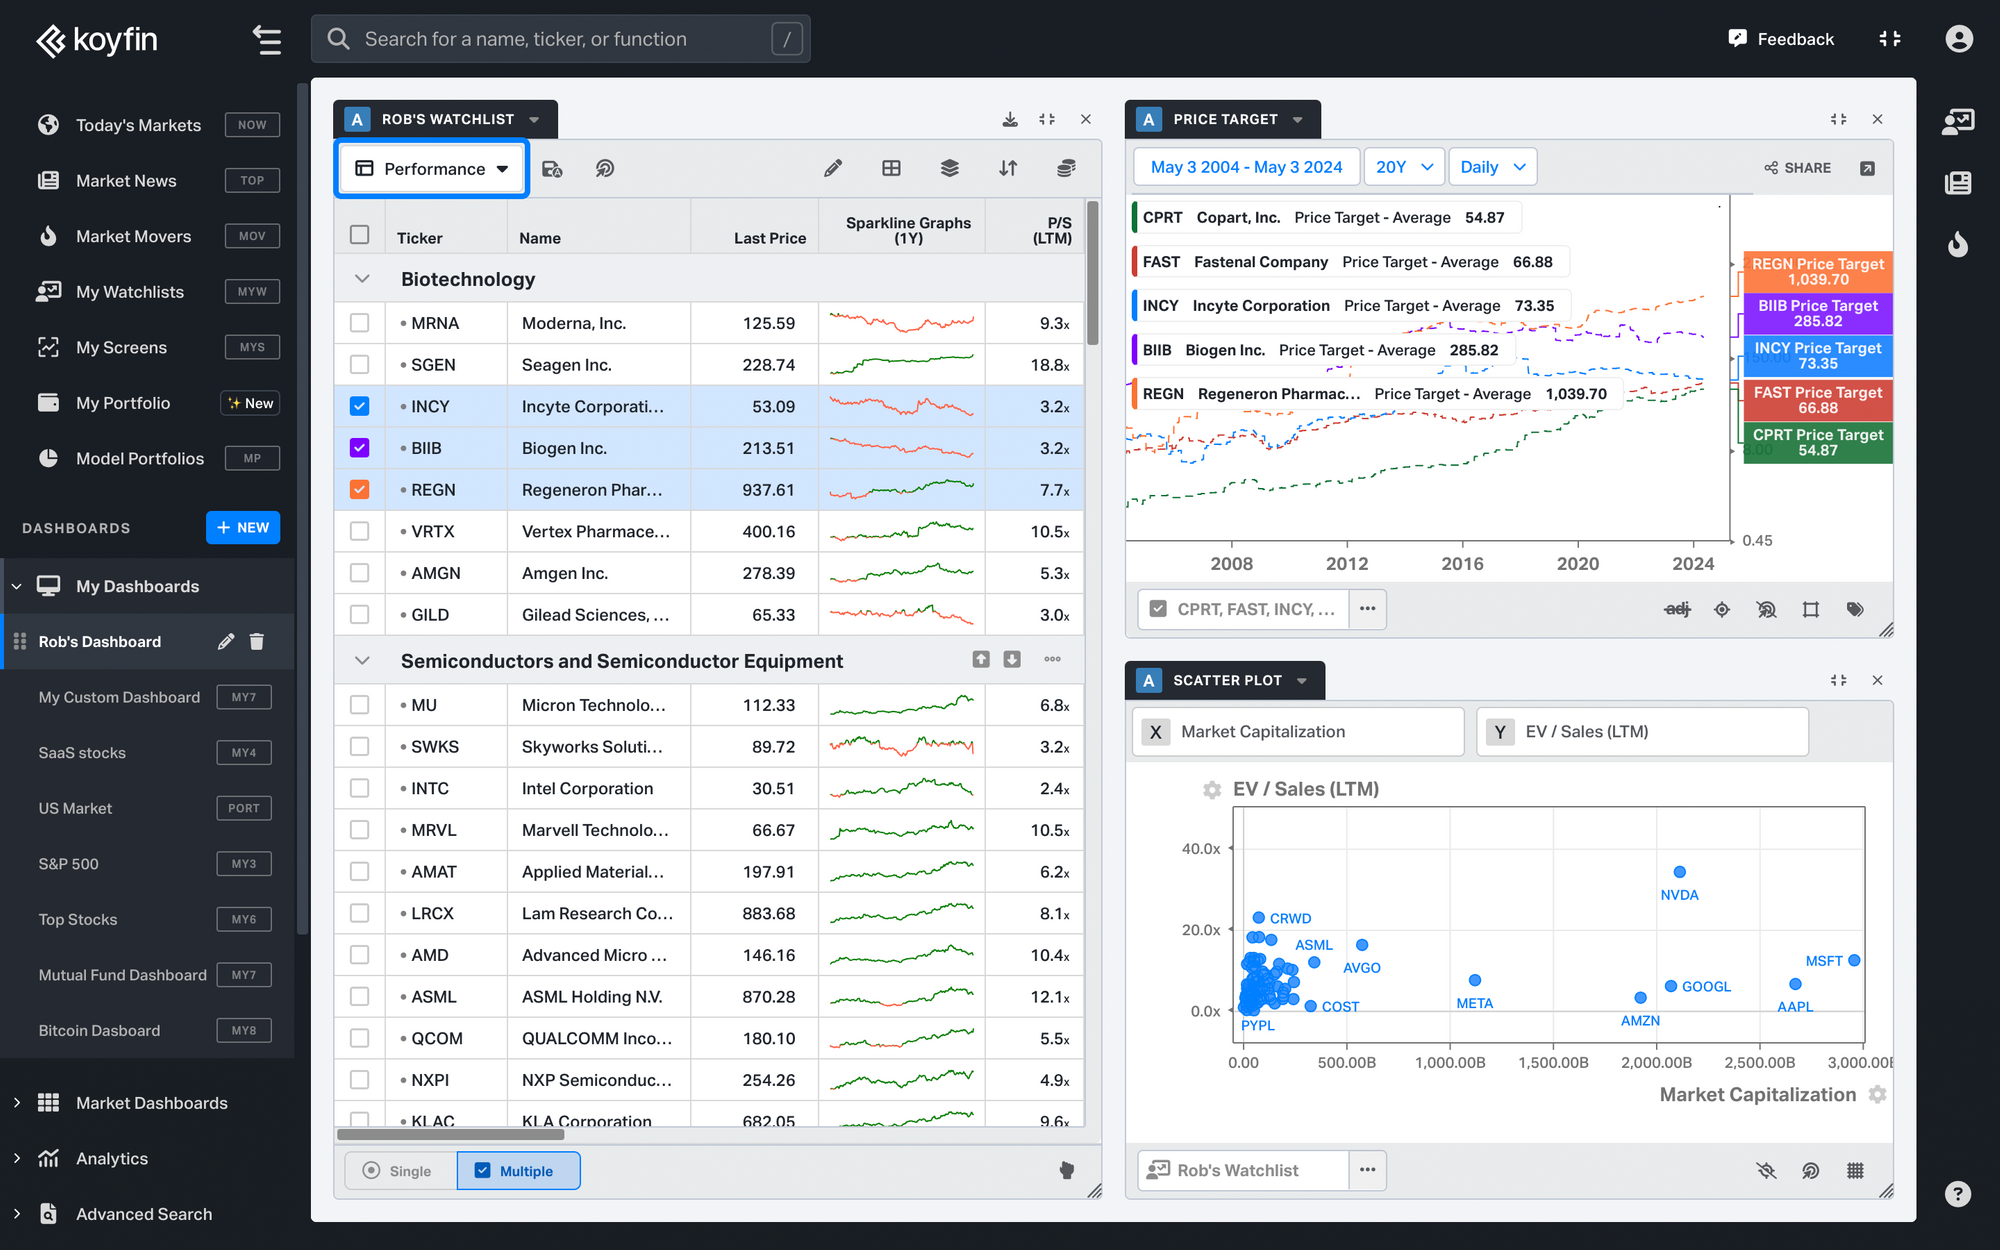
You can create a customized dashboard that contains different widgets including a watchlist of stocks (or other securities), charts, or news.
You can create you dashboard here.
To create a new dashboard, use the “Create New” button in the left sidebar under My Dashboards. You can create a blank dashboard to start adding widgets, or you can load a customized template with widgets selected.
Once you create a blank dashboard, you can add widgets by clicking in the blank space. The widgets are resizable and you can drag widgets around in the dashboard.
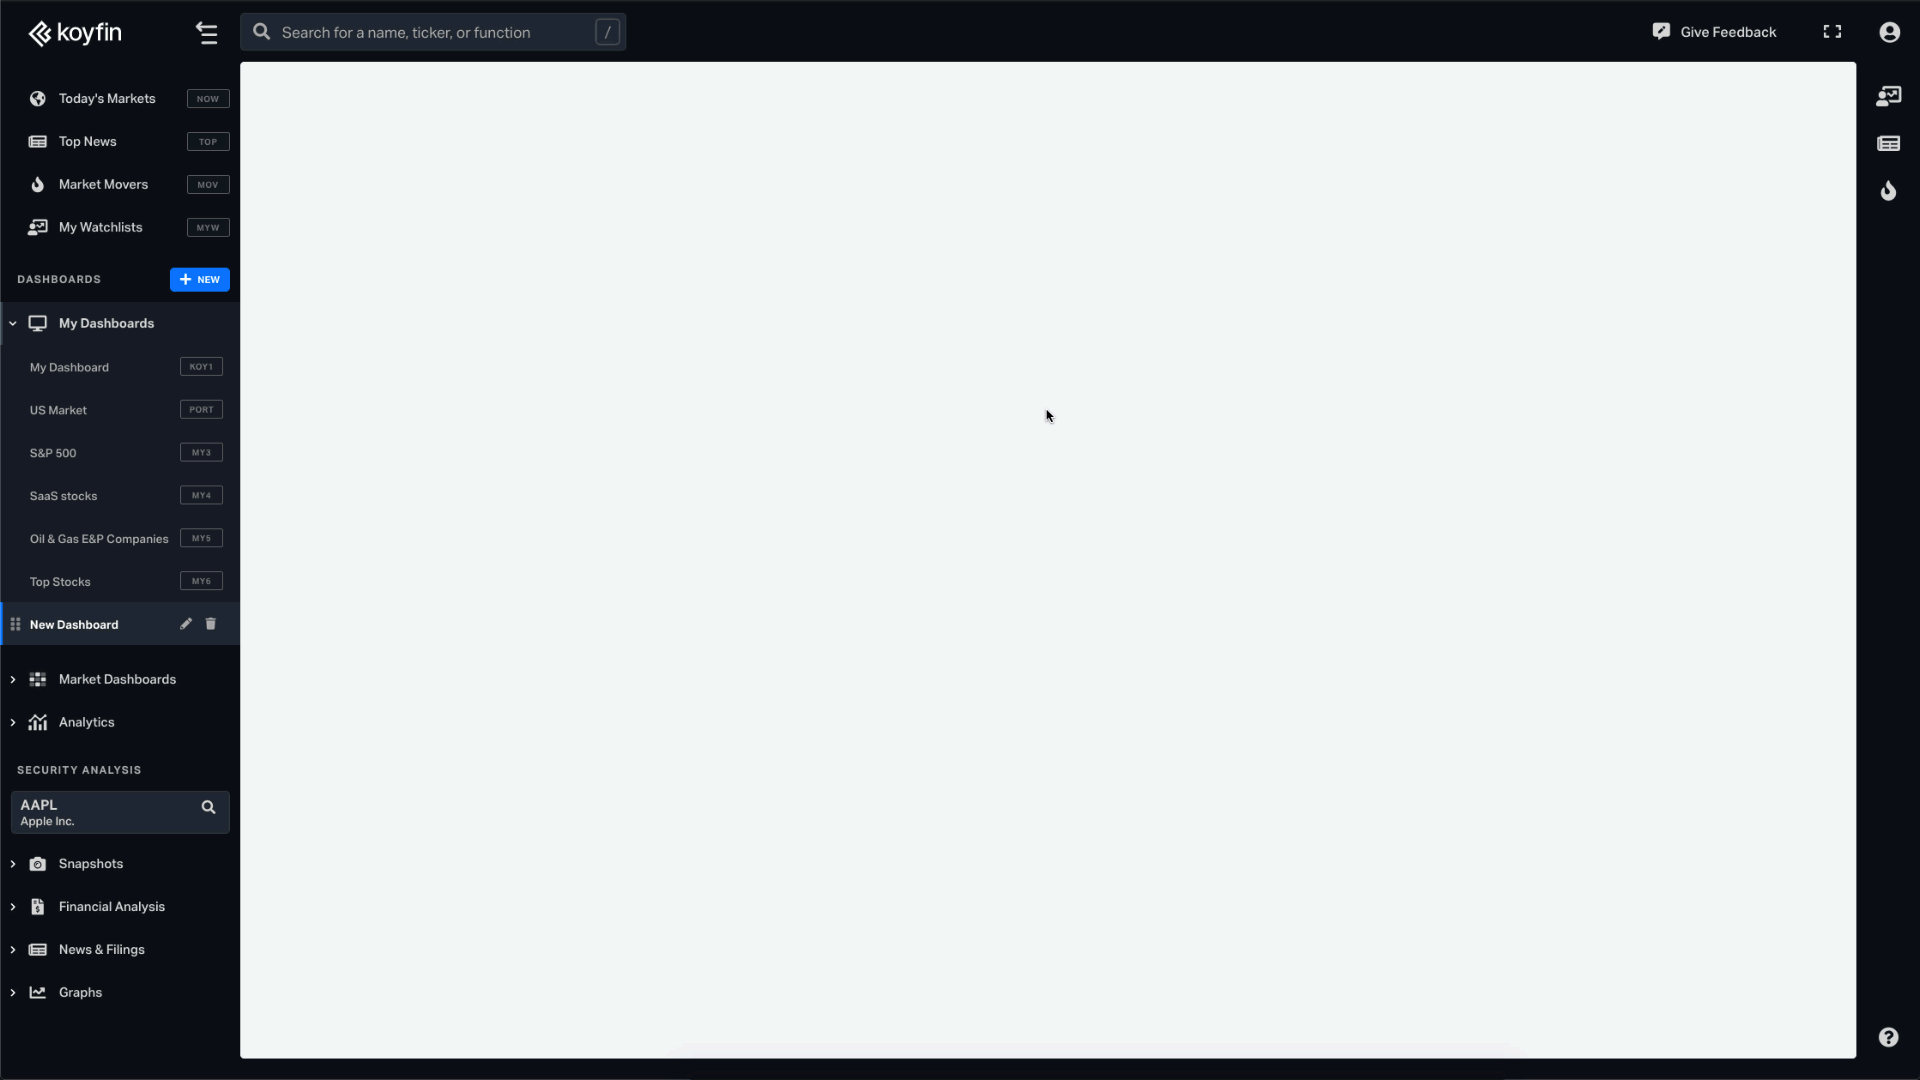
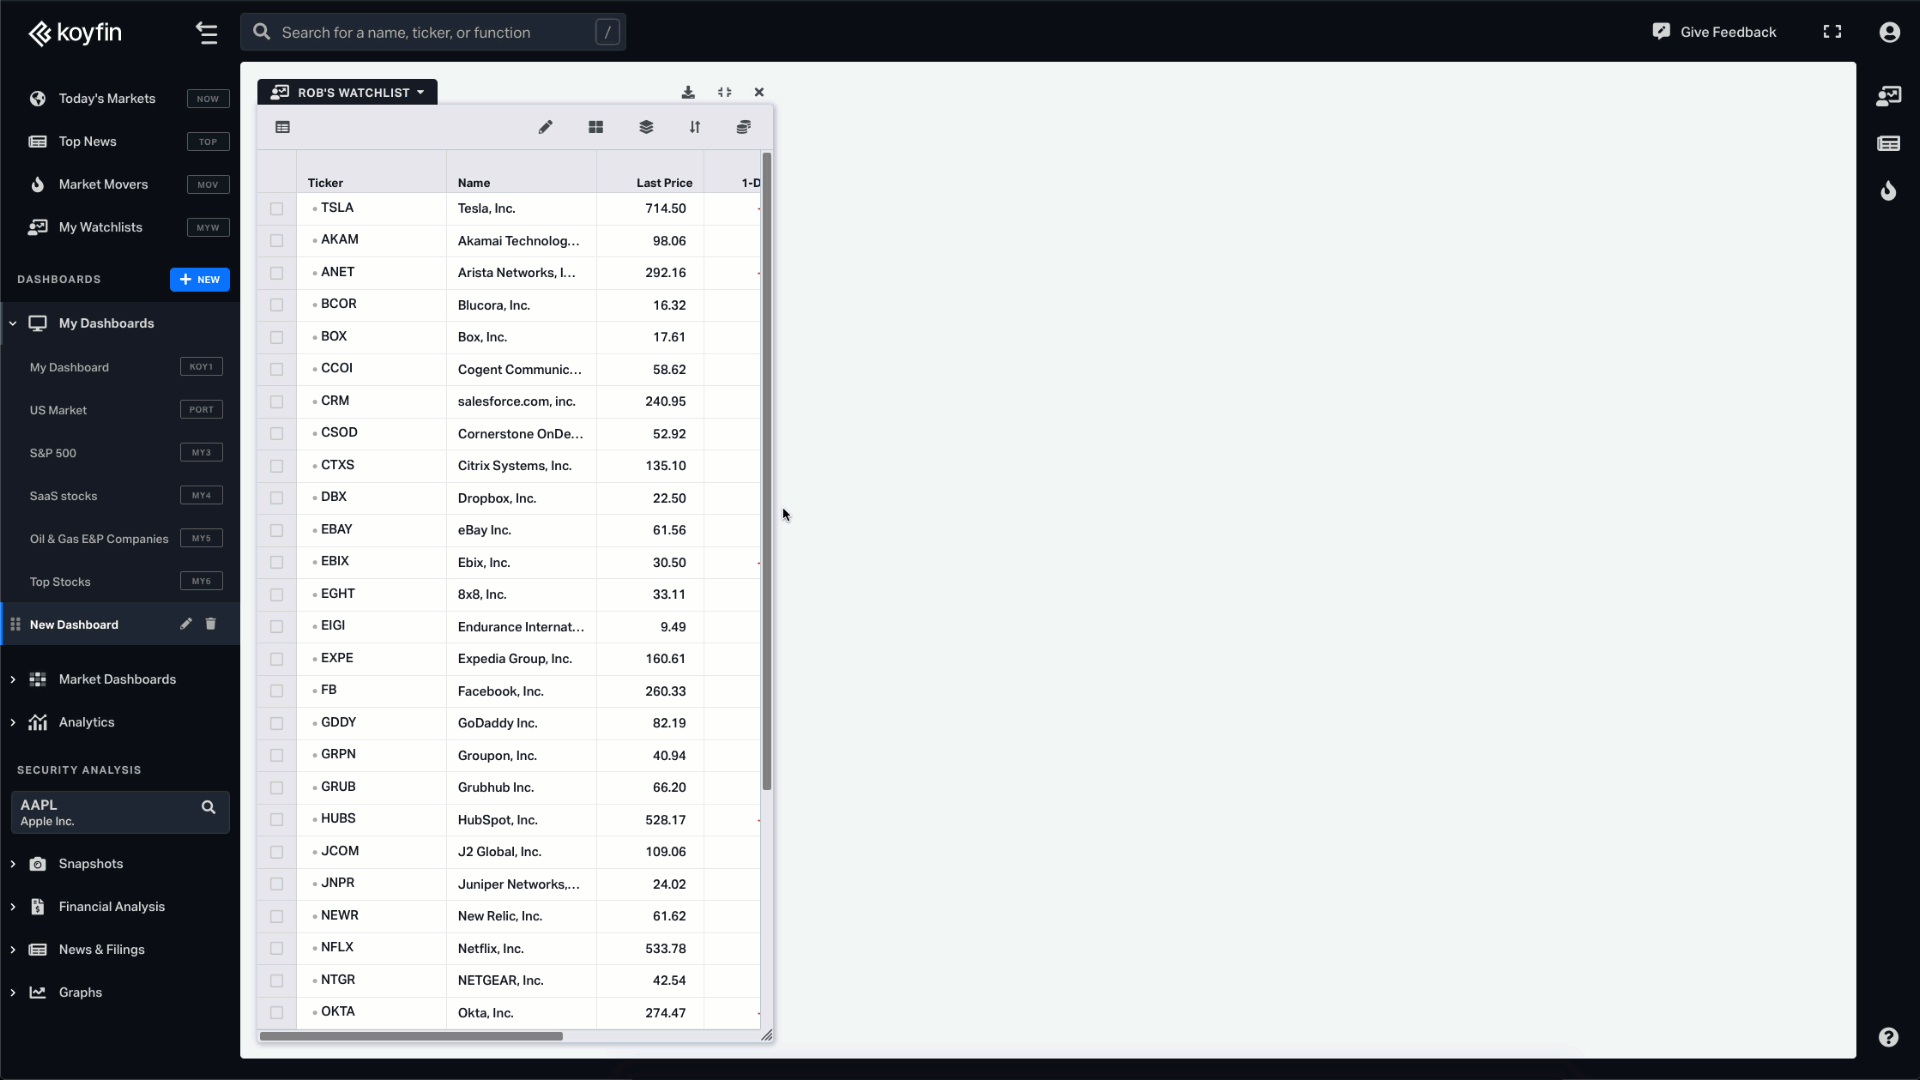
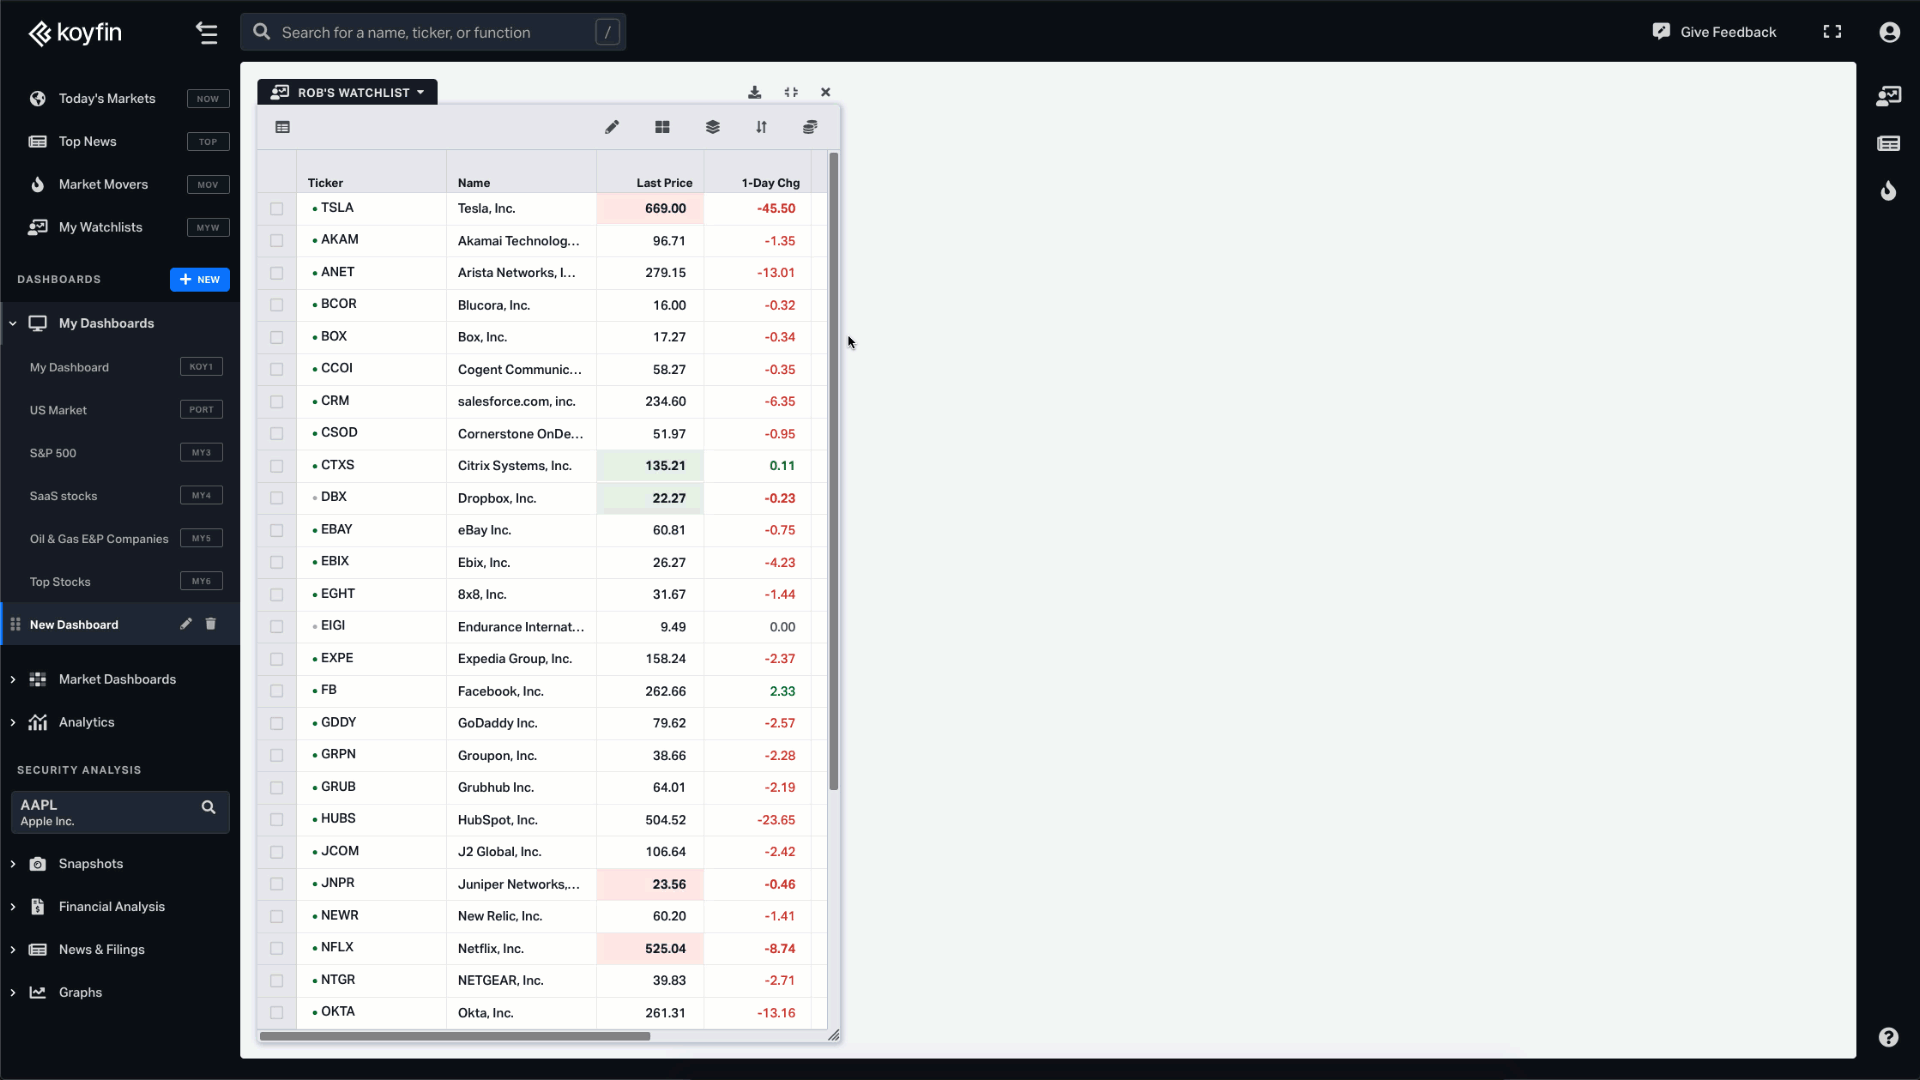
Table / Watchlist
The table widget contains a watchlist which is a list of securities like stocks, ETFs, Mutual Funds, fx, economic data or any other data series on Koyfin. You can read more information in the My Watchlists help page.
Inside a table widget, a template is a saved selection of columns, groups, sort and summary rows. You can load a template into a table widget (which will overwrite the existing columns), or you can save the current table as a new template.
Explore further insights on table views in detailed help article.
Historical Graph
The historical graph widget displays the historical price or you can load one of your graph templates into the widget. You can create or edit a graph template in the G Graph function. To change the loaded security in the graph, drag a ticker from your table into the graph.
Check out this article to learn more about the Koyfin charts.
Performance Graph
The performance graph shows the cumulative % change since the first day on the graph. For example, you can see the % change over the past one year, or YTD.
When dragging a ticker into the performance graph, you can either replace the tickers in the current graph, or add the ticker to the current selection. The toggle for add/replace is at the bottom of the graph.
Additionally, we’ve added an enhanced functionality called My Dashboards Grouping which allows you to link the widgets together so that you could communicate changes easier between the components within the same group. My
My Dashboards Groups
Dashboards grouping functionality allows you to link the widgets together by assigning 1 of 7 color groups to any dashboard component. These groups help components within the same group to communicate changes easier. Check out this article to learn more about the MYD Groups feature.