We're thrilled to introduce My Portfolio to Koyfin. This powerful new feature allows users to build a portfolio and track current holdings. Users can manage multiple accounts and track purchase date, quantity and average cost, as well as individual lots.
My Portfolio combines all holdings and displays P/L breakdowns by lot and parent, converted into a single portfolio currency and includes the impact of FX rate changes over time.
Investors can analyze the P/L of their portfolio, view exposure exhibits, and create views to fundamentally analyze their positions.
My Portfolio introduces many new concepts and features to Koyfin. This article will help you get started, and break down the feature.
The Plus and Premium plans offer full My Portfolio functionality, while the free plan offers limited functionality; where users can populate a single account.
Creation & Ongoing Management
Start building a portfolio by choosing a portfolio currency and adding your current holdings; either as aggregate or lot-level positions. Enter the ticker and add quantity, cost, and purchase date.
Add new lots to existing positions using the "+ Add Lot" button.
Portfolio Currency: The portfolio's domestic currency. All positions, their market values and P/L, will be converted to the portfolio currency.
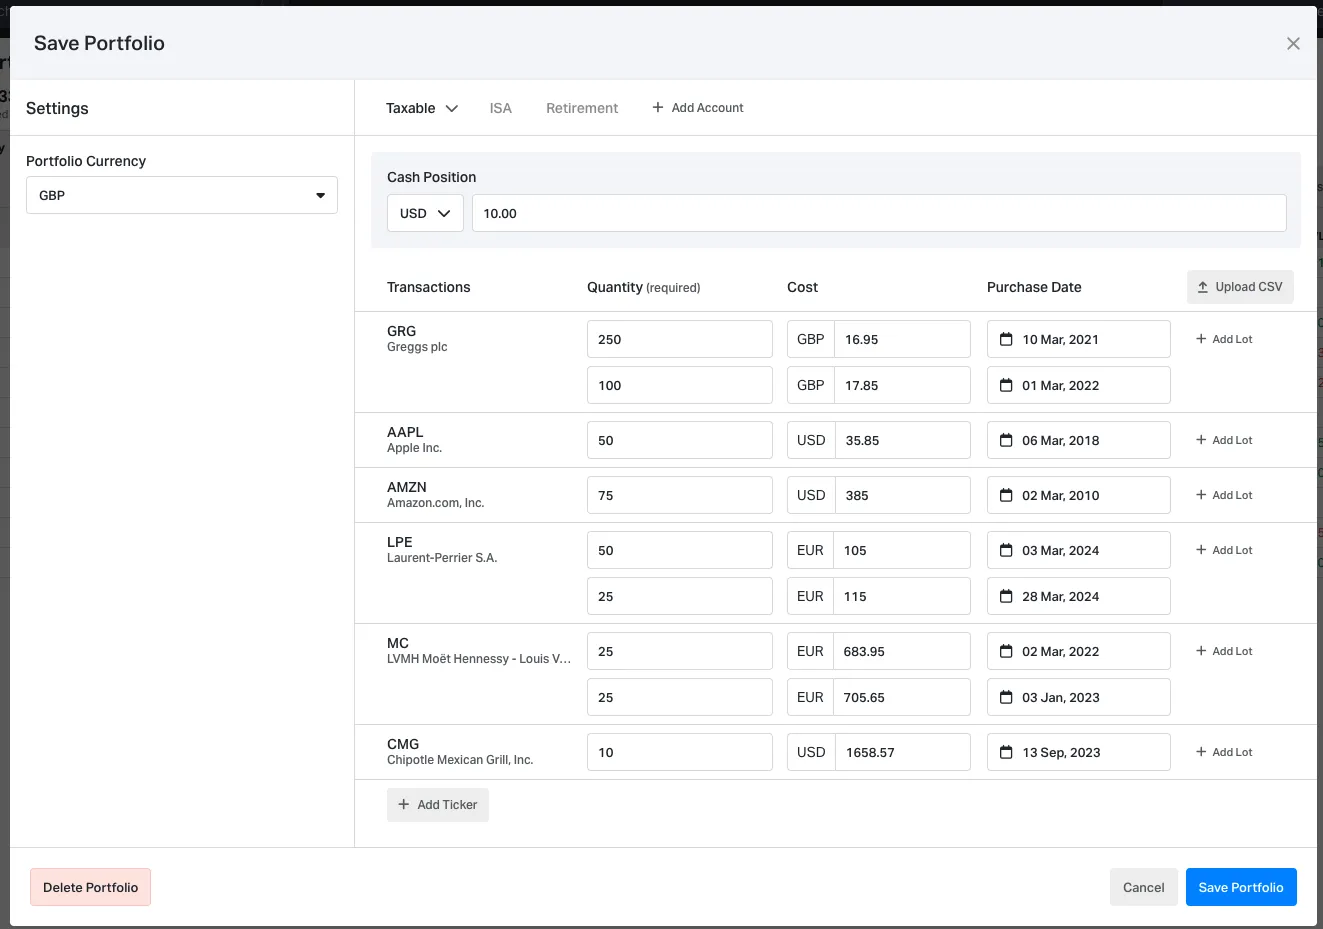
If you have several portfolios in different accounts, use the "+ Add Account" button to populate a new account. You can populate accounts manually or upload a CSV that includes the ticker or ISIN, quantity, purchase date, and cost.
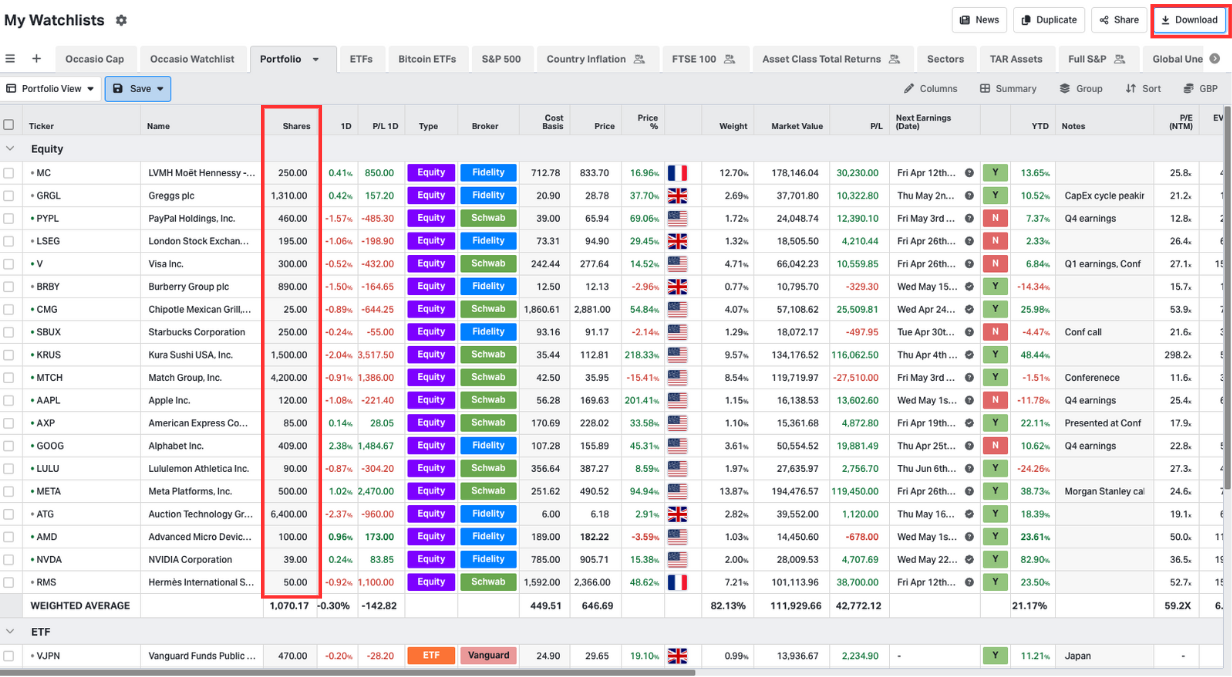
If you track a portfolio in a Koyfin Watchlist, you can download a CSV with the download button and upload it to My Portfolio. Once satisfied, you can click the "Create Portfolio" button to have My Portfolio compile the data.
Note: Our data vendor, Capital IQ, restricts certain data from being downloaded. Metrics such as equity financials, valuation, estimates, and growth rates cannot be exported.
You can return to this edit dialogue anytime by clicking the "Edit Portfolio" button in the top right-hand corner of the screen.
Profit / Loss
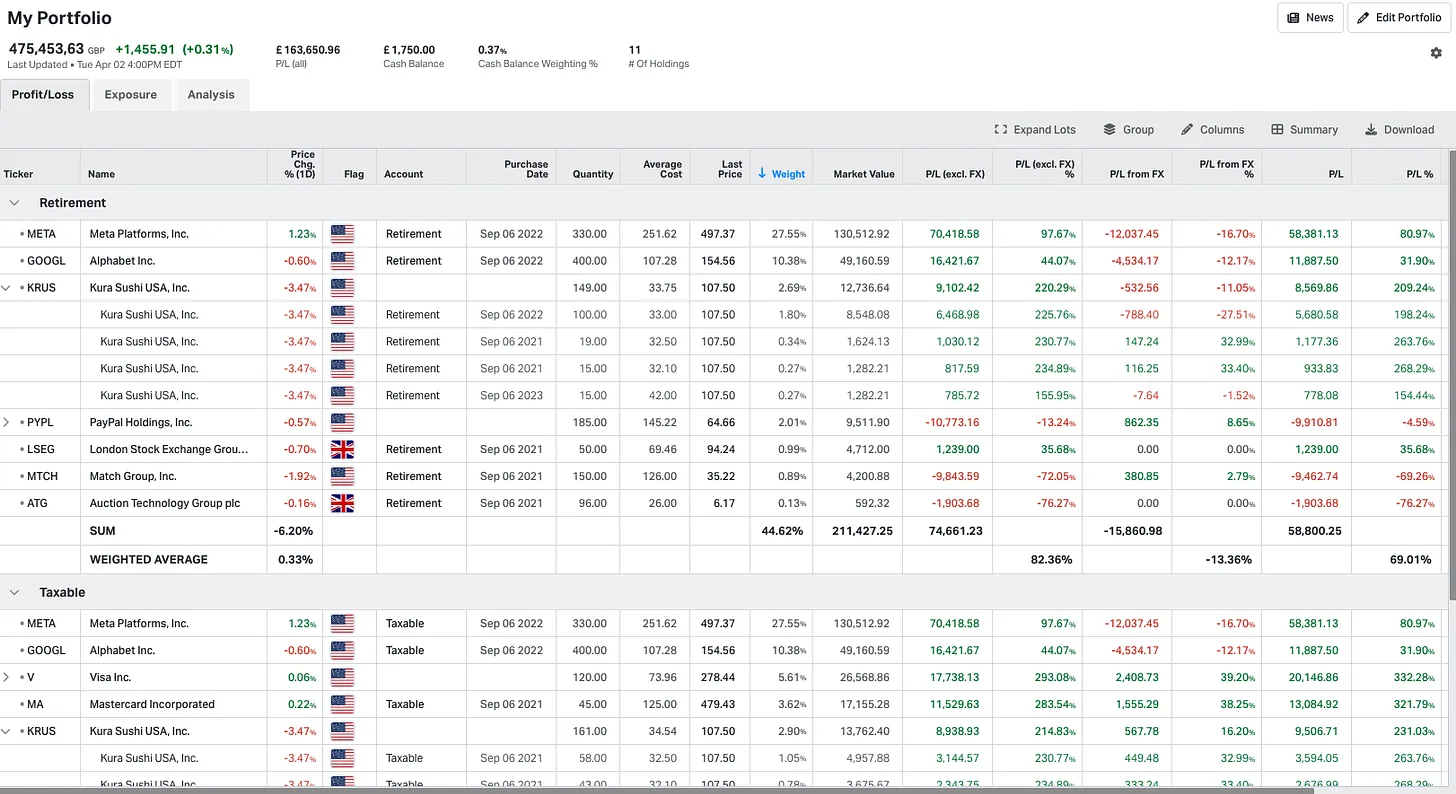
Profit / Loss is where Koyfin presents lot-level data, P/L, account aggregation and grouping, as well as security-level and performance-related data.
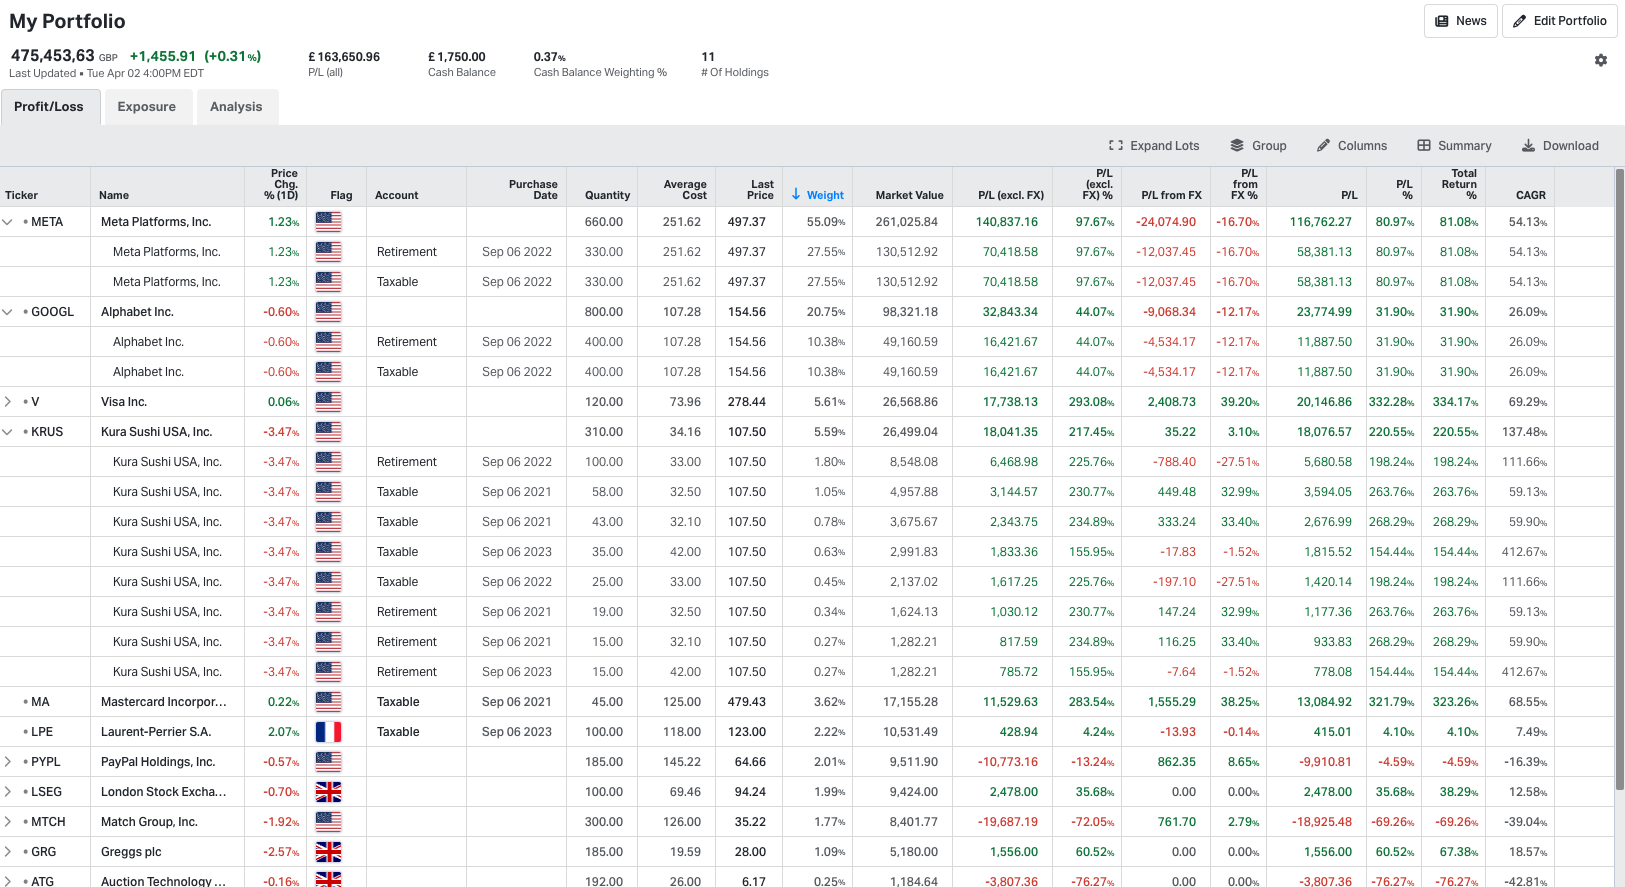
The Profit / Loss tab introduces an array of new data series to Koyfin, such as P/L, FX-adjusted P/L, and Total Return.
Lots
To see lots, click on the chevron to the left of a ticker with lots. Alternatively, the "Expand Lots" button on the top right will expand all lots. By adding lots to the creation form, users can see both the aggregate and lot-level data, including P/L, for each of their investments.
All lots, including those present across multiple accounts, will be grouped under the parent position.
Account Grouping
When grouping by account, the use of summary rows (like “sum”) will allow you to identify the weighting, market value, and P/L of separate accounts relative to your aggregated portfolio.
Portfolio Currency
With My Portfolio, we introduced the concept of a portfolio currency. This means that any securities you hold in the portfolio will automatically be converted into the portfolio currency. You can add the cost basis of a US-listed stock in USD, for example, and while we present the cost basis in USD, we convert everything (market value, P/L, etc) into portfolio currency.
P/L including & excluding FX
Koyfin has introduced a range of P/L data series to more accurately understand the impact that FX rates have on your P/L if you invest outside of your domestic market.
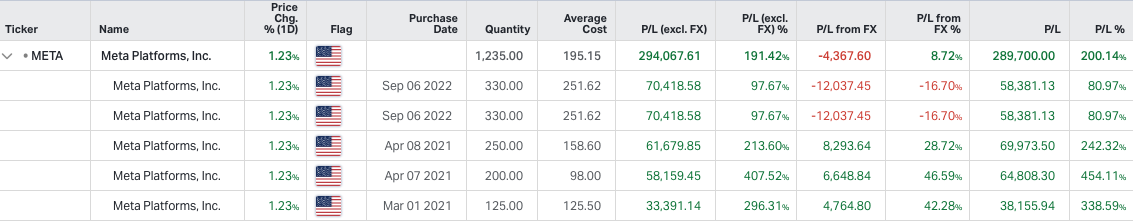
E.g, If a UK-based investor, purchased META (US-listed stock) 5 years ago, they likely made a nice profit on the trade. Over those 5 years, however, the fluctuation between the FX rate of GBP and USD will have impacted the returns and P/L too.
That’s why we introduced three new data series to Koyfin relating to P/L which reflect these FX impacts. Each of these three data series is reflected as both notional and percentage values.
P/L (excl. FX): The notional profit or loss from an investment, converted to the portfolio currency at the most recent FX rate.
- You can think of this as solely the “security-level” P/L.
P/L (from FX): The notional gain or loss from the change in currency conversion since the position was opened.
- This reflects the impact of currency movements throughout your holding period.
P/L: The notional profit or loss from an investment, including the P/L from FX. I.e. after the impact of currency conversion fluctuation.
- You can think of this as the “true” P/L. The amount of cash you would receive (excluding costs) for selling the position in your domestic currency.
P/L = P/L (excl. FX) + P/L (from FX)
In circumstances where the security trades in the same currency as the portfolio, P/L (excl. FX) and P/L will be the same, while P/L from FX will read zero.
P/L items do not include the impact of dividends, dividend reinvestments, or brokerage fees. For a deeper understanding of the influence of dividends on your returns, we recommend using the Total Return data series, explained below.
To produce these data outputs, you must add a purchase date for each position so we know the FX rate at the purchase date.
Lot Aggregation
When a position has multiple lots, Koyfin calculates the parent-level P/L % as a weighted average of each lot’s individual return, rather than simply taking the return on the weighted average cost.
This ensures each lot’s performance is reflected in proportion to its size, which is the industry standard for portfolio reporting.
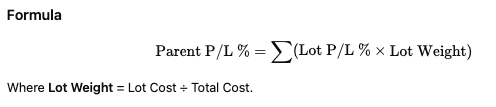
We use our method for lot aggregation because it more truly aligns with the performance of each lot, especially when purchase prices vary. This is the industry standard method of reporting. The simpler method (return of weighted average cost) effectively assumes the position was made as a single purchase at the average cost, which isn't necessarily true.
Total Return
When purchase dates are entered for the position, Koyfin calculates the total return which includes dividends.
The Total Return % data series includes the impact of FX changes over time for positions that trade in a currency that is different from the portfolio currency.
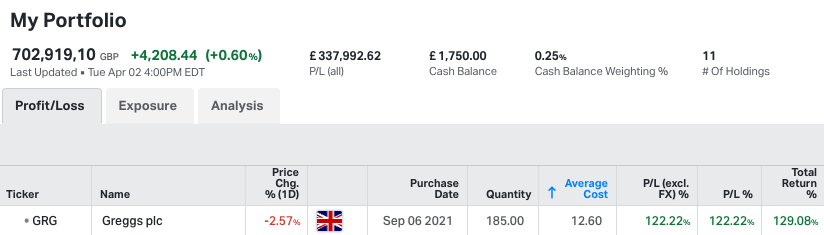
In the above example the portfolio, based in GBP, holds Greggs, a UK company. Therefore, the FX impact is null; hence why P/L (excl. FX) and P/L are identical. The company pays dividends, however, and this is now reflected, as per the purchase date, in the Total Return field.
Something to note, however, is that total return assumes the reinvestment of every dividend, while price return ignores them completely. If the company has never paid a dividend, the price and total return will be identical. If the company has paid dividends, the total return will be greater. As an investor, it’s unlikely your true return % reflects either of these metrics perfectly. You might not reinvest every dividend into that same company, so your true return is likely somewhere between price and total return if the company pays dividends.
Nonetheless, having both data series at your disposal provides you with more context and understanding.
Exposure
On the exposure page, you can see your portfolio broken down into pie and table forms across various categories such as securities, sectors, industries, asset classes, and countries.
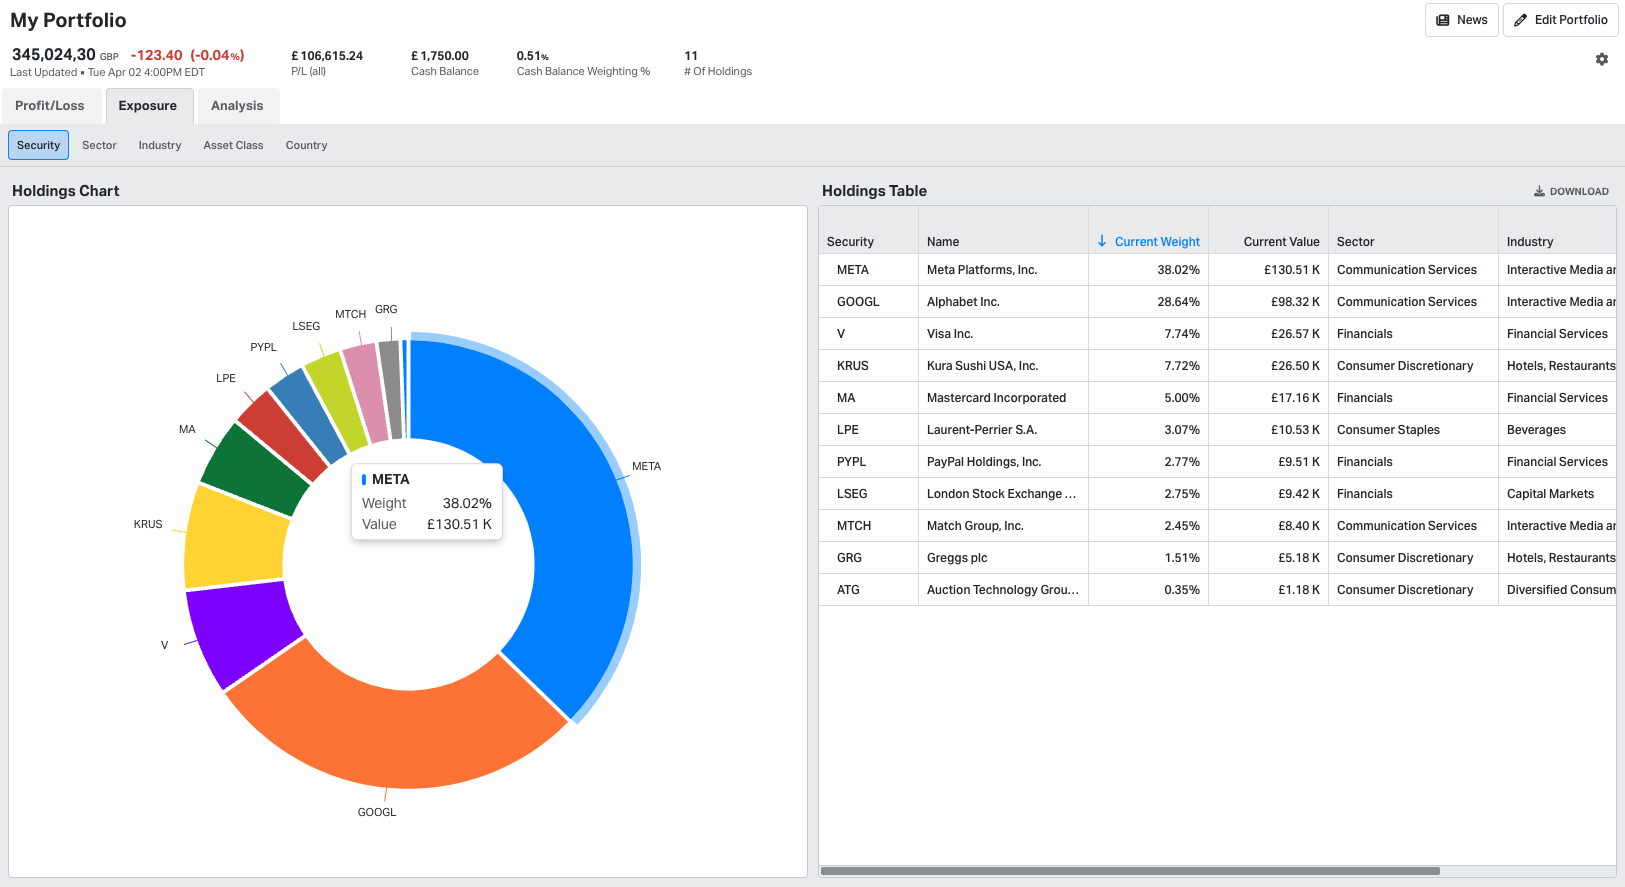
We created a custom, interactive, pie chart for this feature. Hover over any segment of the pie to see more data.
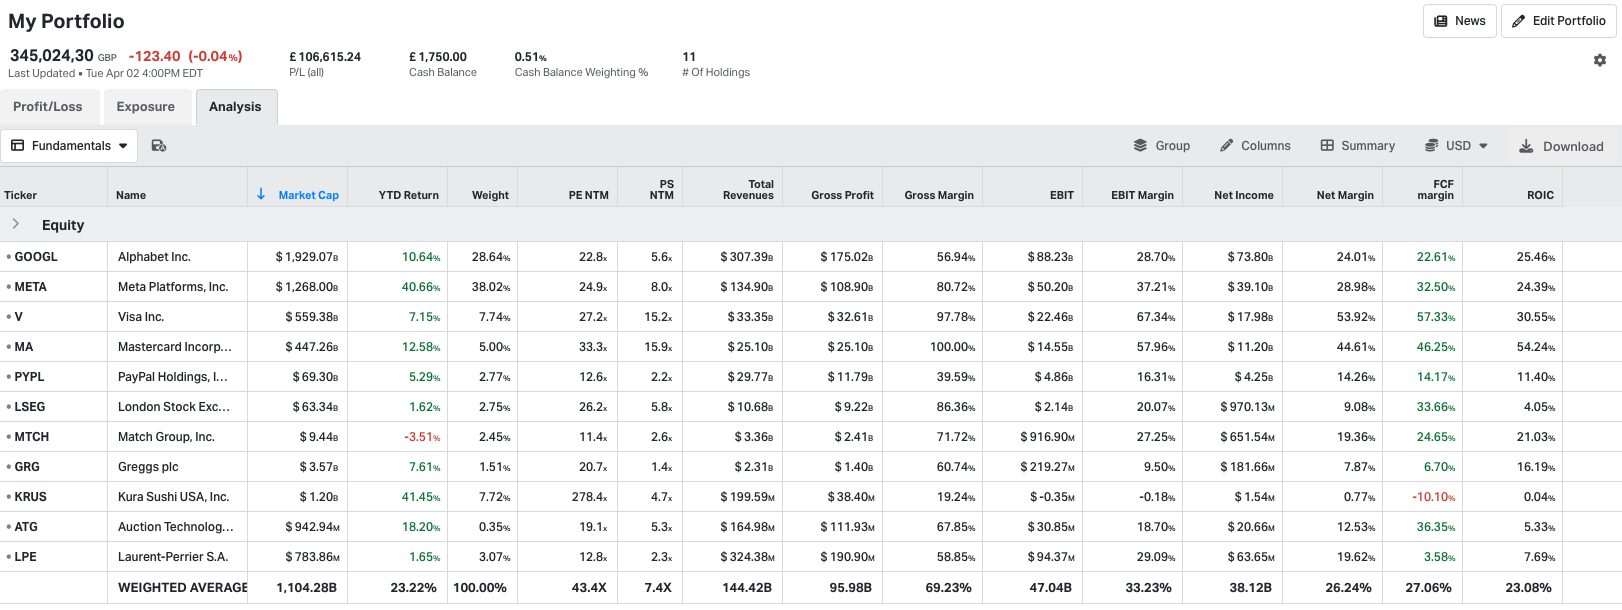
Analysis
The analysis section will be the most familiar to regular Koyfin users. Similar to the Watchlist, the Analysis table is the place where Koyfin users can conduct more fundamental and valuation-centric analysis; with a full library of columns to choose from. This table will be pre-populated with your portfolio companies, where you can use summary rows like “portfolio weighted average” to show the weighted average multiples or margins of your portfolio.
Analysis also allows users to utilise a library of different views, which they can cycle between seamlessly. For users who have spent time creating views inside of Watchlists, fear not. Because views from Watchlists can be imported to the Analysis table.
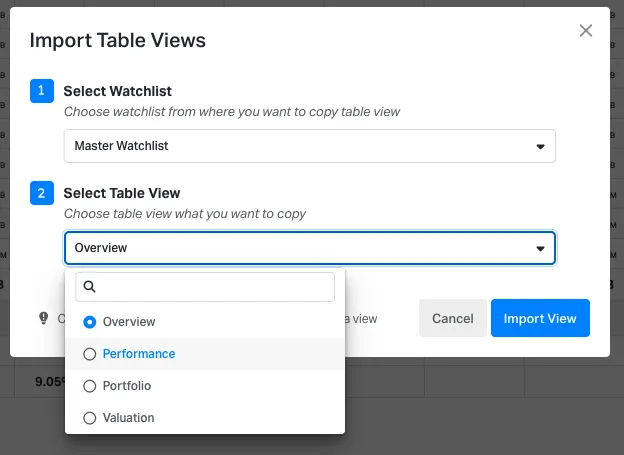
In the Analytics Views window, hit "+ New" followed by "Import Table Views" to import existing views from Watchlists.
Explore further insights on table views in detailed help article.
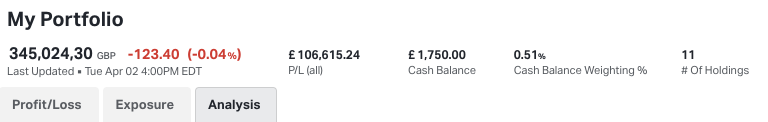
Quotebox
The quote box at the top of the screen displays the market value of the portfolio, the 1D change, number of holdings, cash, cash weighting, and P/L of the portfolio and will tick away during the day.
Check out this video demo to see how the get the best out of model portfolio: