
Insider trading and ownership data is now available as columns and filters in Screener and Watchlist. The new Insider Ownership category includes insider buying and selling over the past 1, 3, 6, and 12 months expressed as a number (e.g 5 buy transactions), shares (e.g 50,000 shares traded), uniques (e.g 3 unique buyers), and as a ratio (e.g buyer/seller ratio of 1.5).
The level of insider and institutional ownership concentration is also now available as a selectable metric.
Adding the columns
- Open the column picker in Screener or in Watchlist.
- Select Insider Ownership, below Analyst Estimates and above Percentile Ranks.
- Expand a subcategory and select the fields you want.
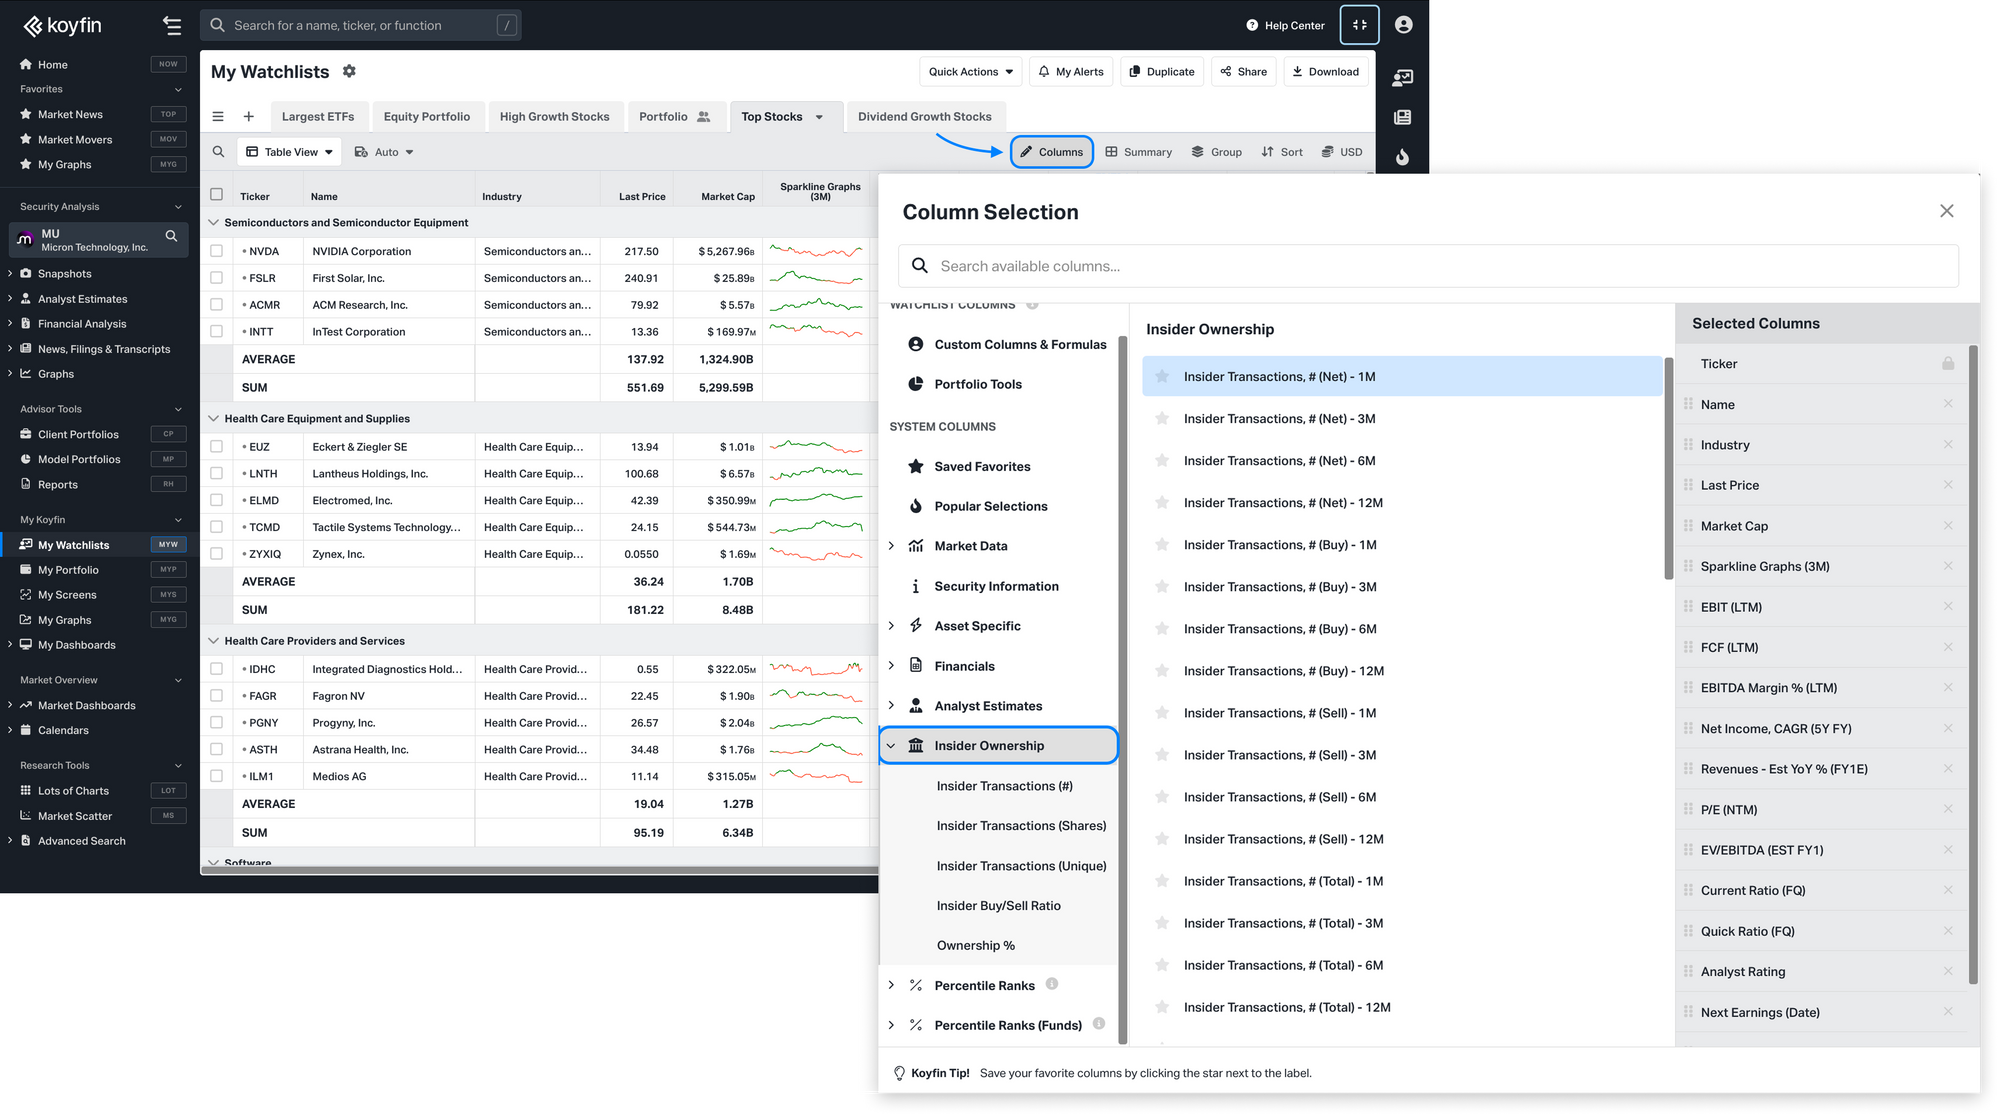
What each subcategory covers
- Insider Transactions (#): Number of insider trades, broken down by buys, sells, net, and total over 1, 3, 6, and 12 months.
- Insider Transactions (Shares): Number of shares traded by insiders, with the same breakdowns and time periods.
- Insider Transactions (Unique): Number of individual insiders who traded, rather than the number of transactions. Available for 1 and 3 months.
- Insider Buy-Sell Ratio: Shares bought compared with shares sold over 1, 3, 6, and 12 months. A ratio above 1 means insiders bought more shares than they sold.
- Ownership %: Percentage of market cap held by the top 5, 10, and 20 insiders or institutions.
Net and total transaction figures are shown in green when positive and red when negative.
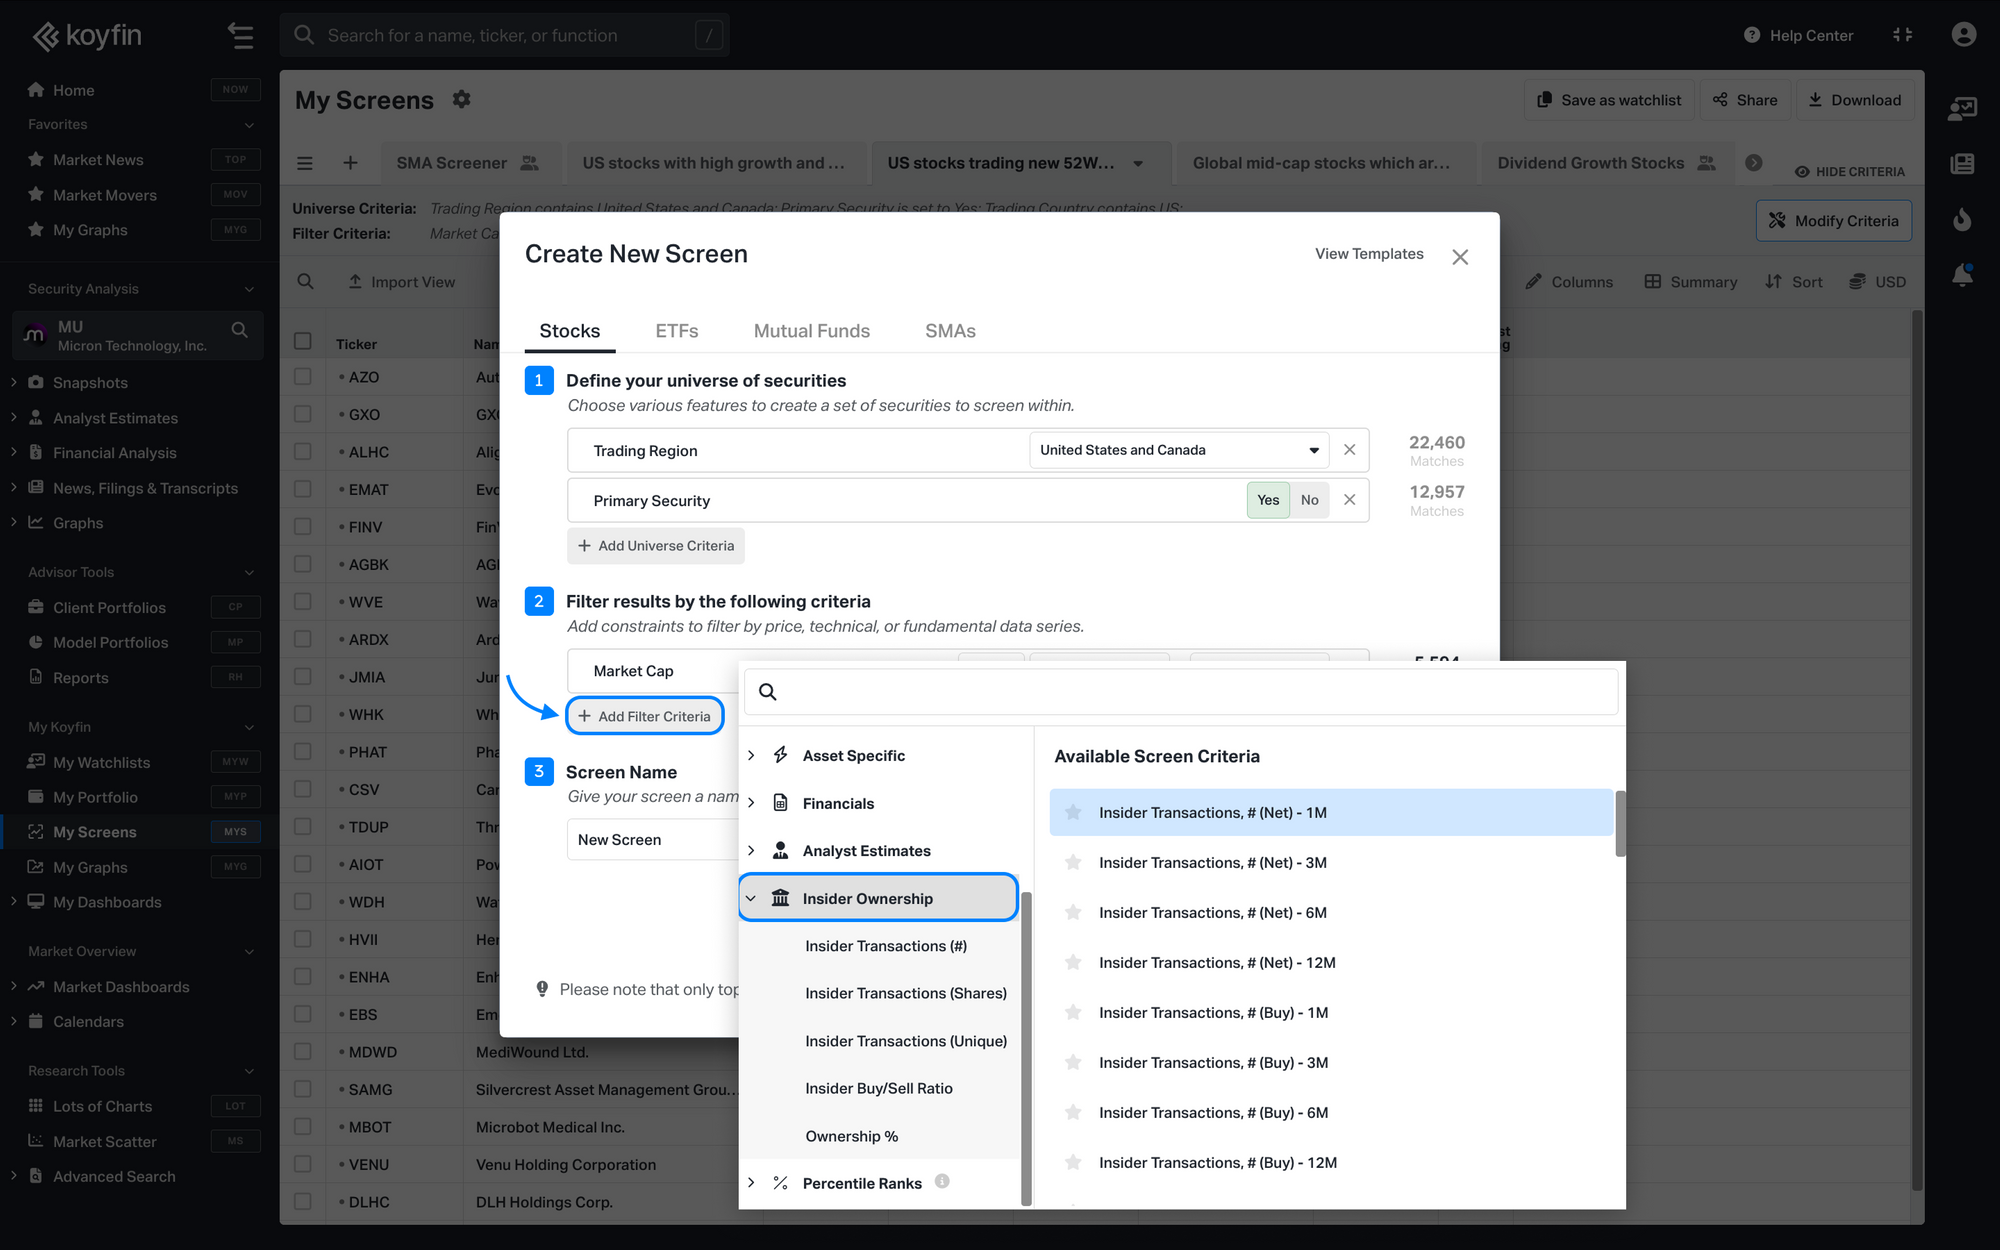
Filtering in Screener
Every Insider Ownership field can be used as a filter in Screener. Transaction counts, share counts, and the buy-sell ratio can be filtered by a numerical range, while Ownership % fields can be filtered by a percentage range.
Coverage
The data is global and supplied by Capital IQ.
Plan availability
Insider Ownership fields are available on Plus and above.