We've introduced a new report type in addition to Standard and One Pager reports: Comparison Reports.
Comparison Reports allow you to compare up to five securities side by side in a single PDF. You can include:
- ETFs
- Mutual funds
- Model portfolios
- Client portfolios
This report format makes it easier to analyze differences in allocation, performance, risk, and exposures across multiple investments.
How to create a Comparison Report
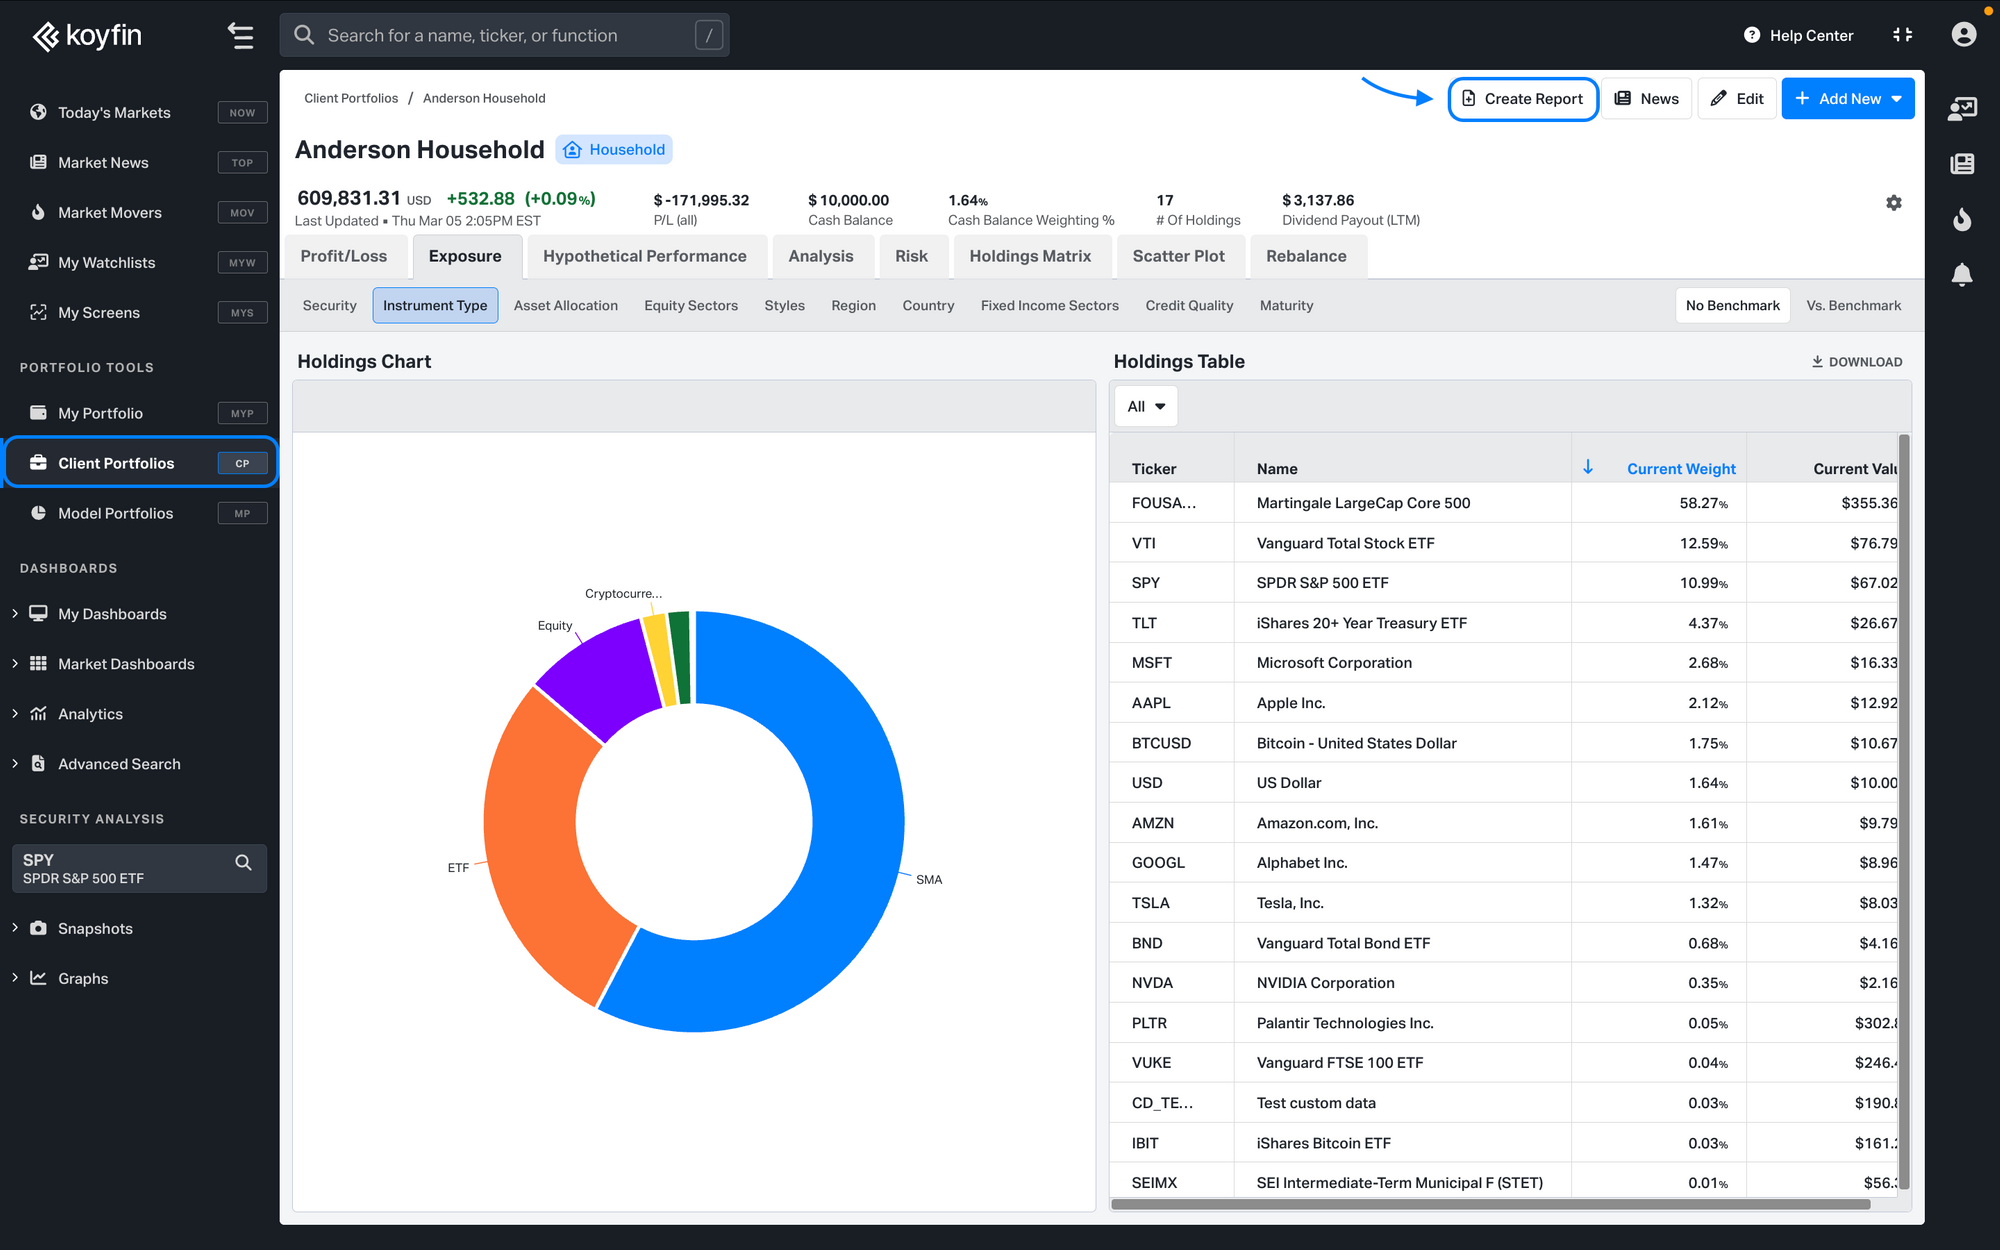
- Click Create Report from any fund snapshot, model portfolio, or client portfolio page.
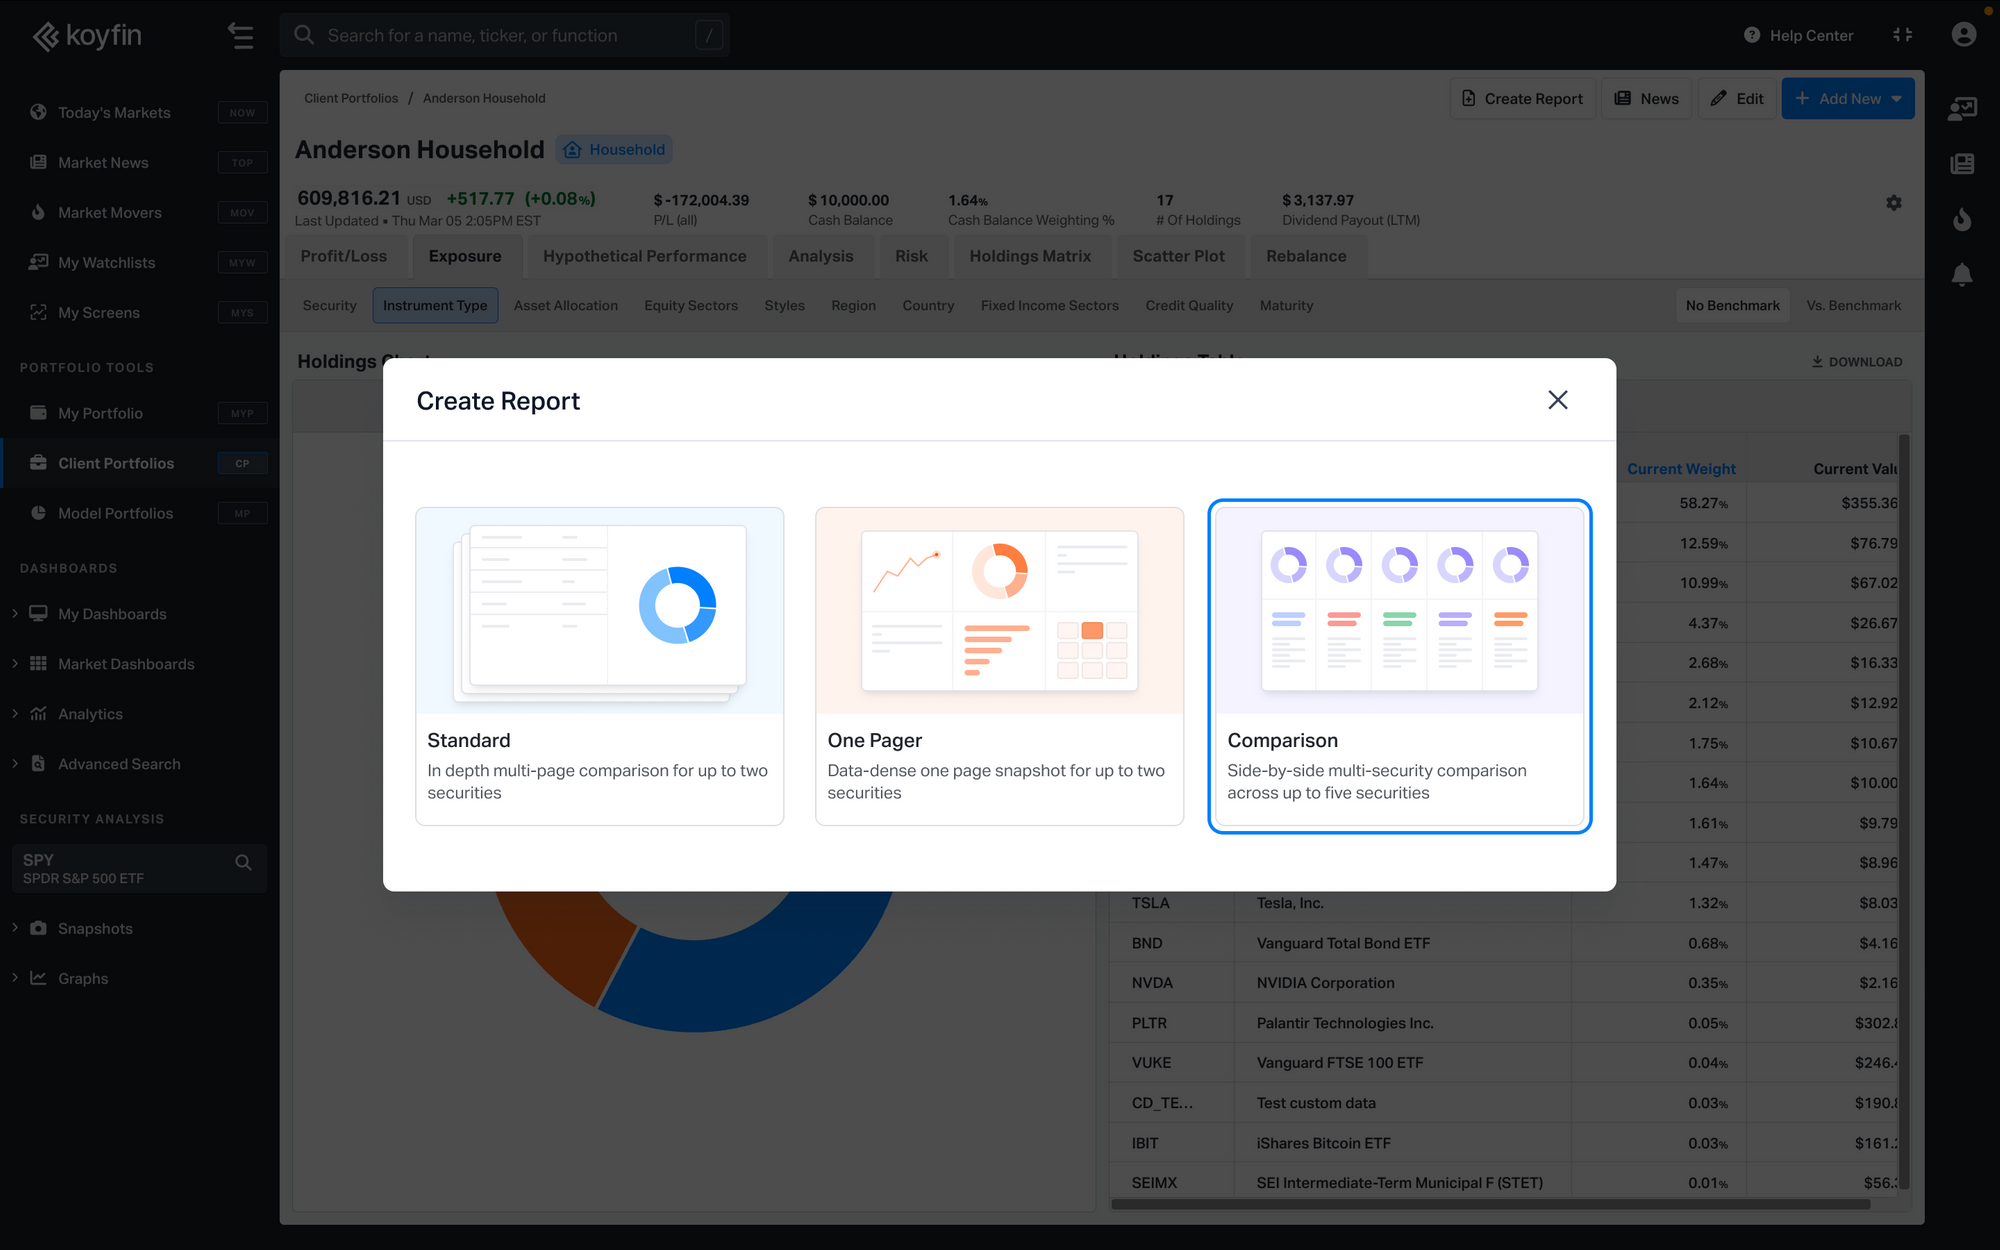
2. In the report creation window, select Comparison Report.
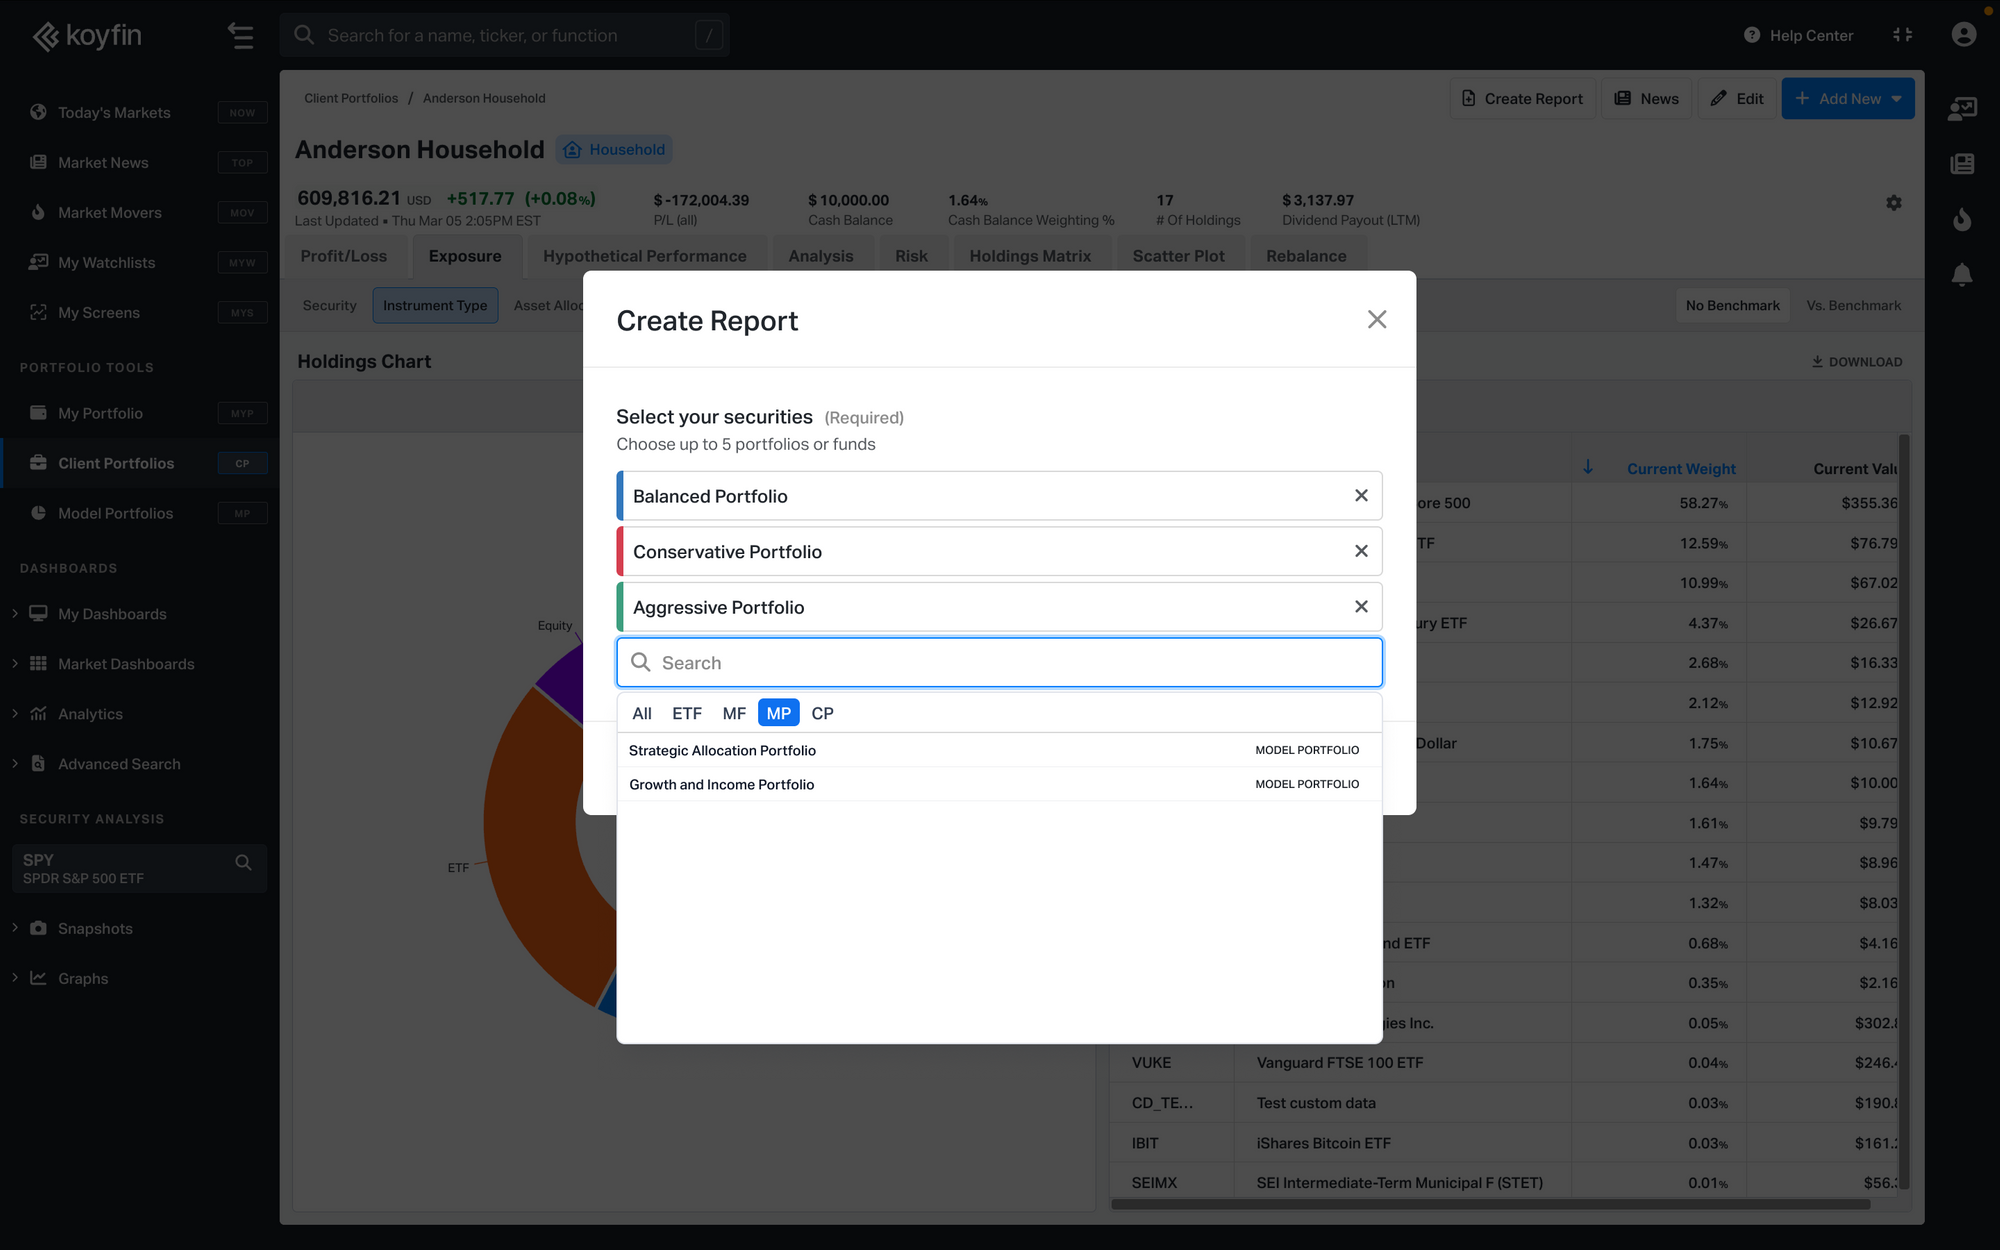
3. Choose 1 to 5 securities to compare. You can combine ETFs, mutual funds, model portfolios, and client portfolios in the same report.
4. Add a title, client name, prepared by name, and logo.
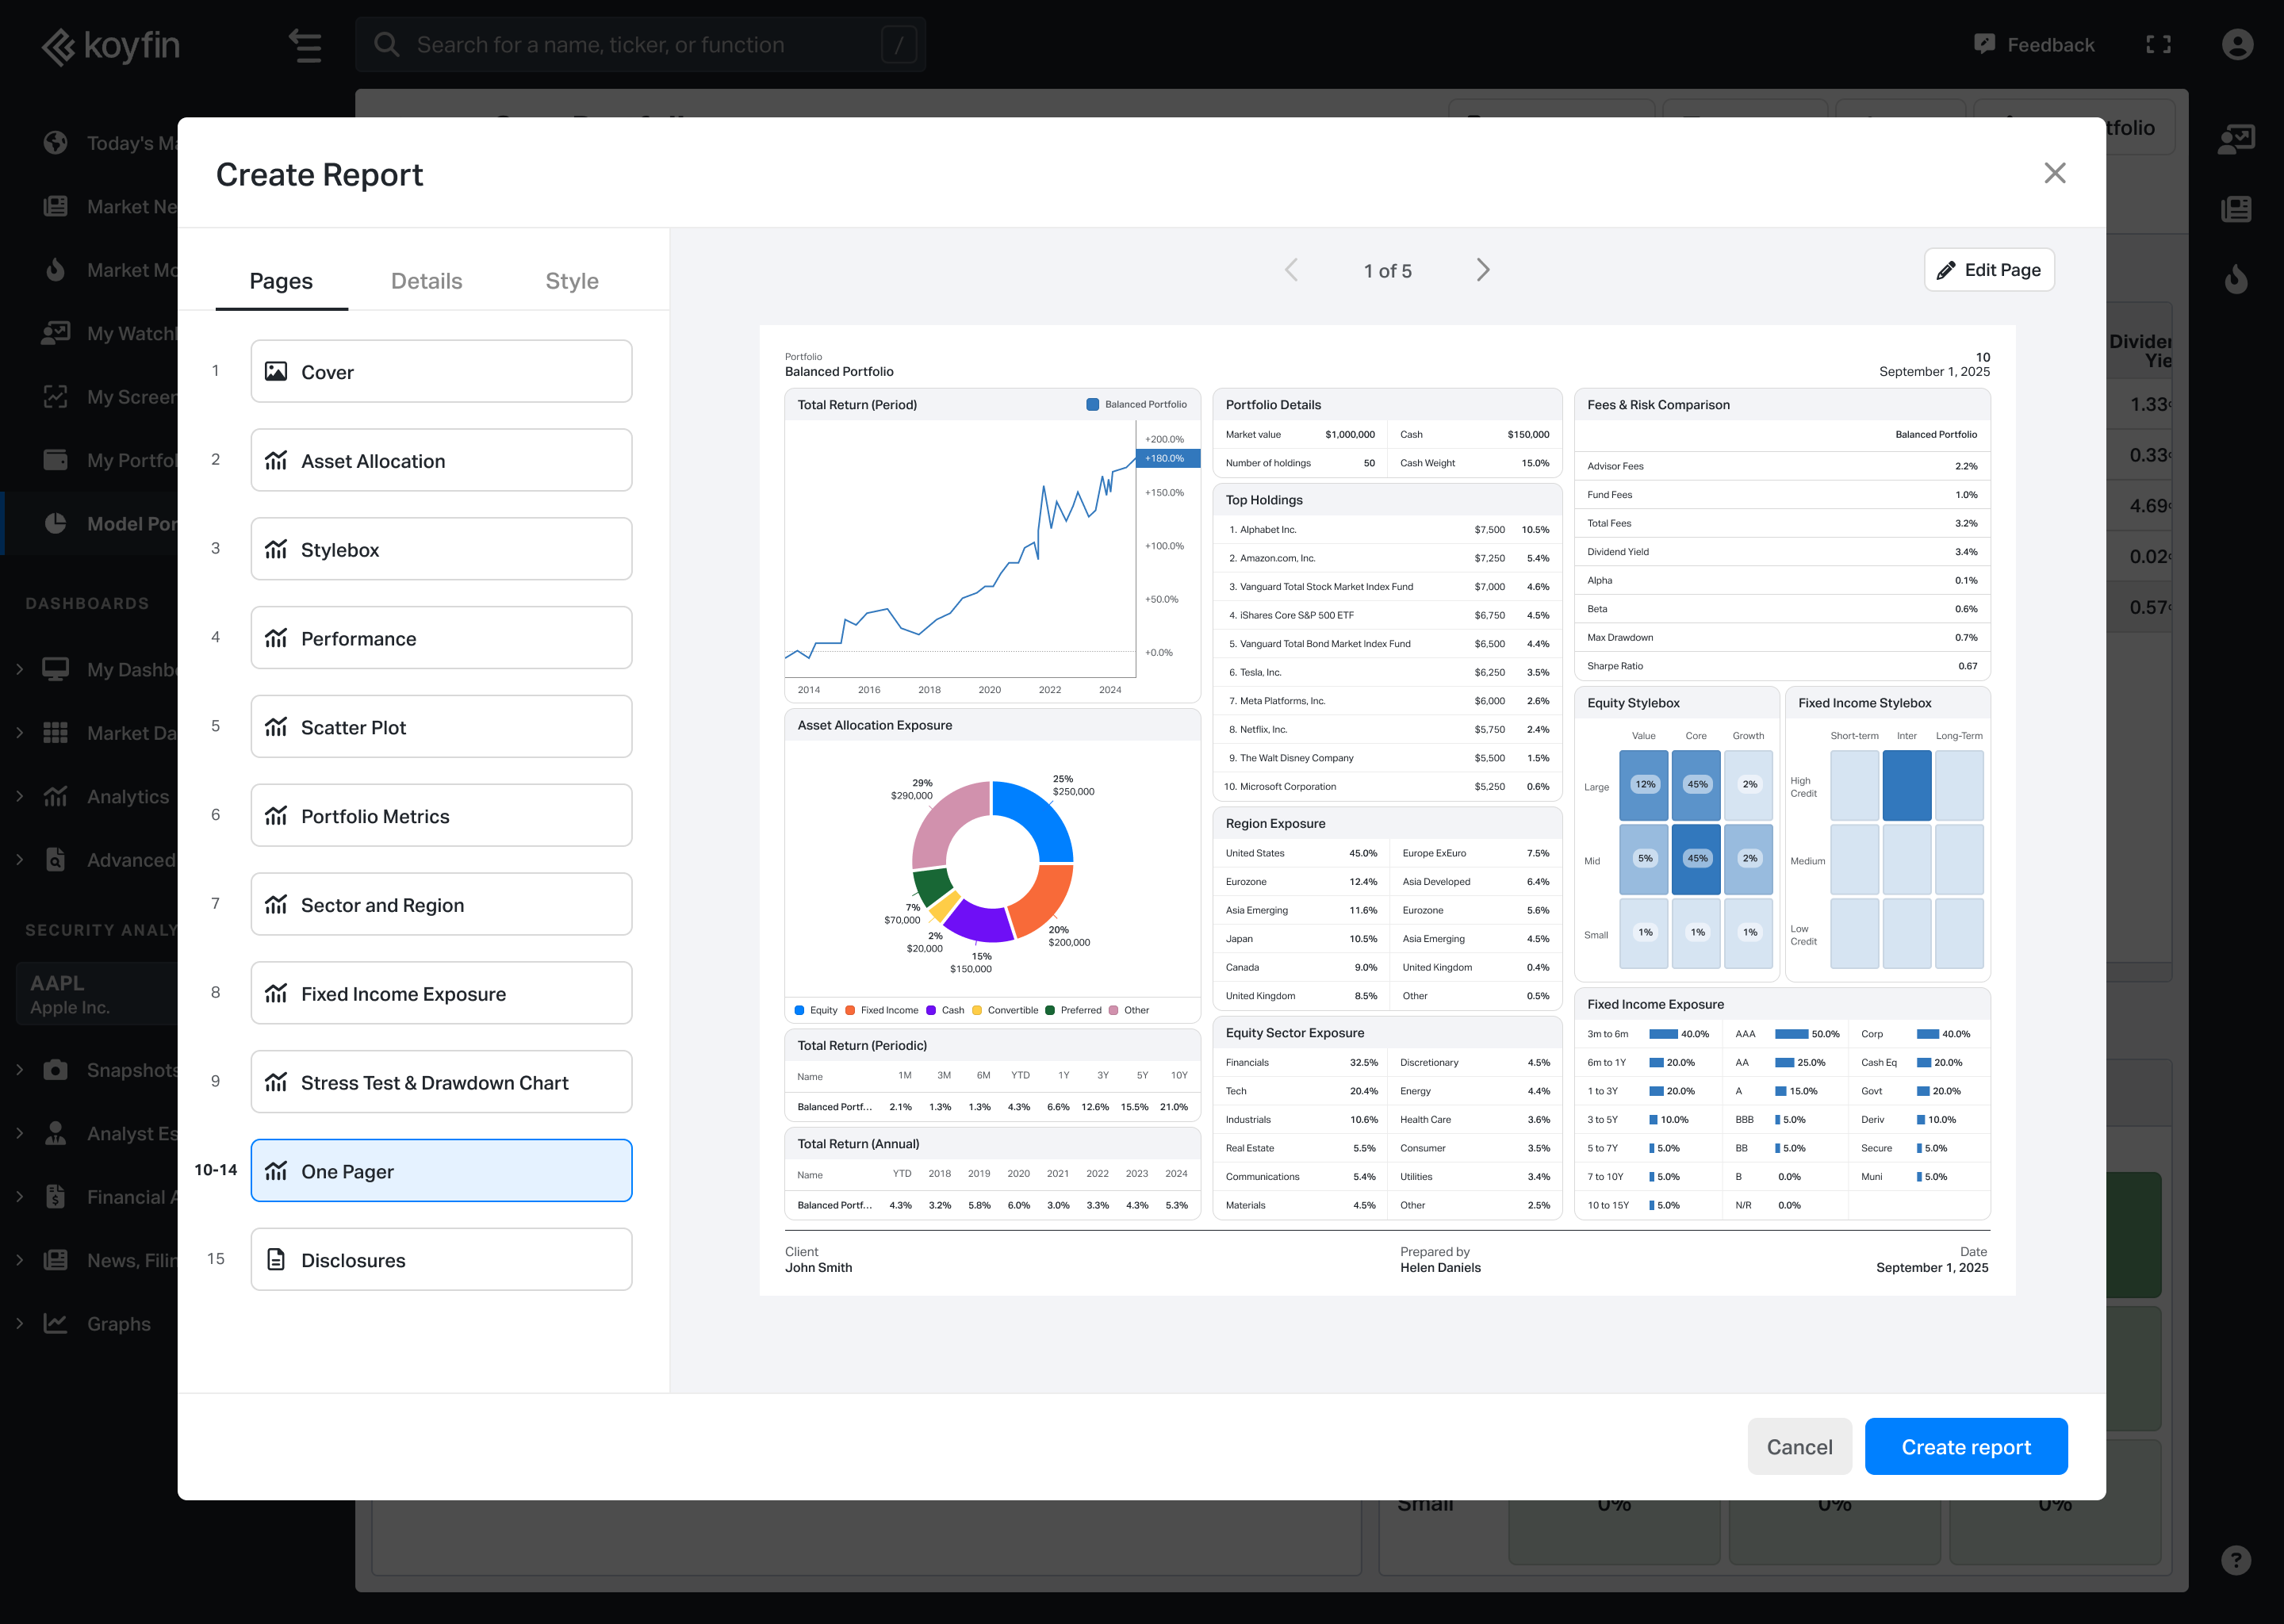
5. The report editor will open with all available pages.
From there, you can review the report and adjust the available customization settings before printing or exporting it as a PDF.
Report pages
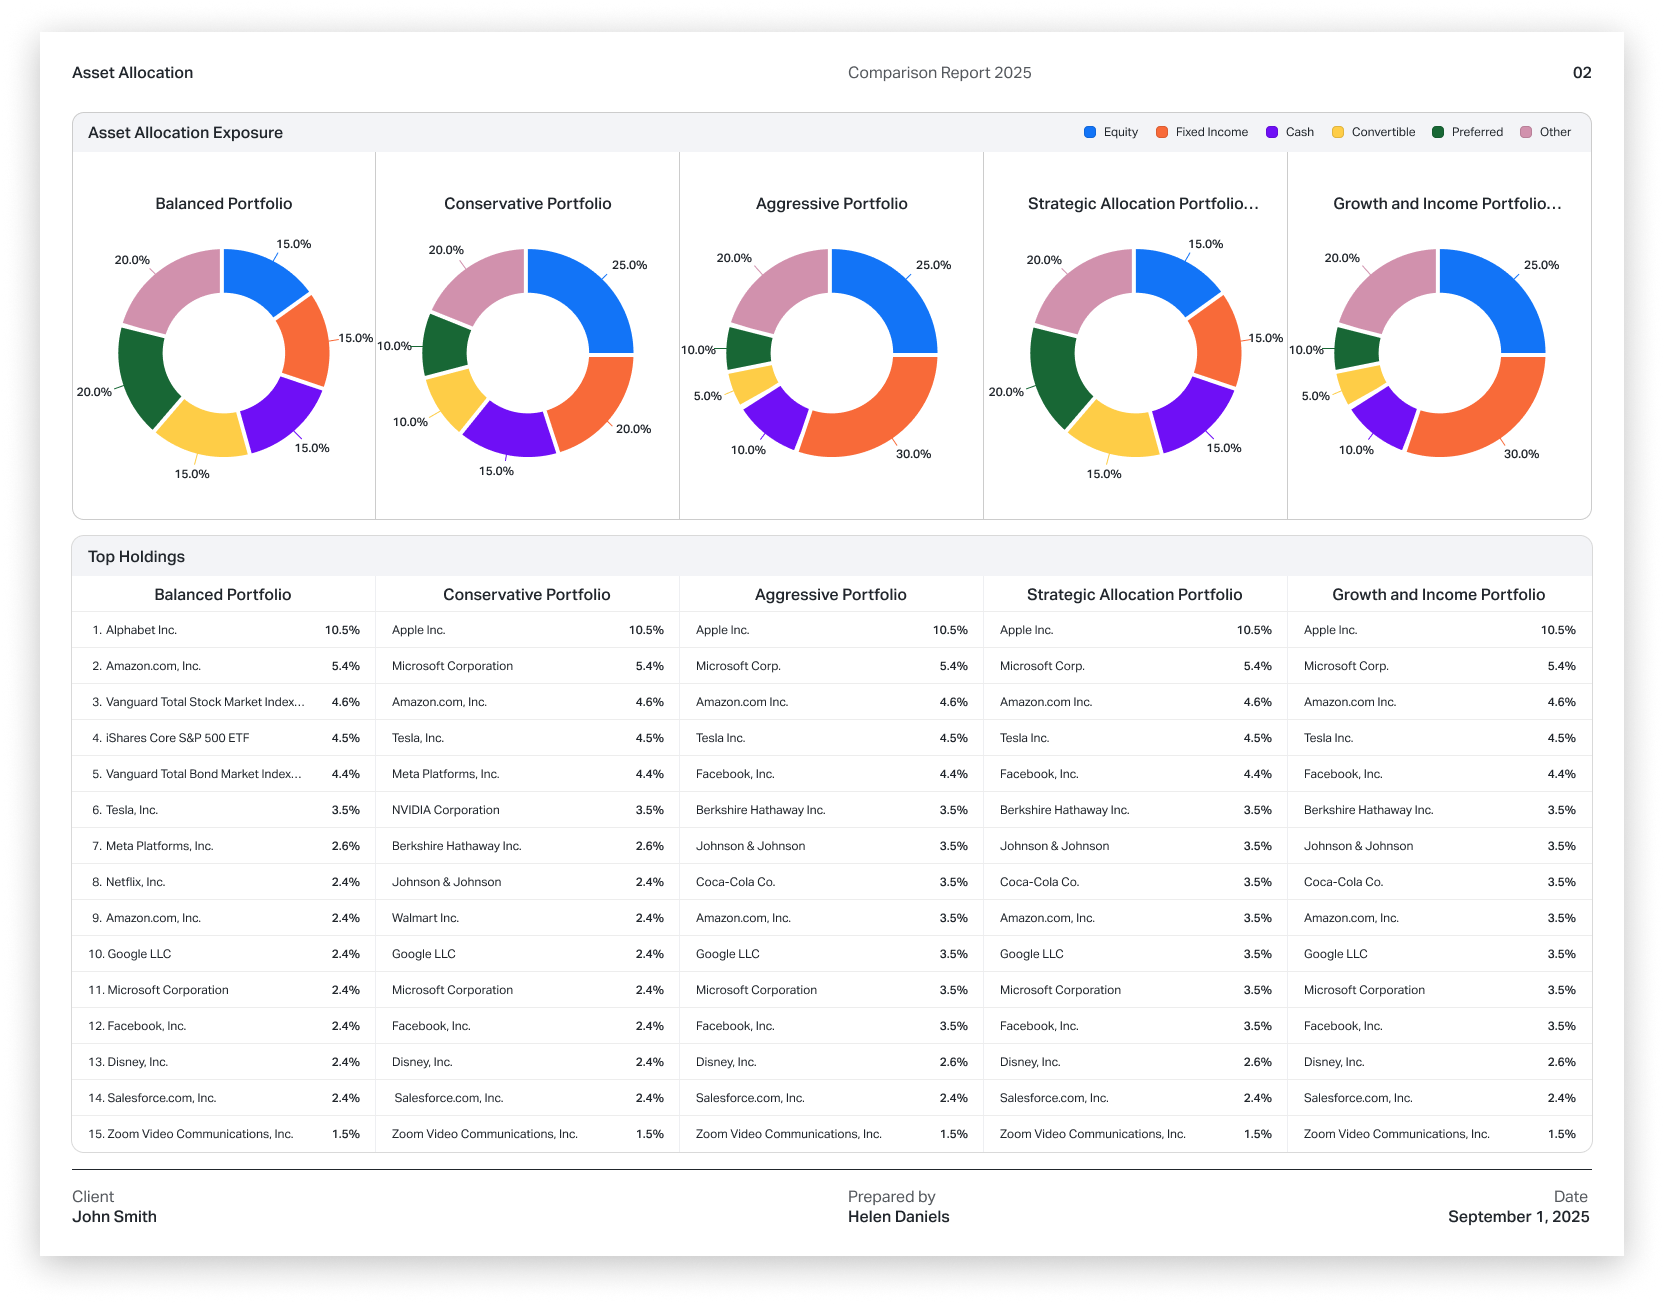
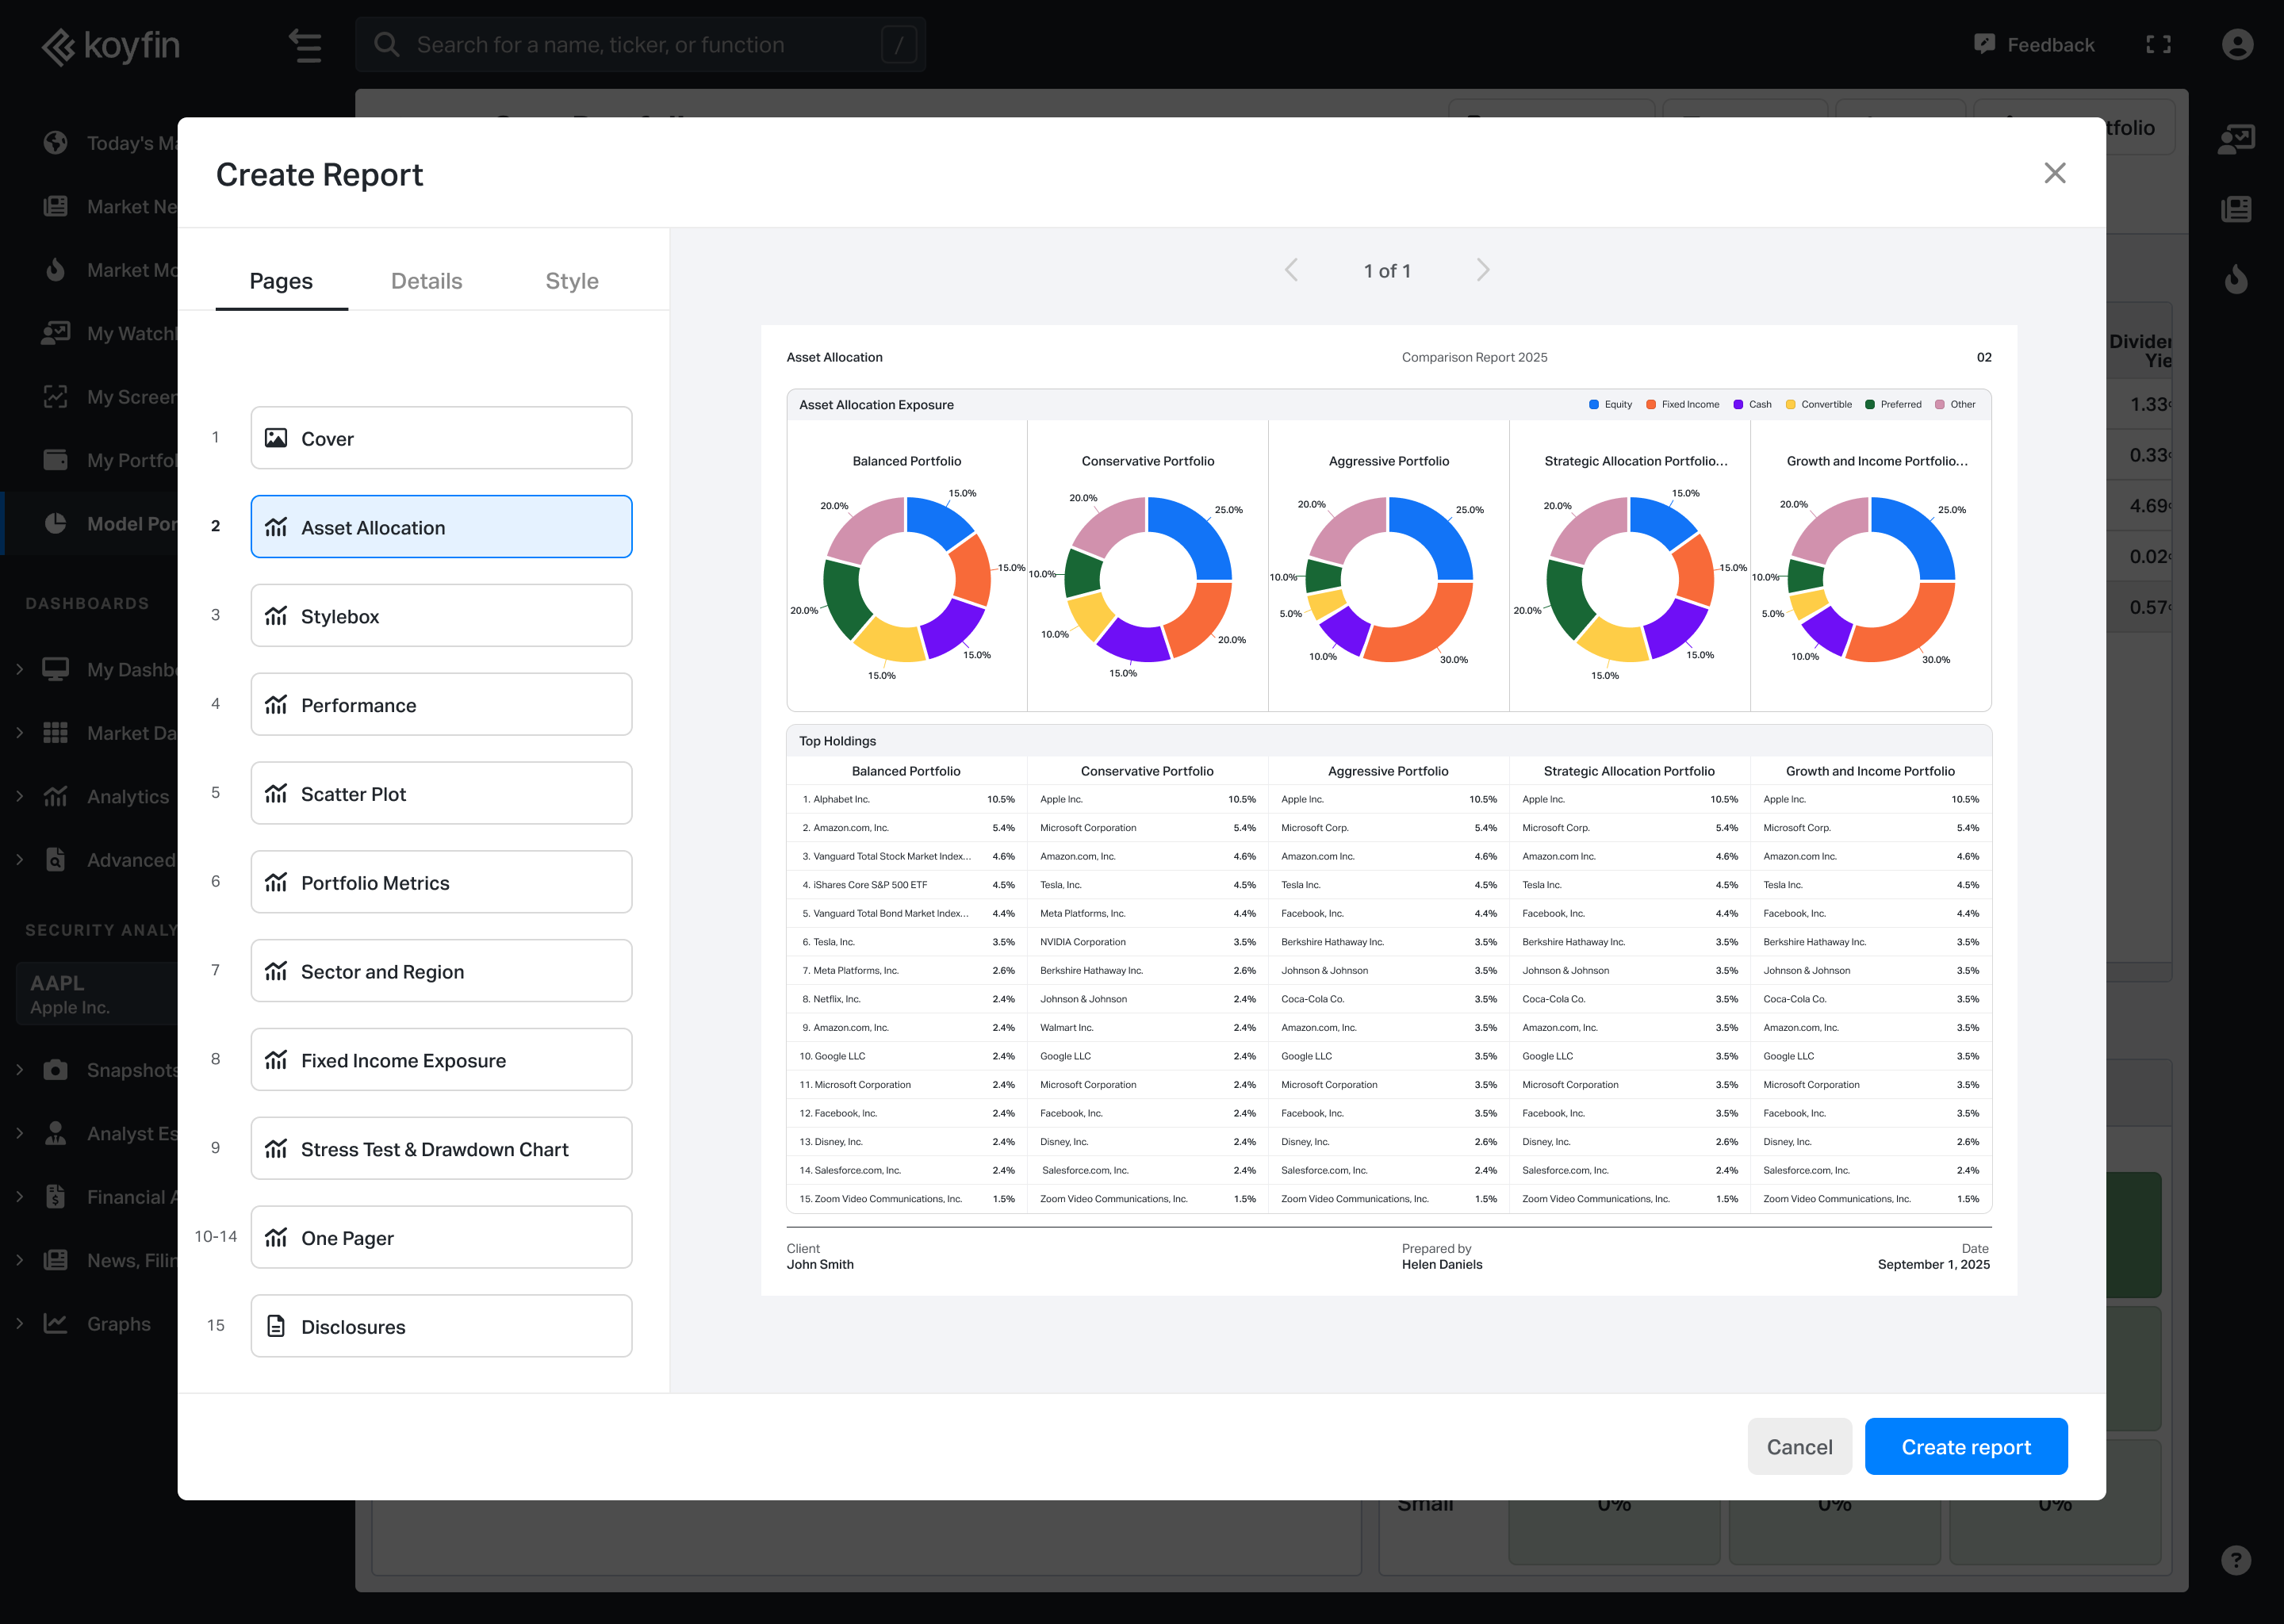
Comparison Reports include several pages designed to show key differences between the selected securities.
- Asset Allocation: Displays asset class breakdown using pie charts and a comparison table.
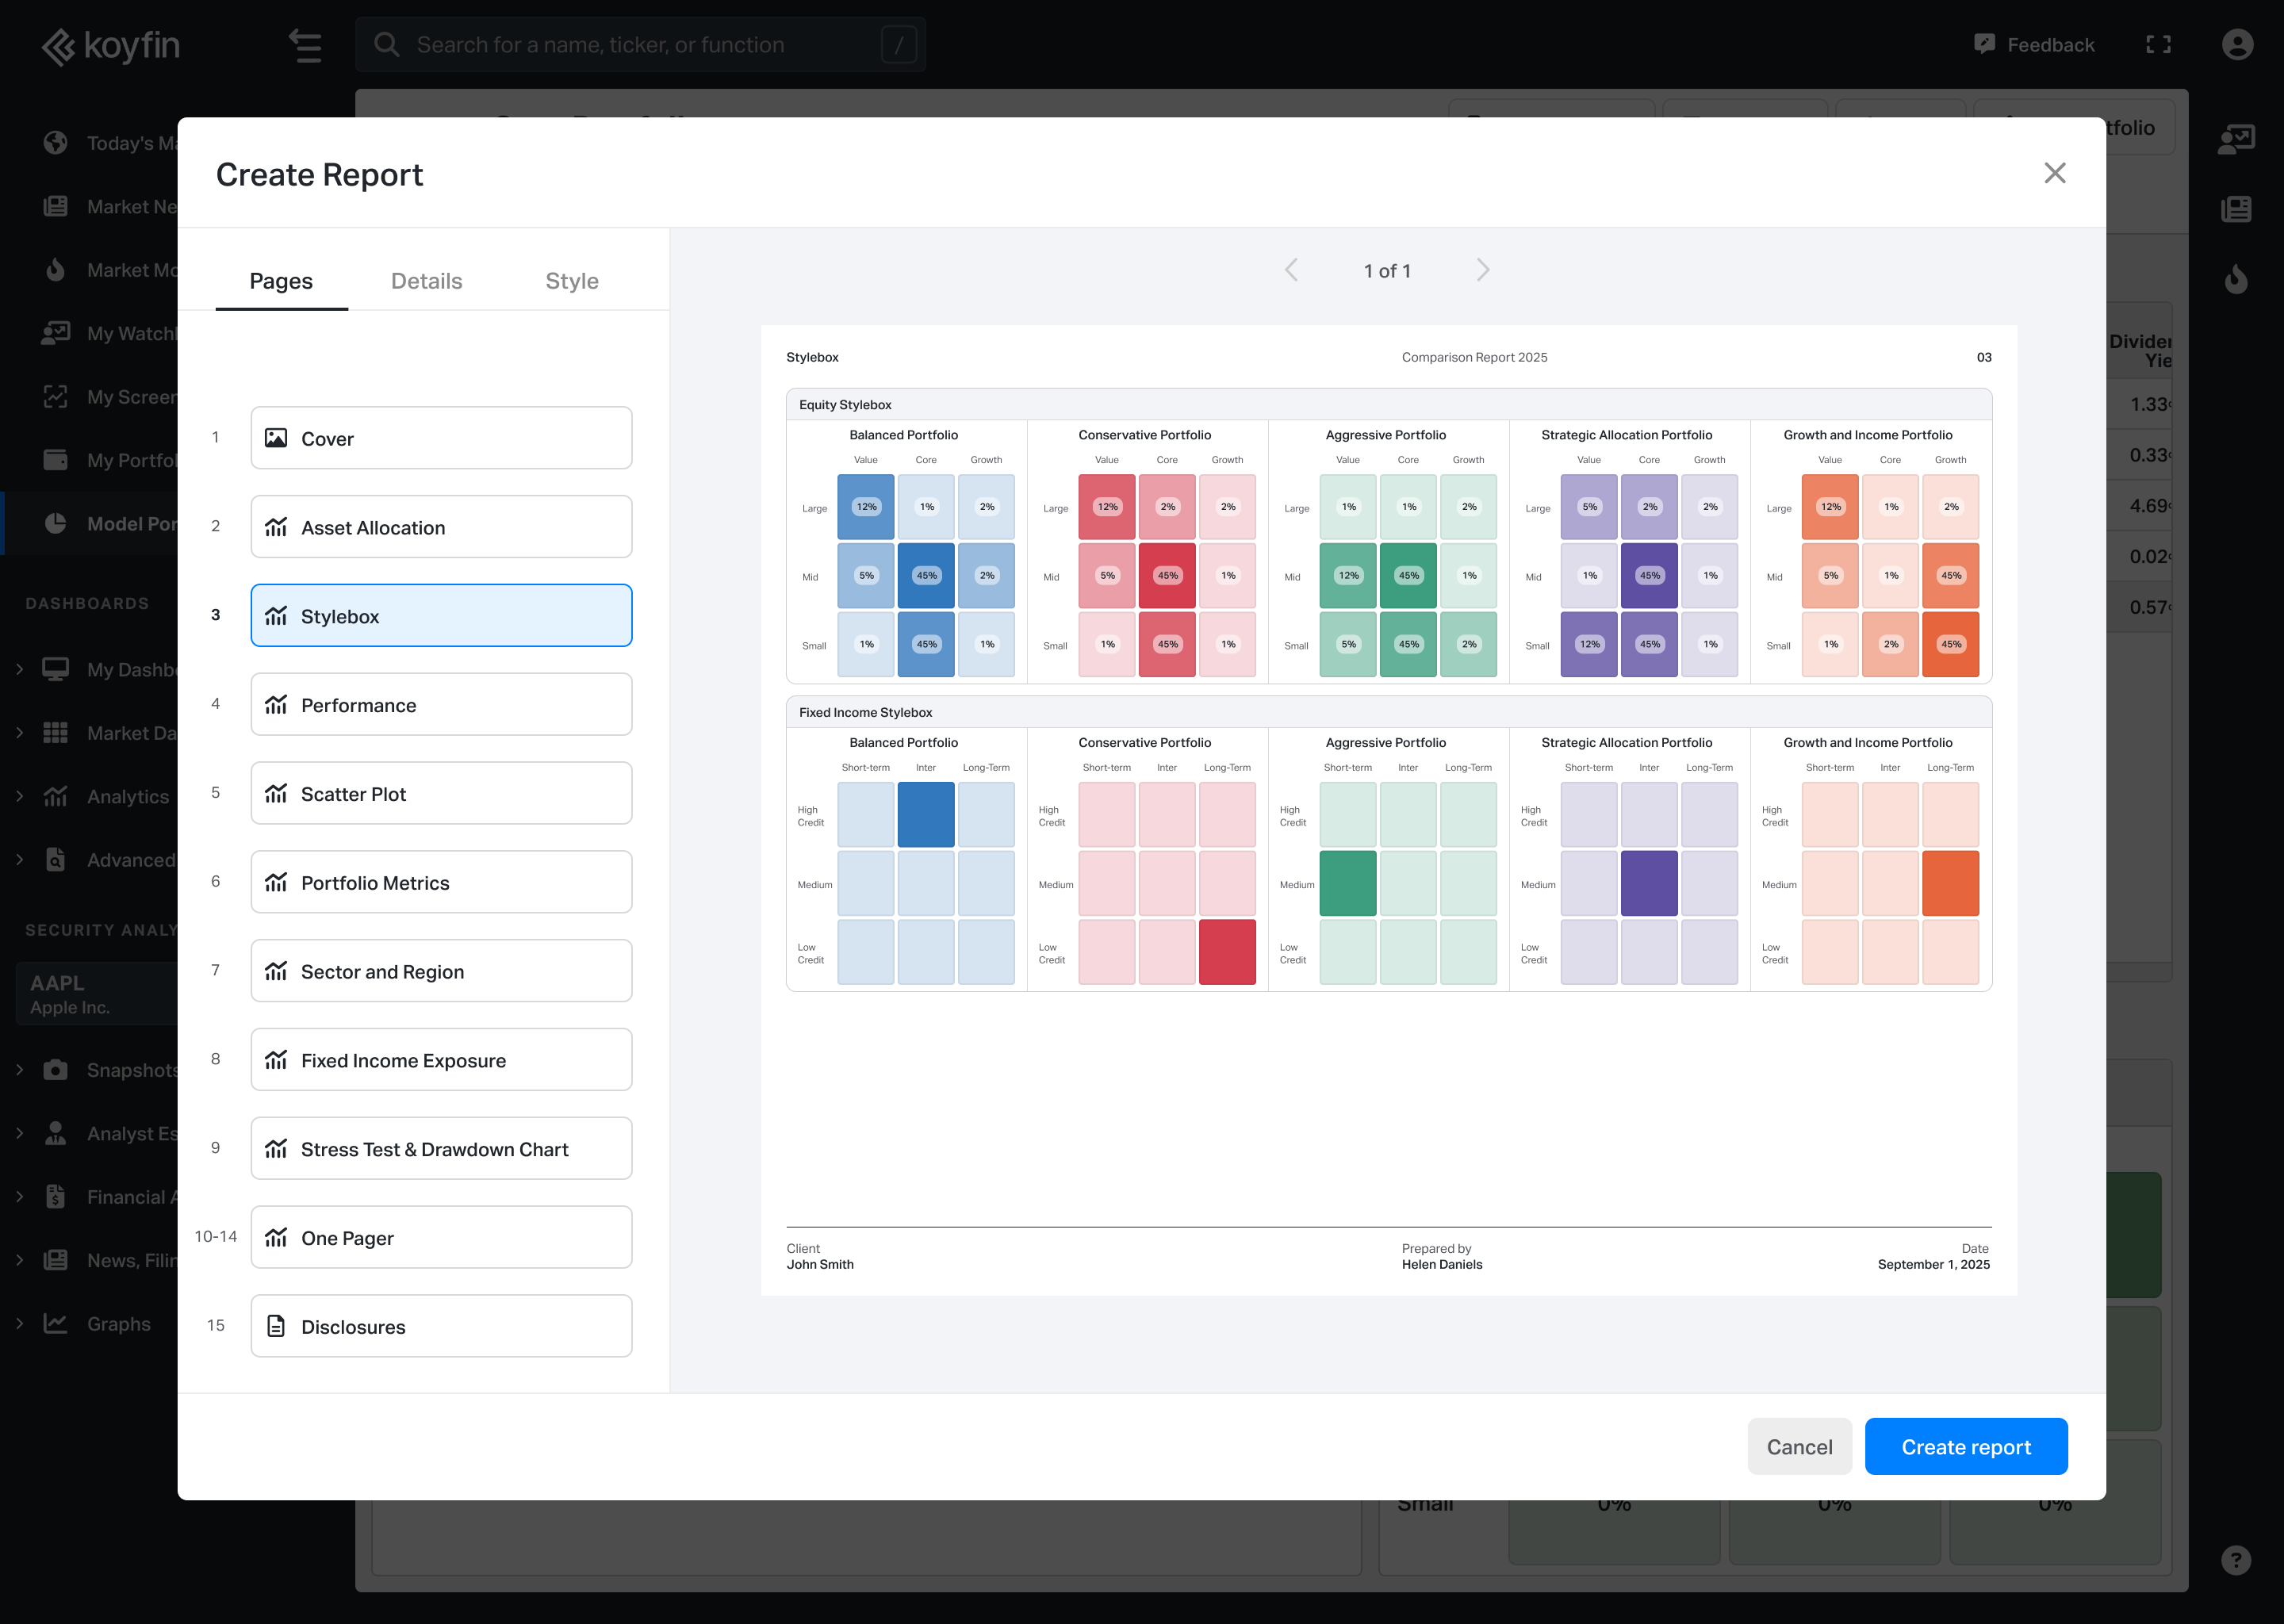
- Equity Exposure (Stylebox): Morningstar-style stylebox grids for each security.
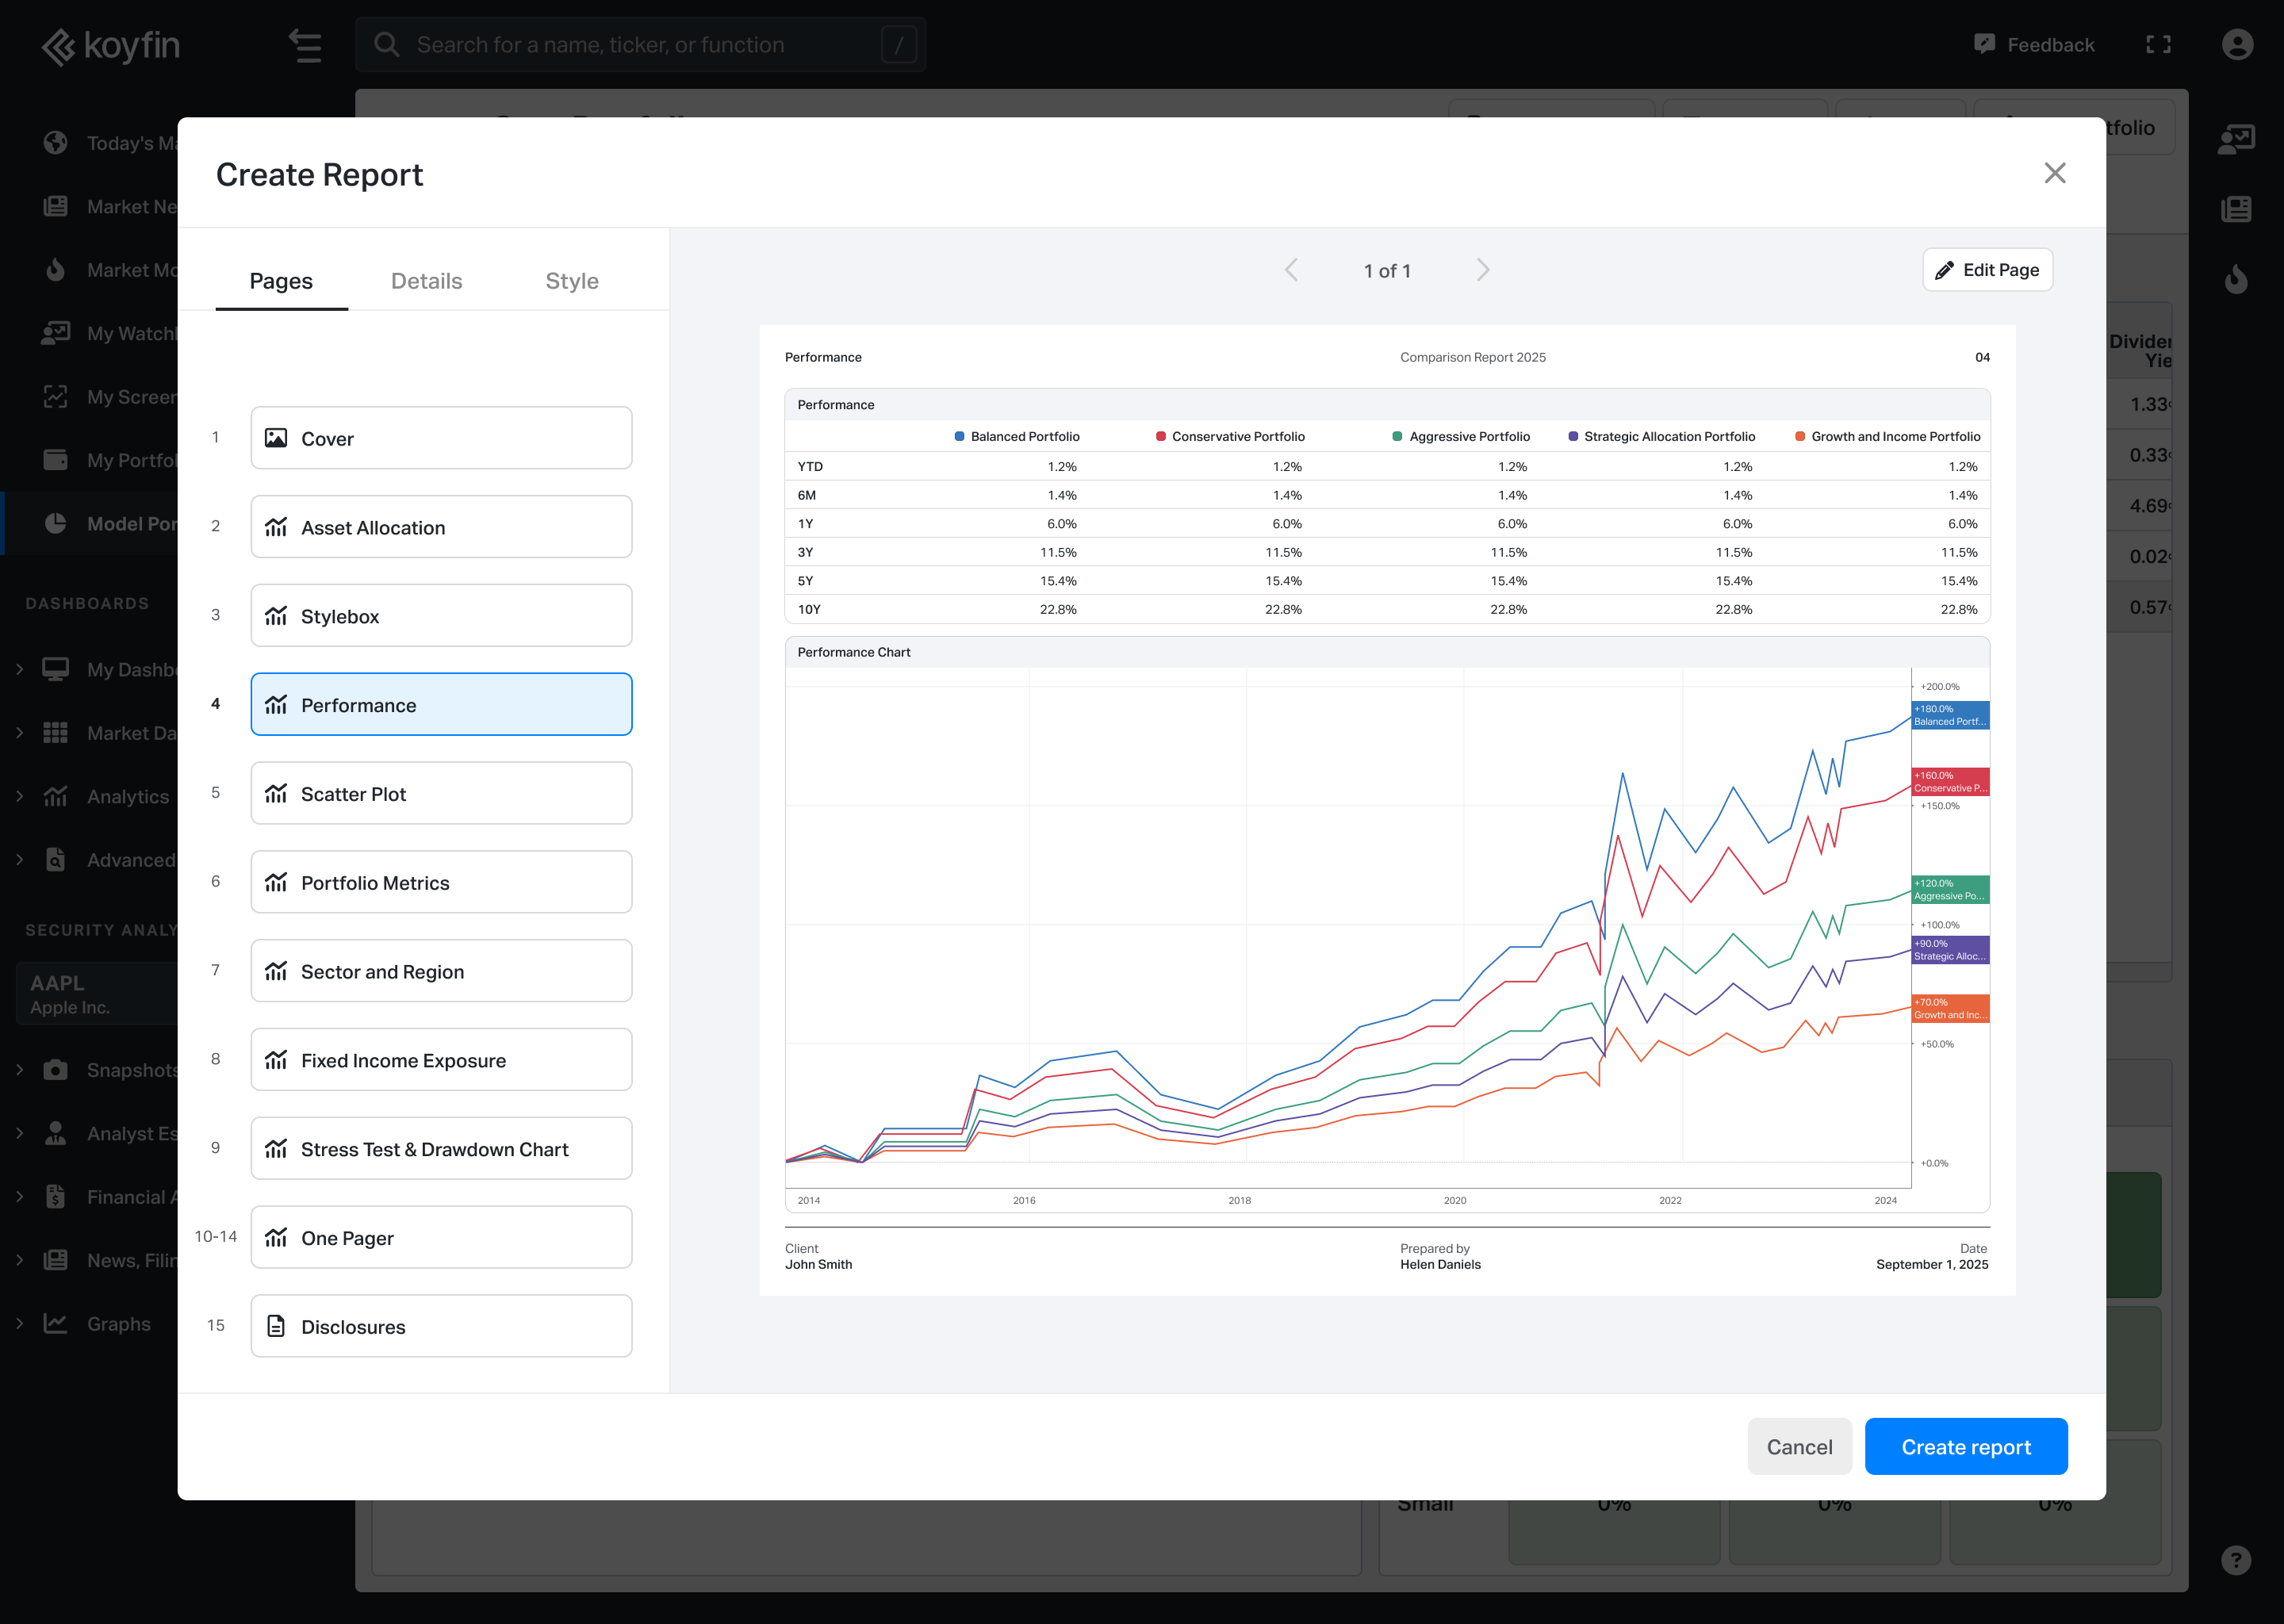
- Performance: Includes a cumulative performance chart and return table across standard time periods.
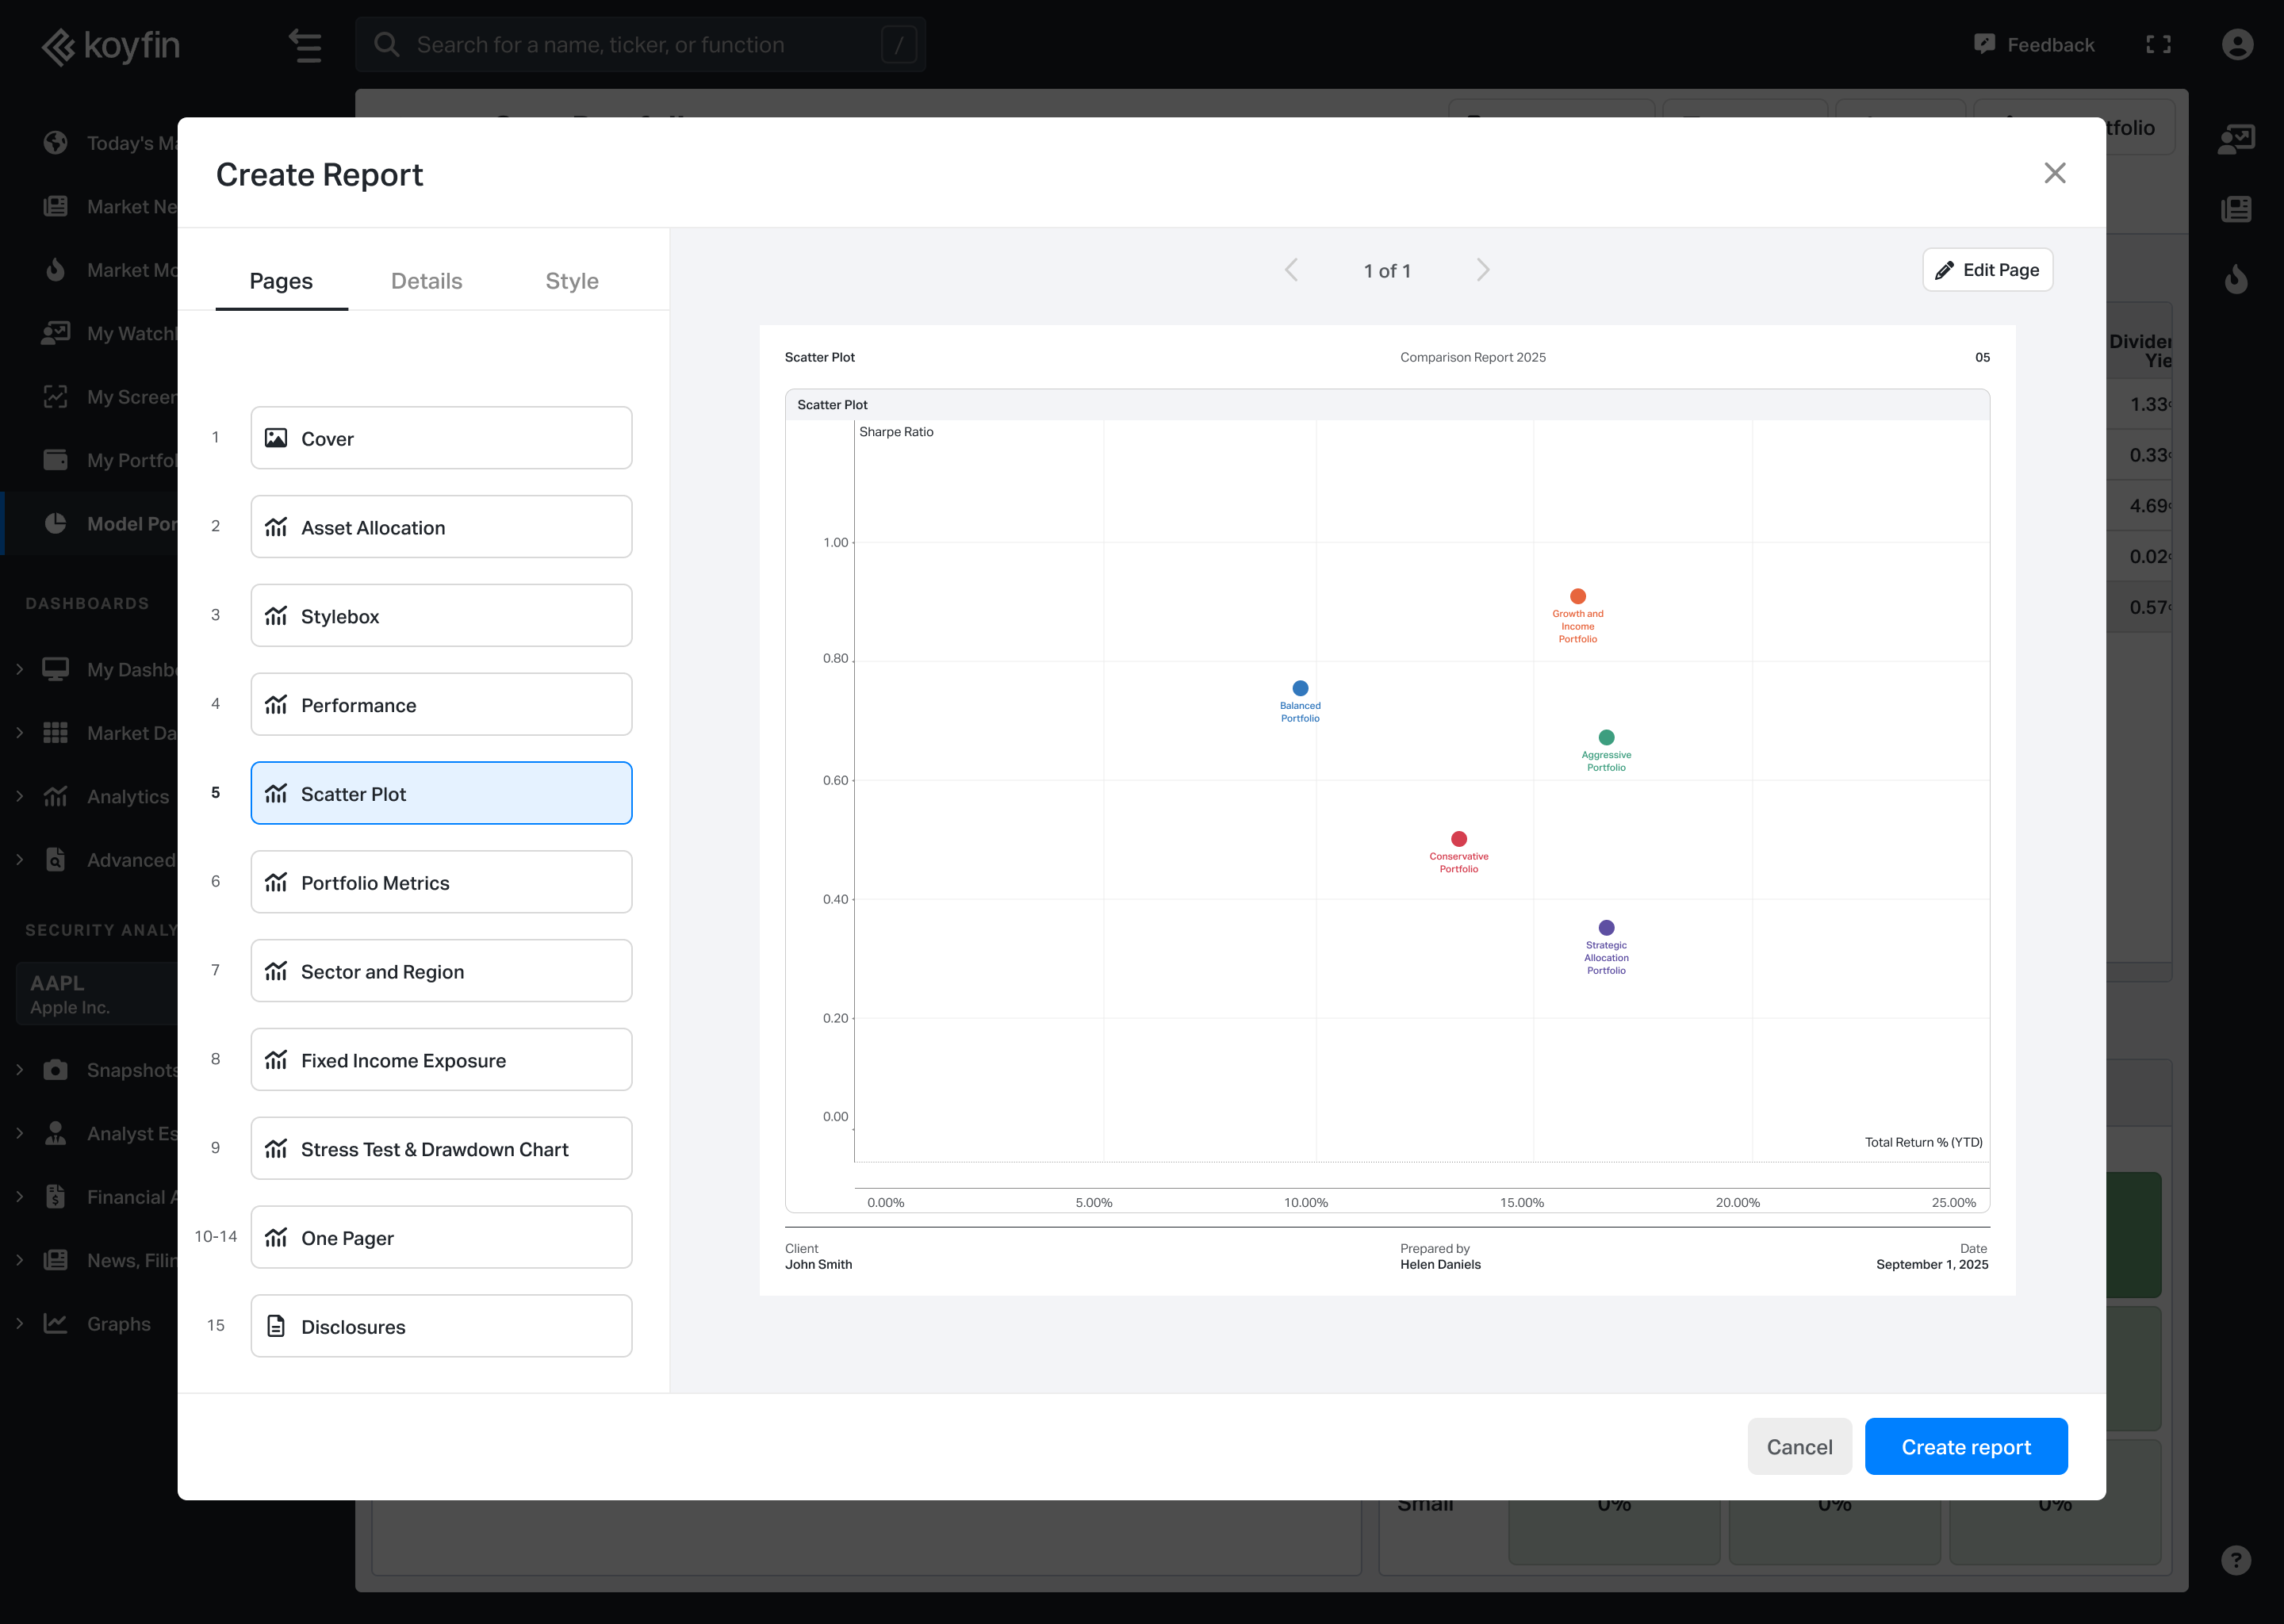
- Scatter Plot: Plots the selected securities on a risk/return chart. You can customize the X and Y axes using the column picker to choose the metrics you want to compare.
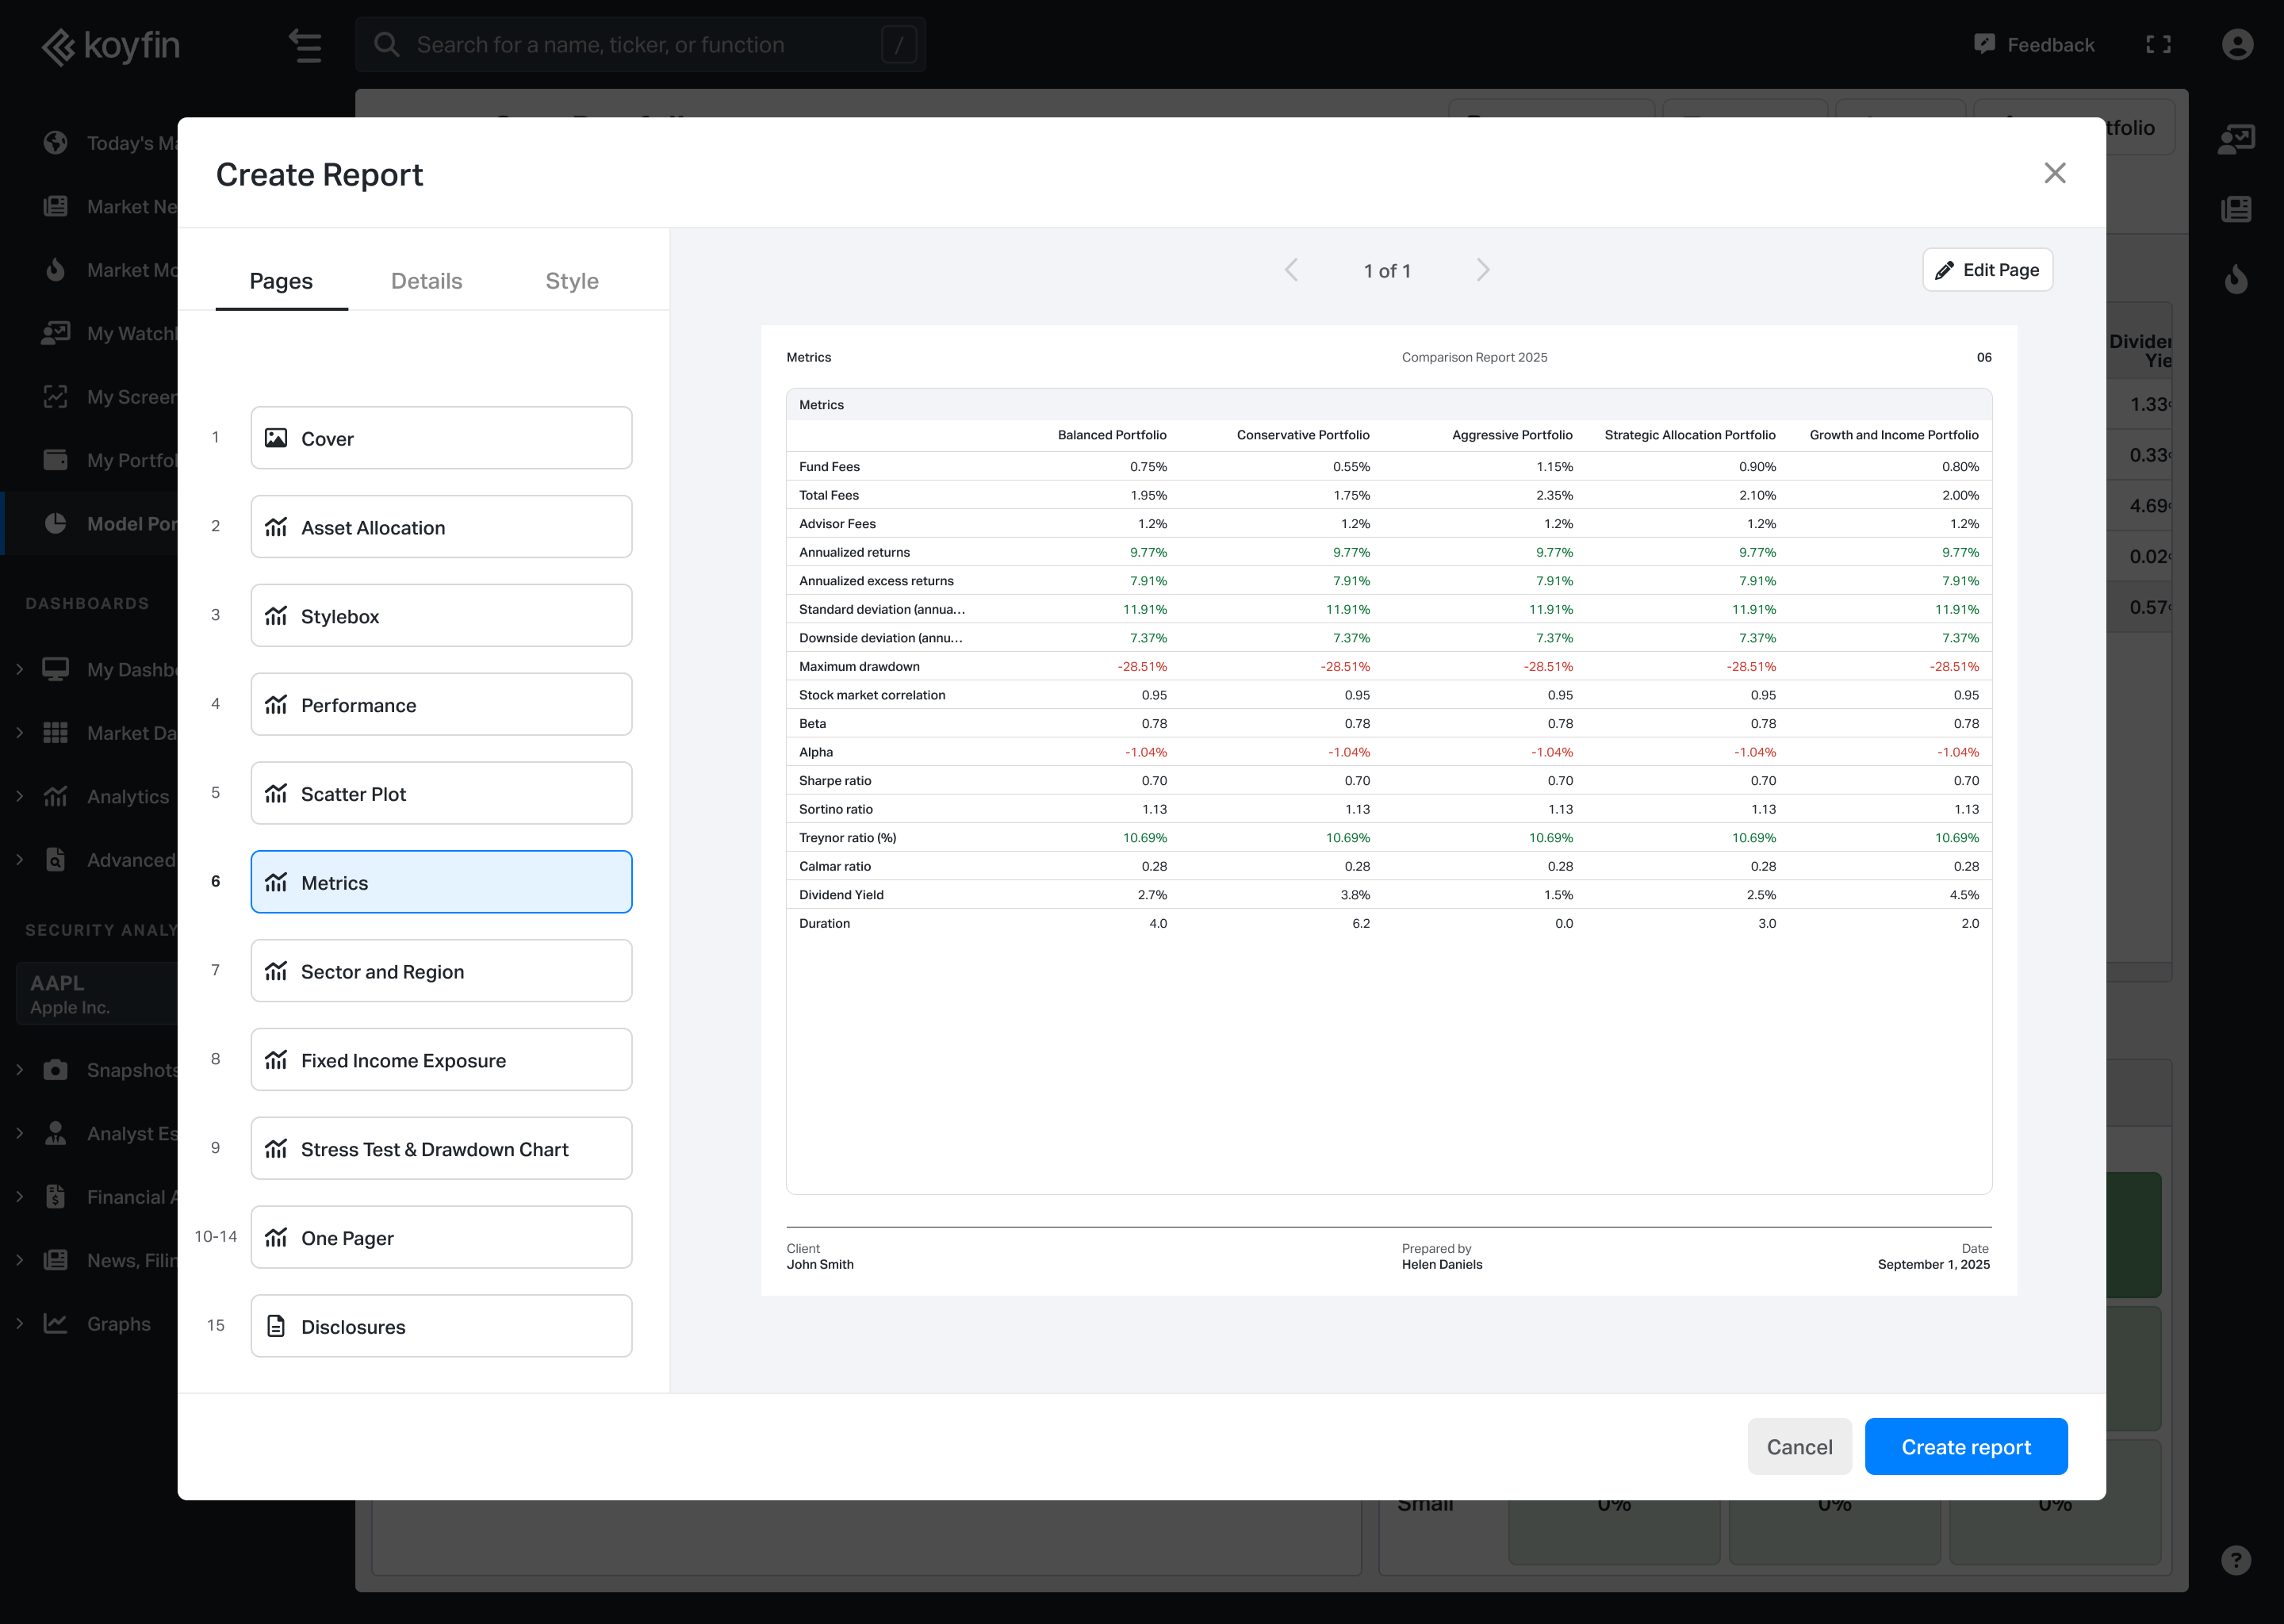
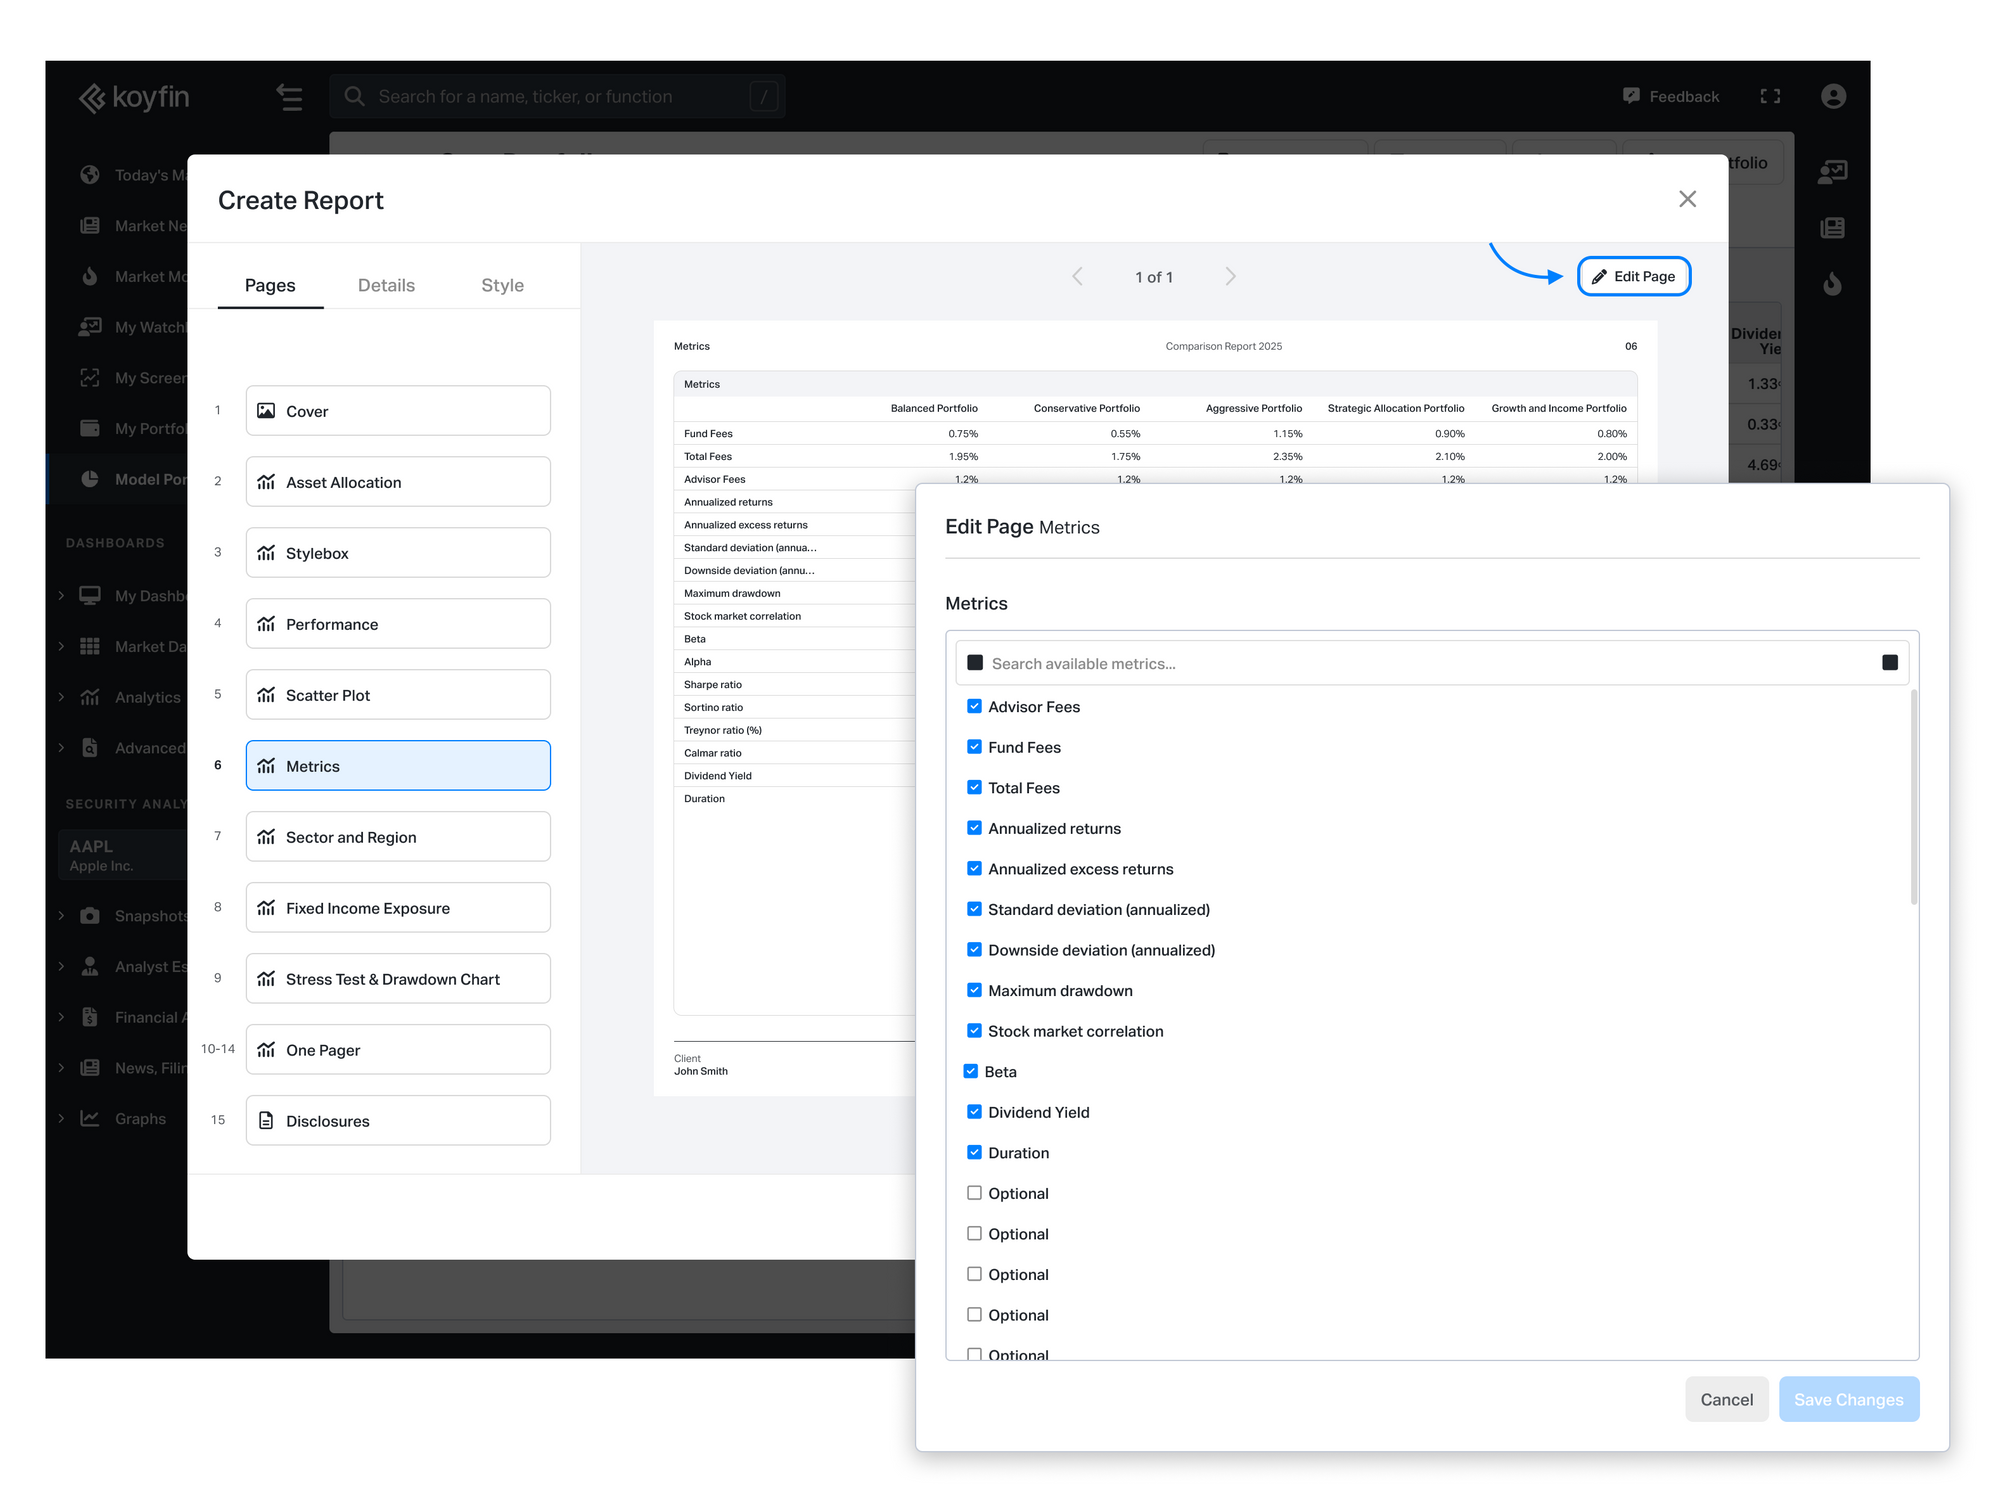
- Portfolio Metrics: Displays key quantitative statistics side by side.
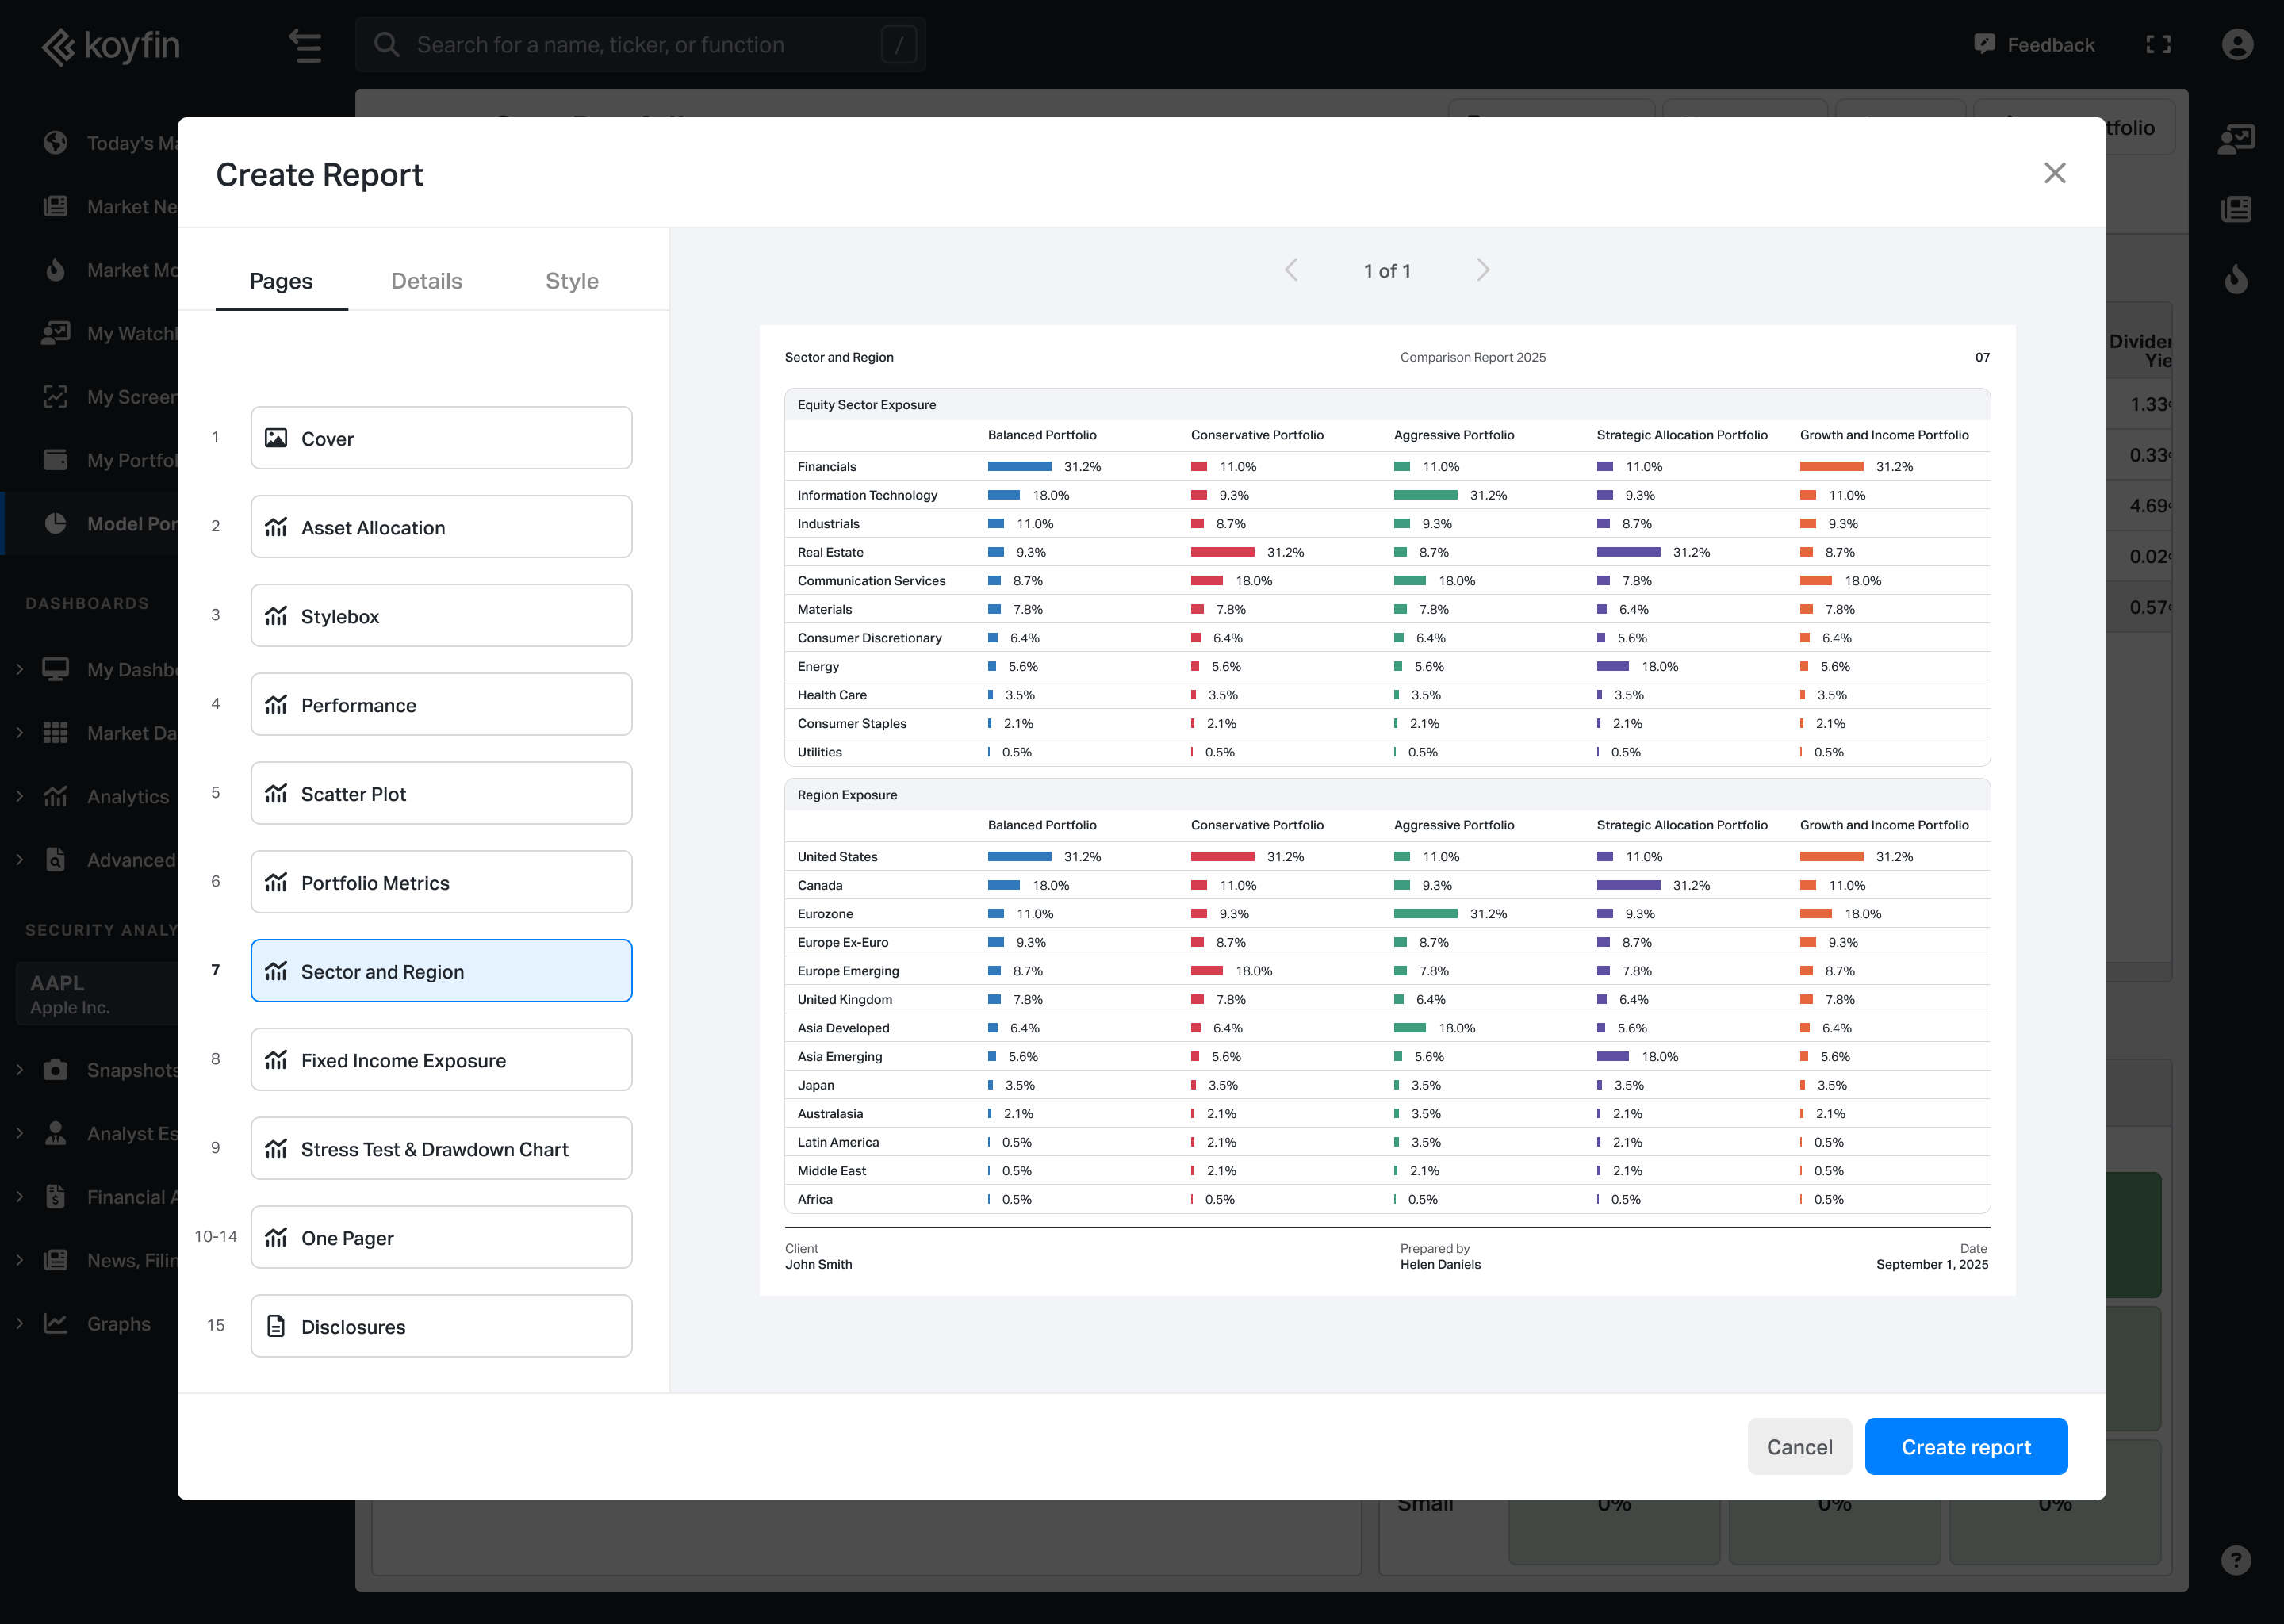
- Sector & Region: Shows sector and geographic exposure with visual breakdowns.
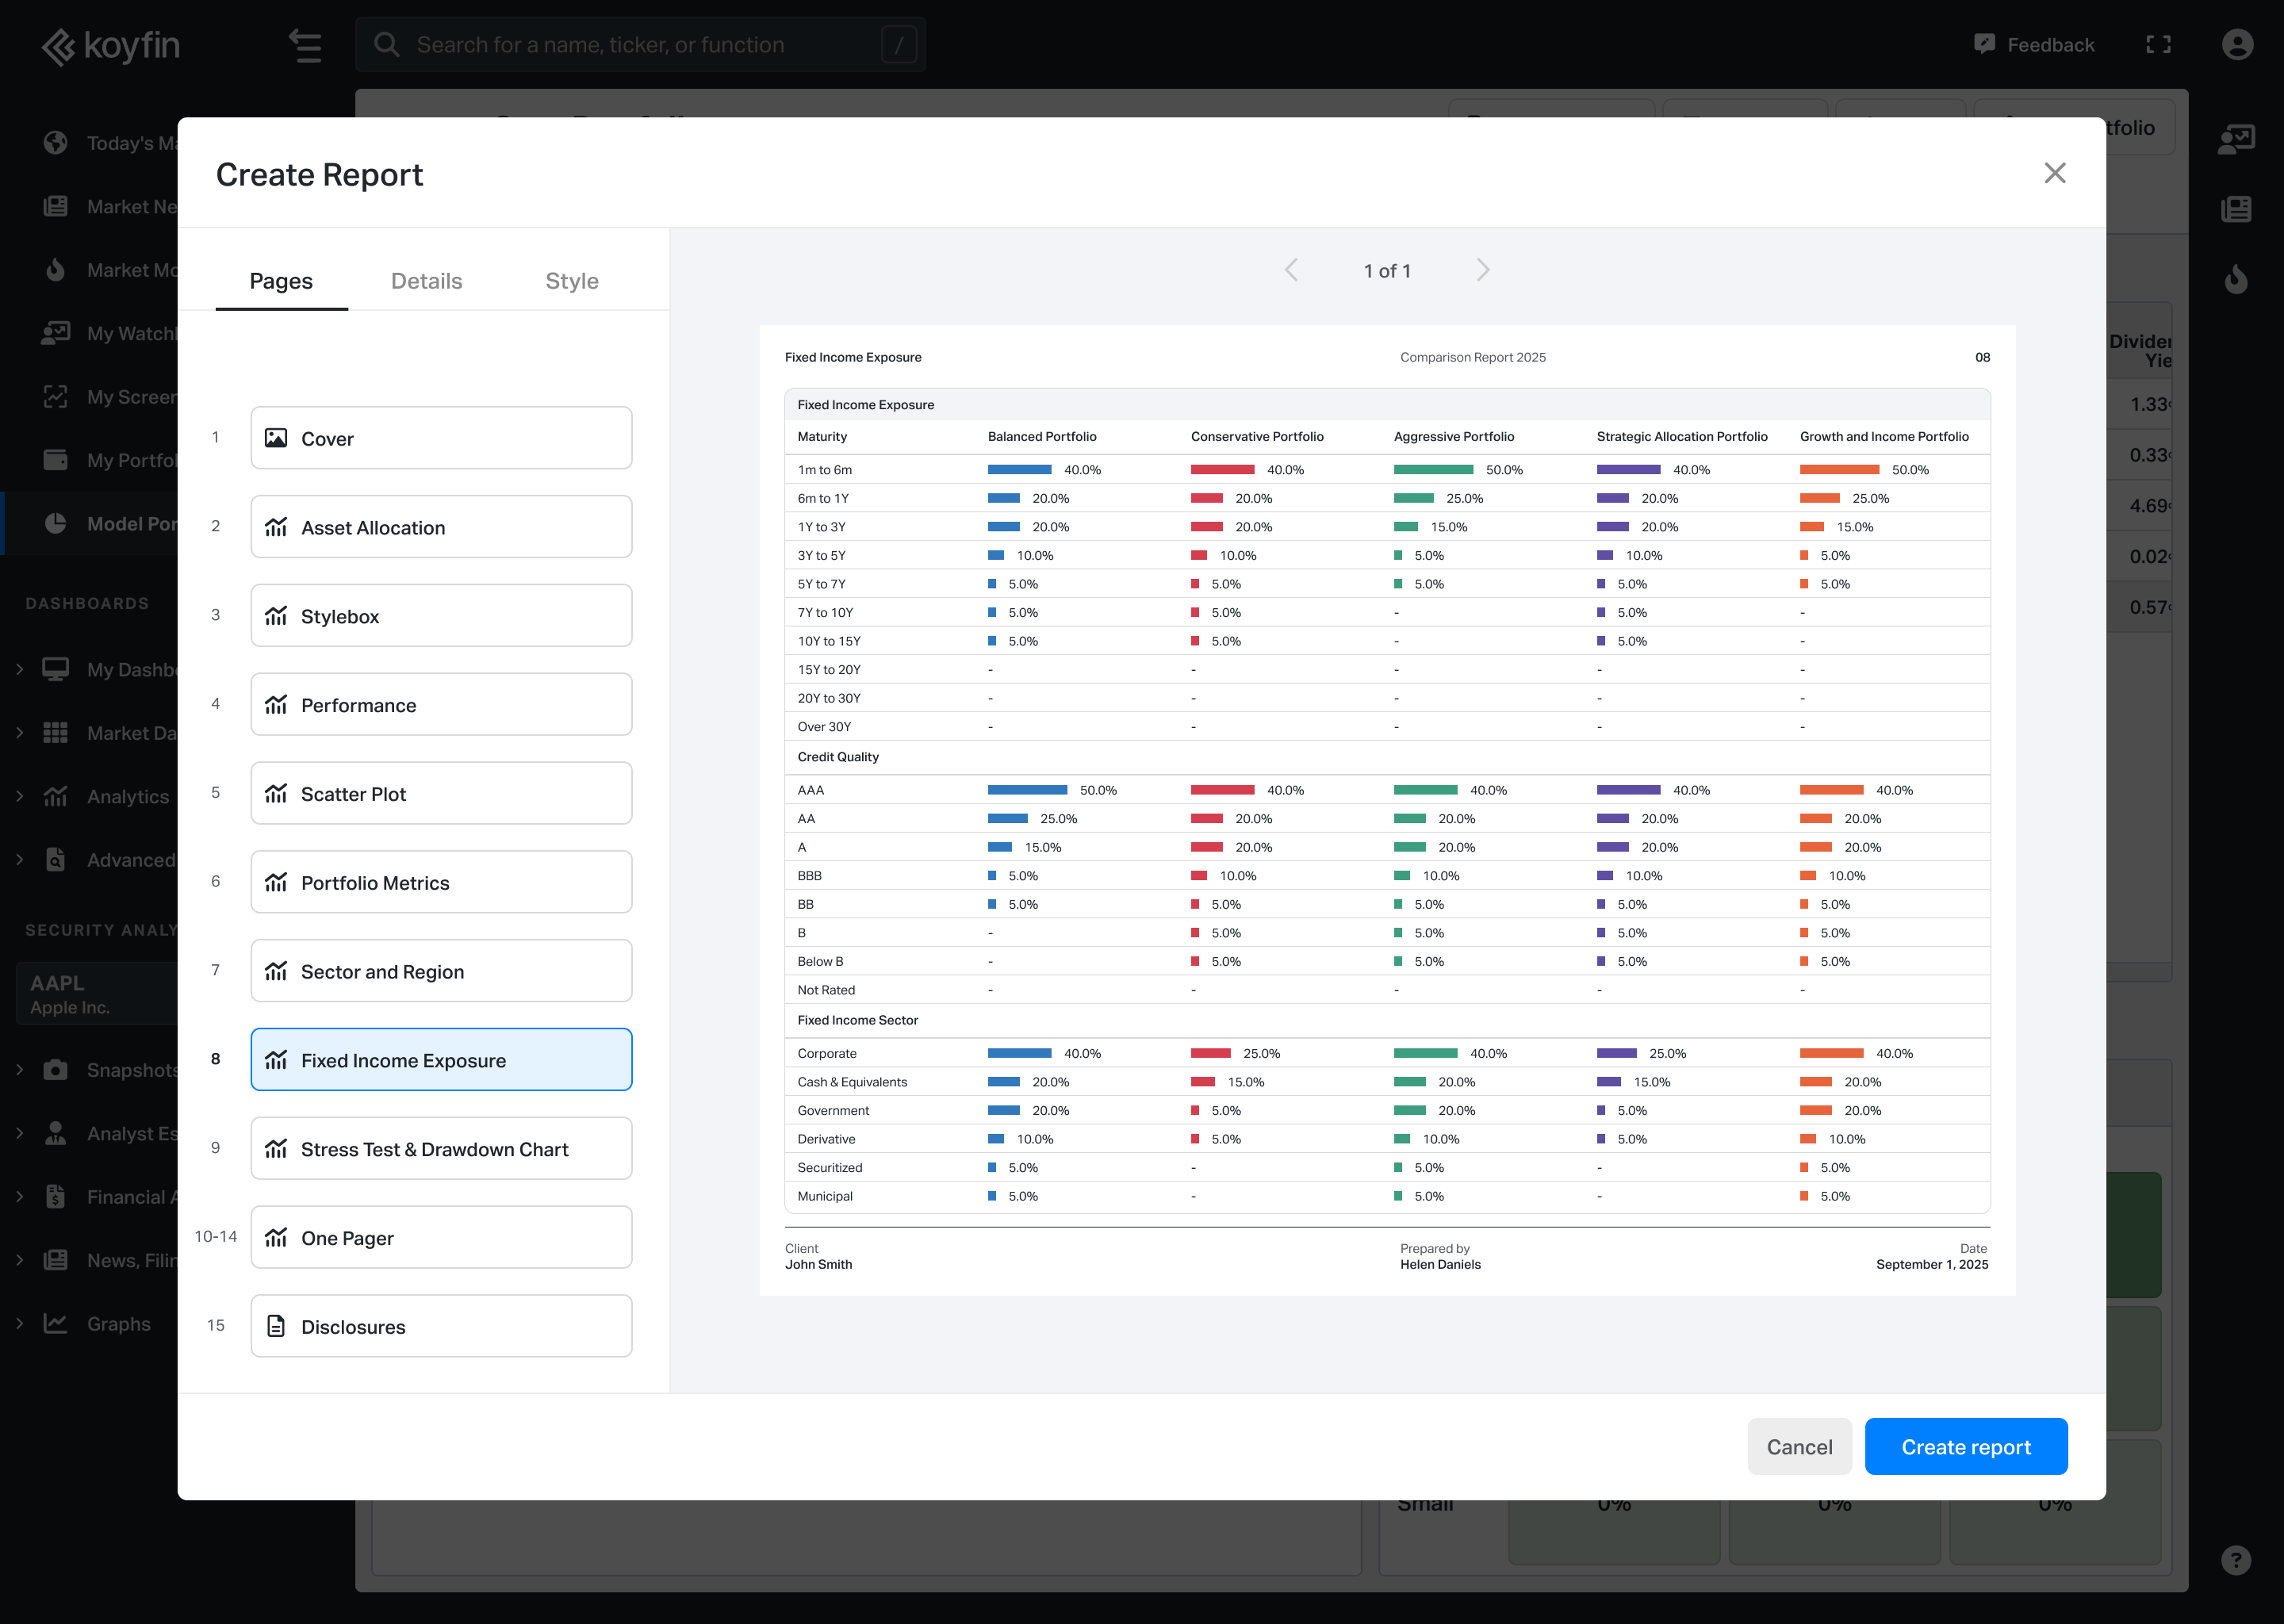
- Fixed Income Exposure: Highlights duration, credit quality, and other fixed income characteristics.
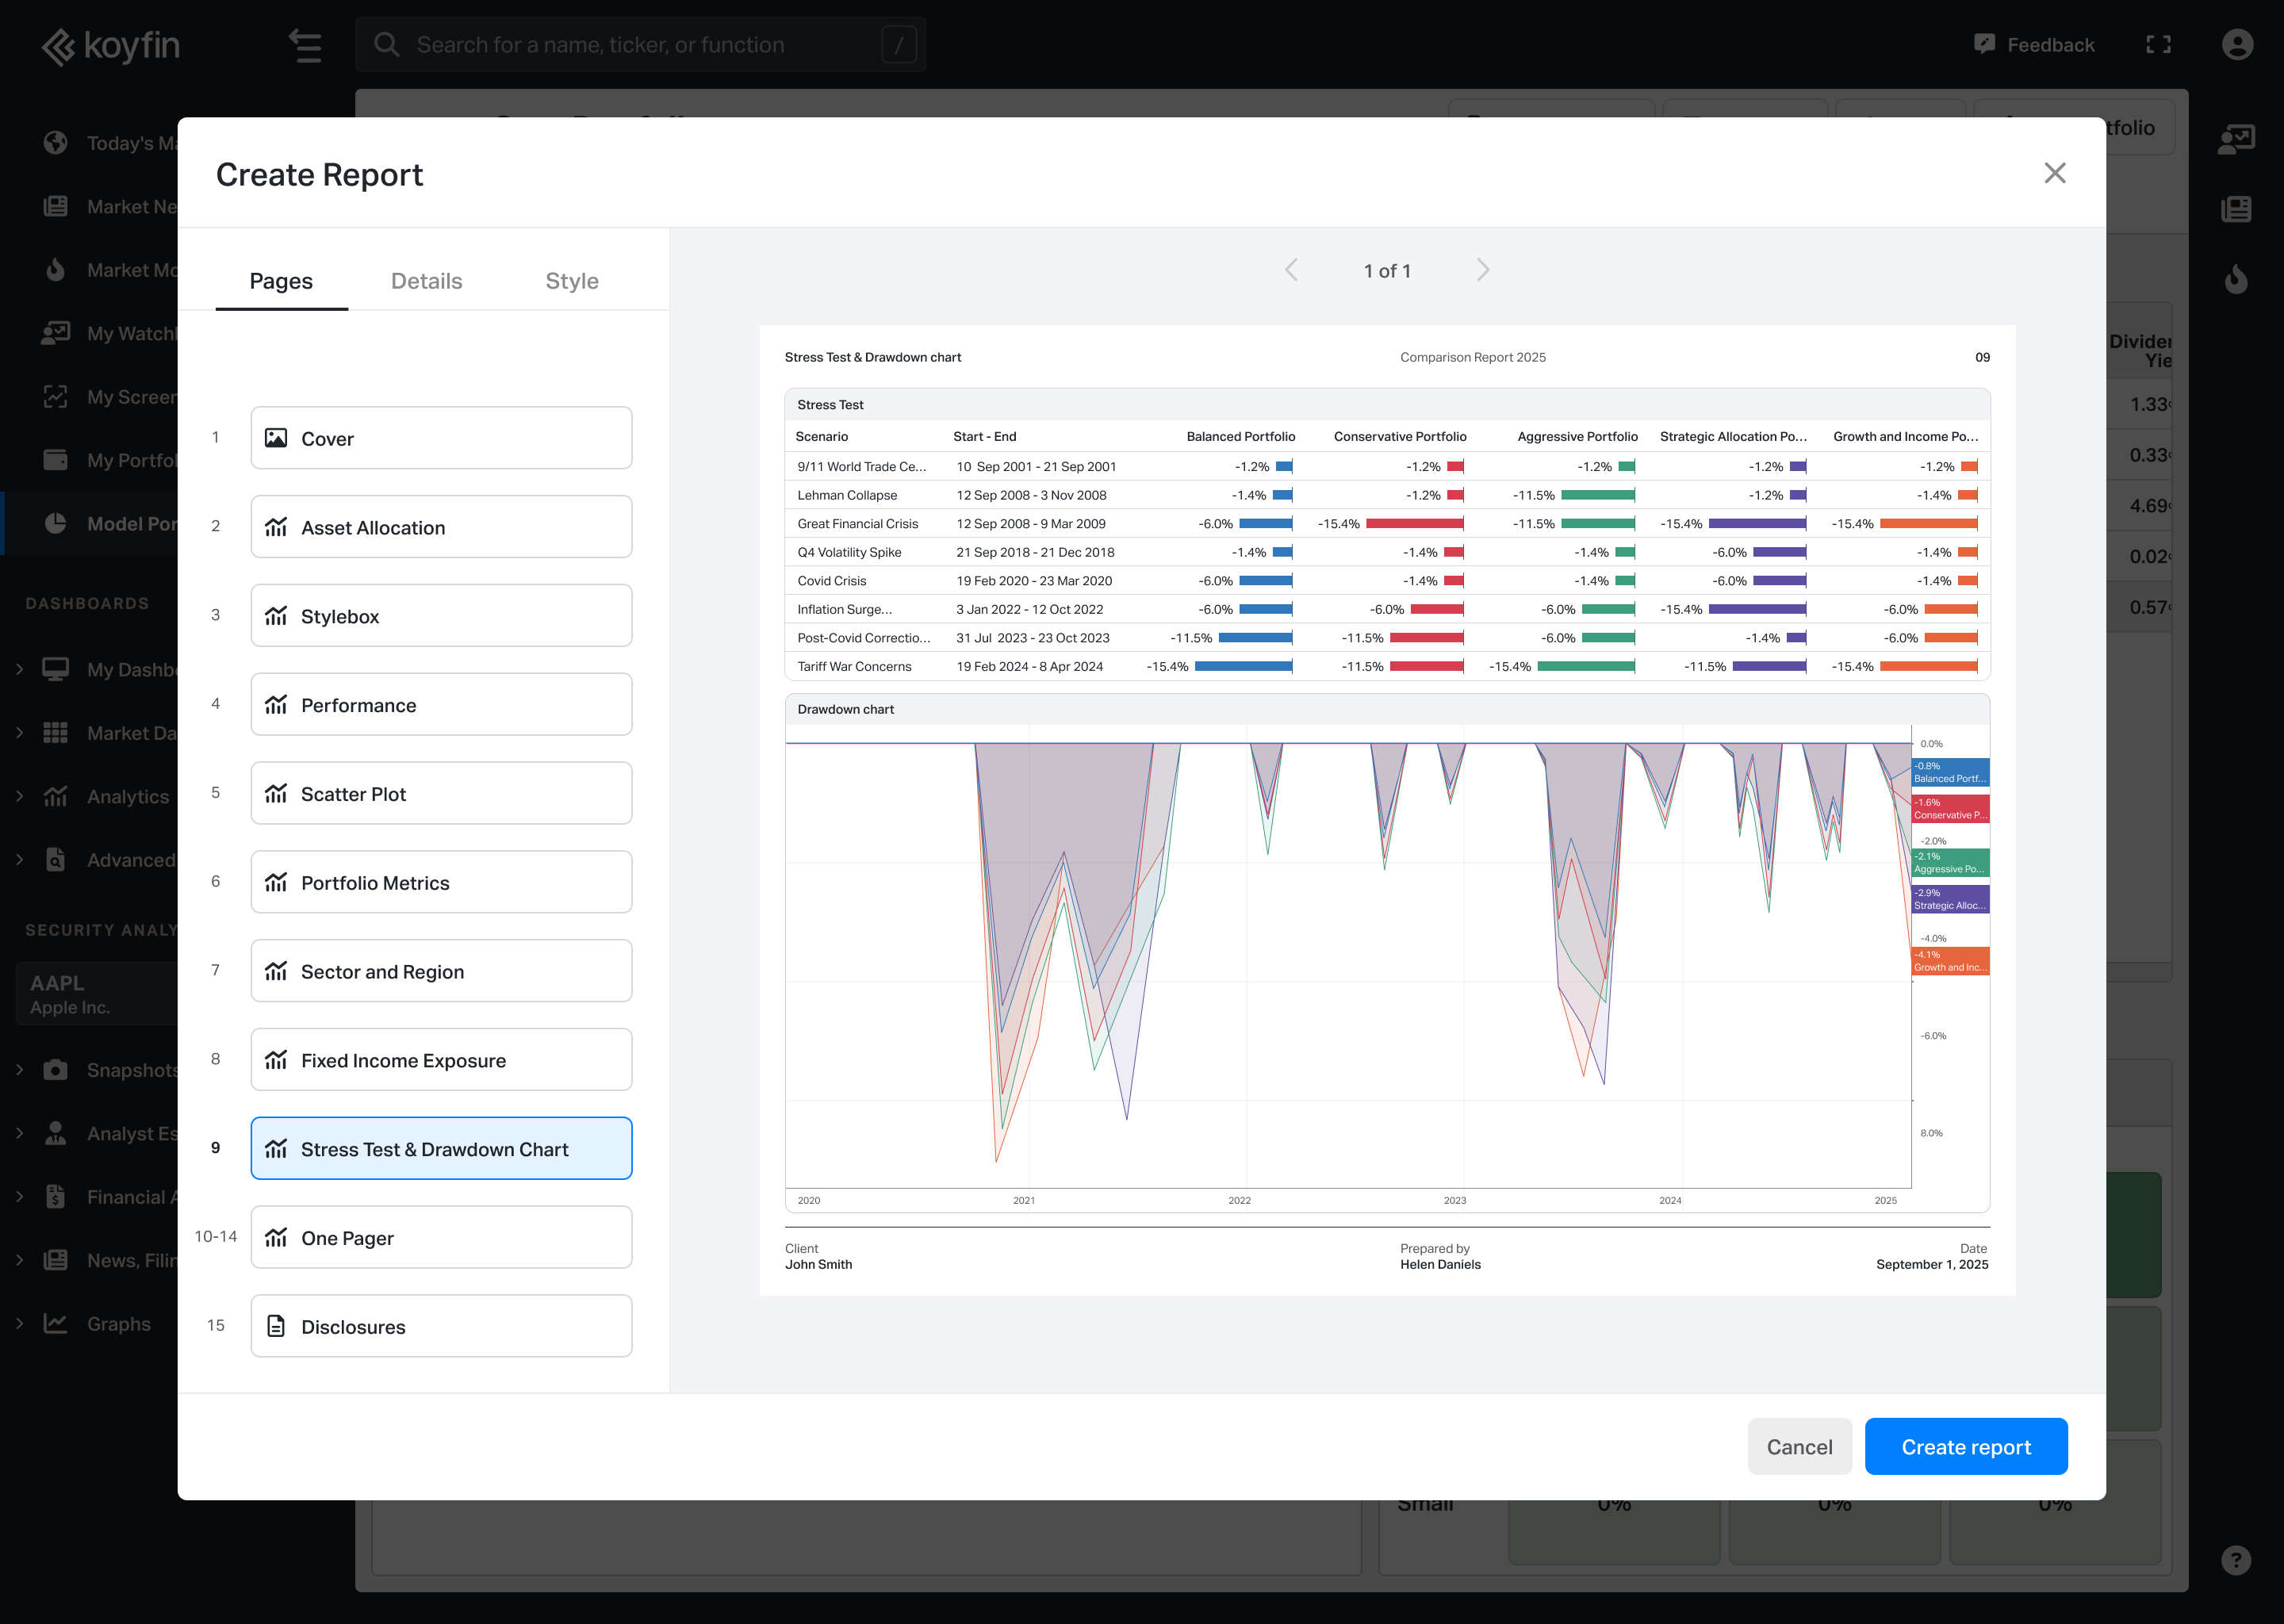
- Stress Test & Drawdowns: Shows historical stress test scenarios and maximum drawdown analysis.
- One Pagers: Generates an individual summary page for each selected security.
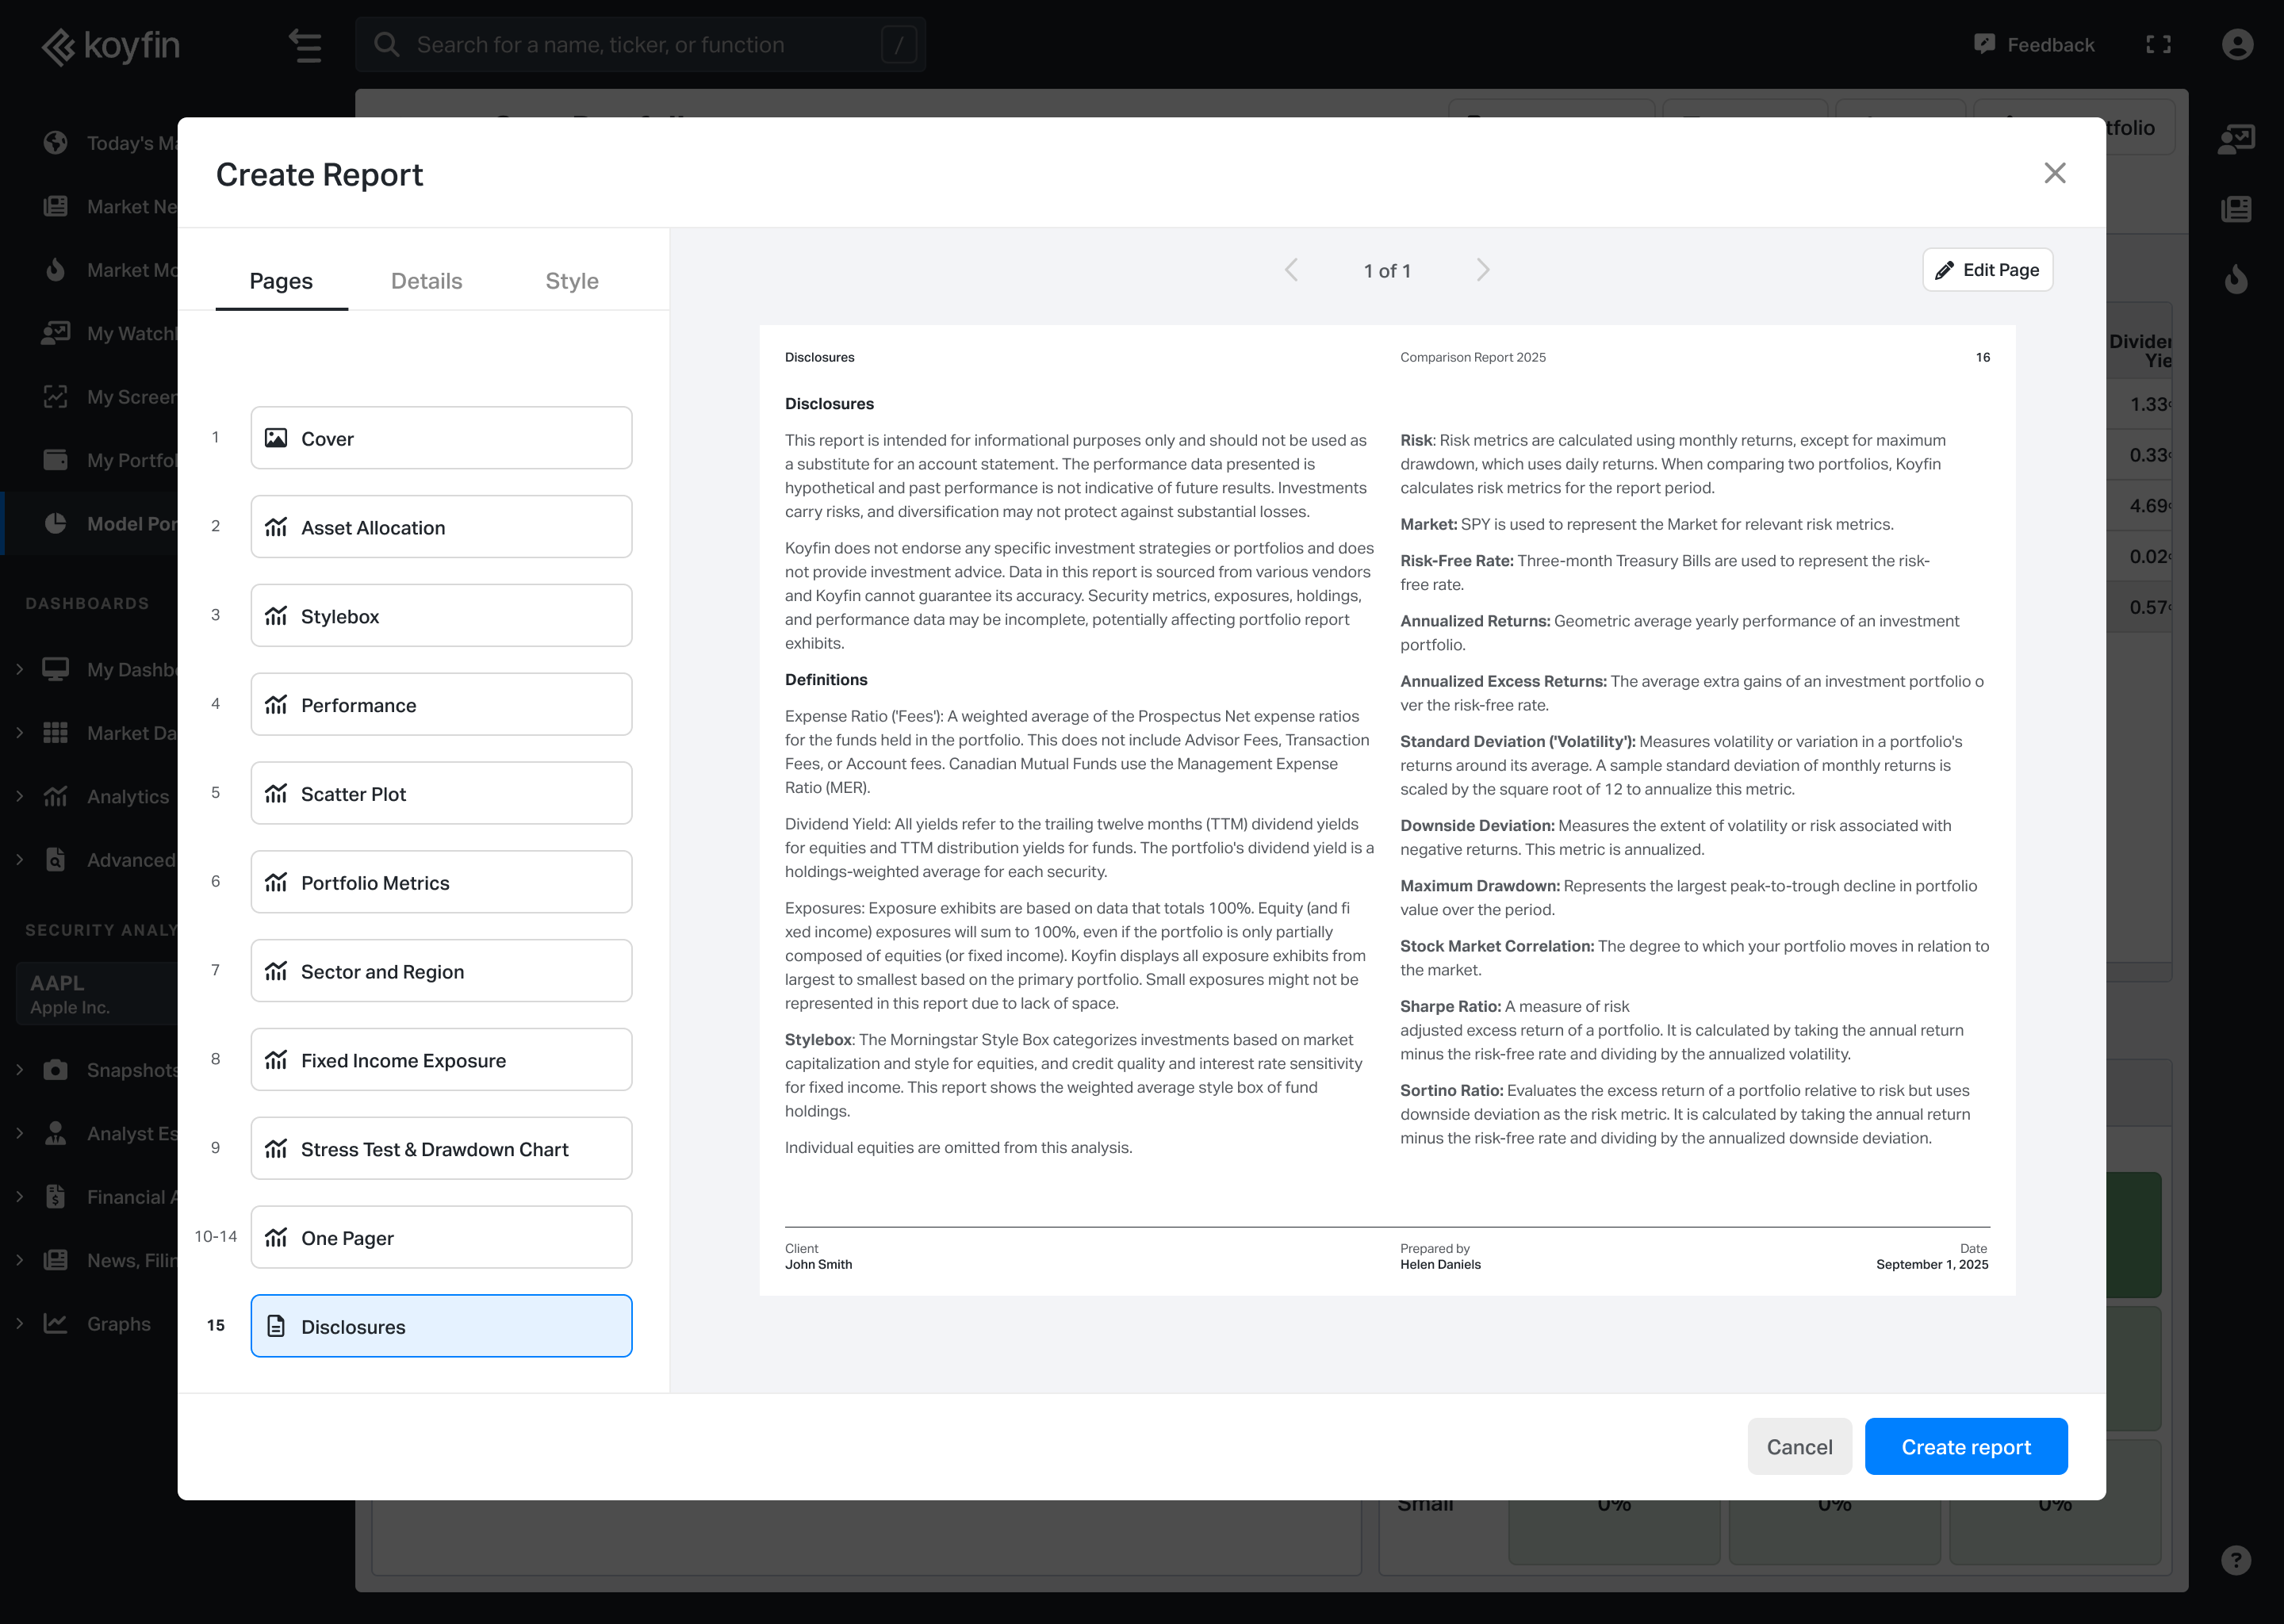
- Disclosures: Allows you to add or edit disclosure text for the report.
Customization
The Performance, Scatter Plot, Portfolio Metrics, and One Pagers pages include customization options. Click Edit Page in the top-right corner to adjust what is displayed.
You can also show or hide pages from the left sidebar.
- Use the Details tab to edit report details, including the title, client name, prepared by, and selected securities.
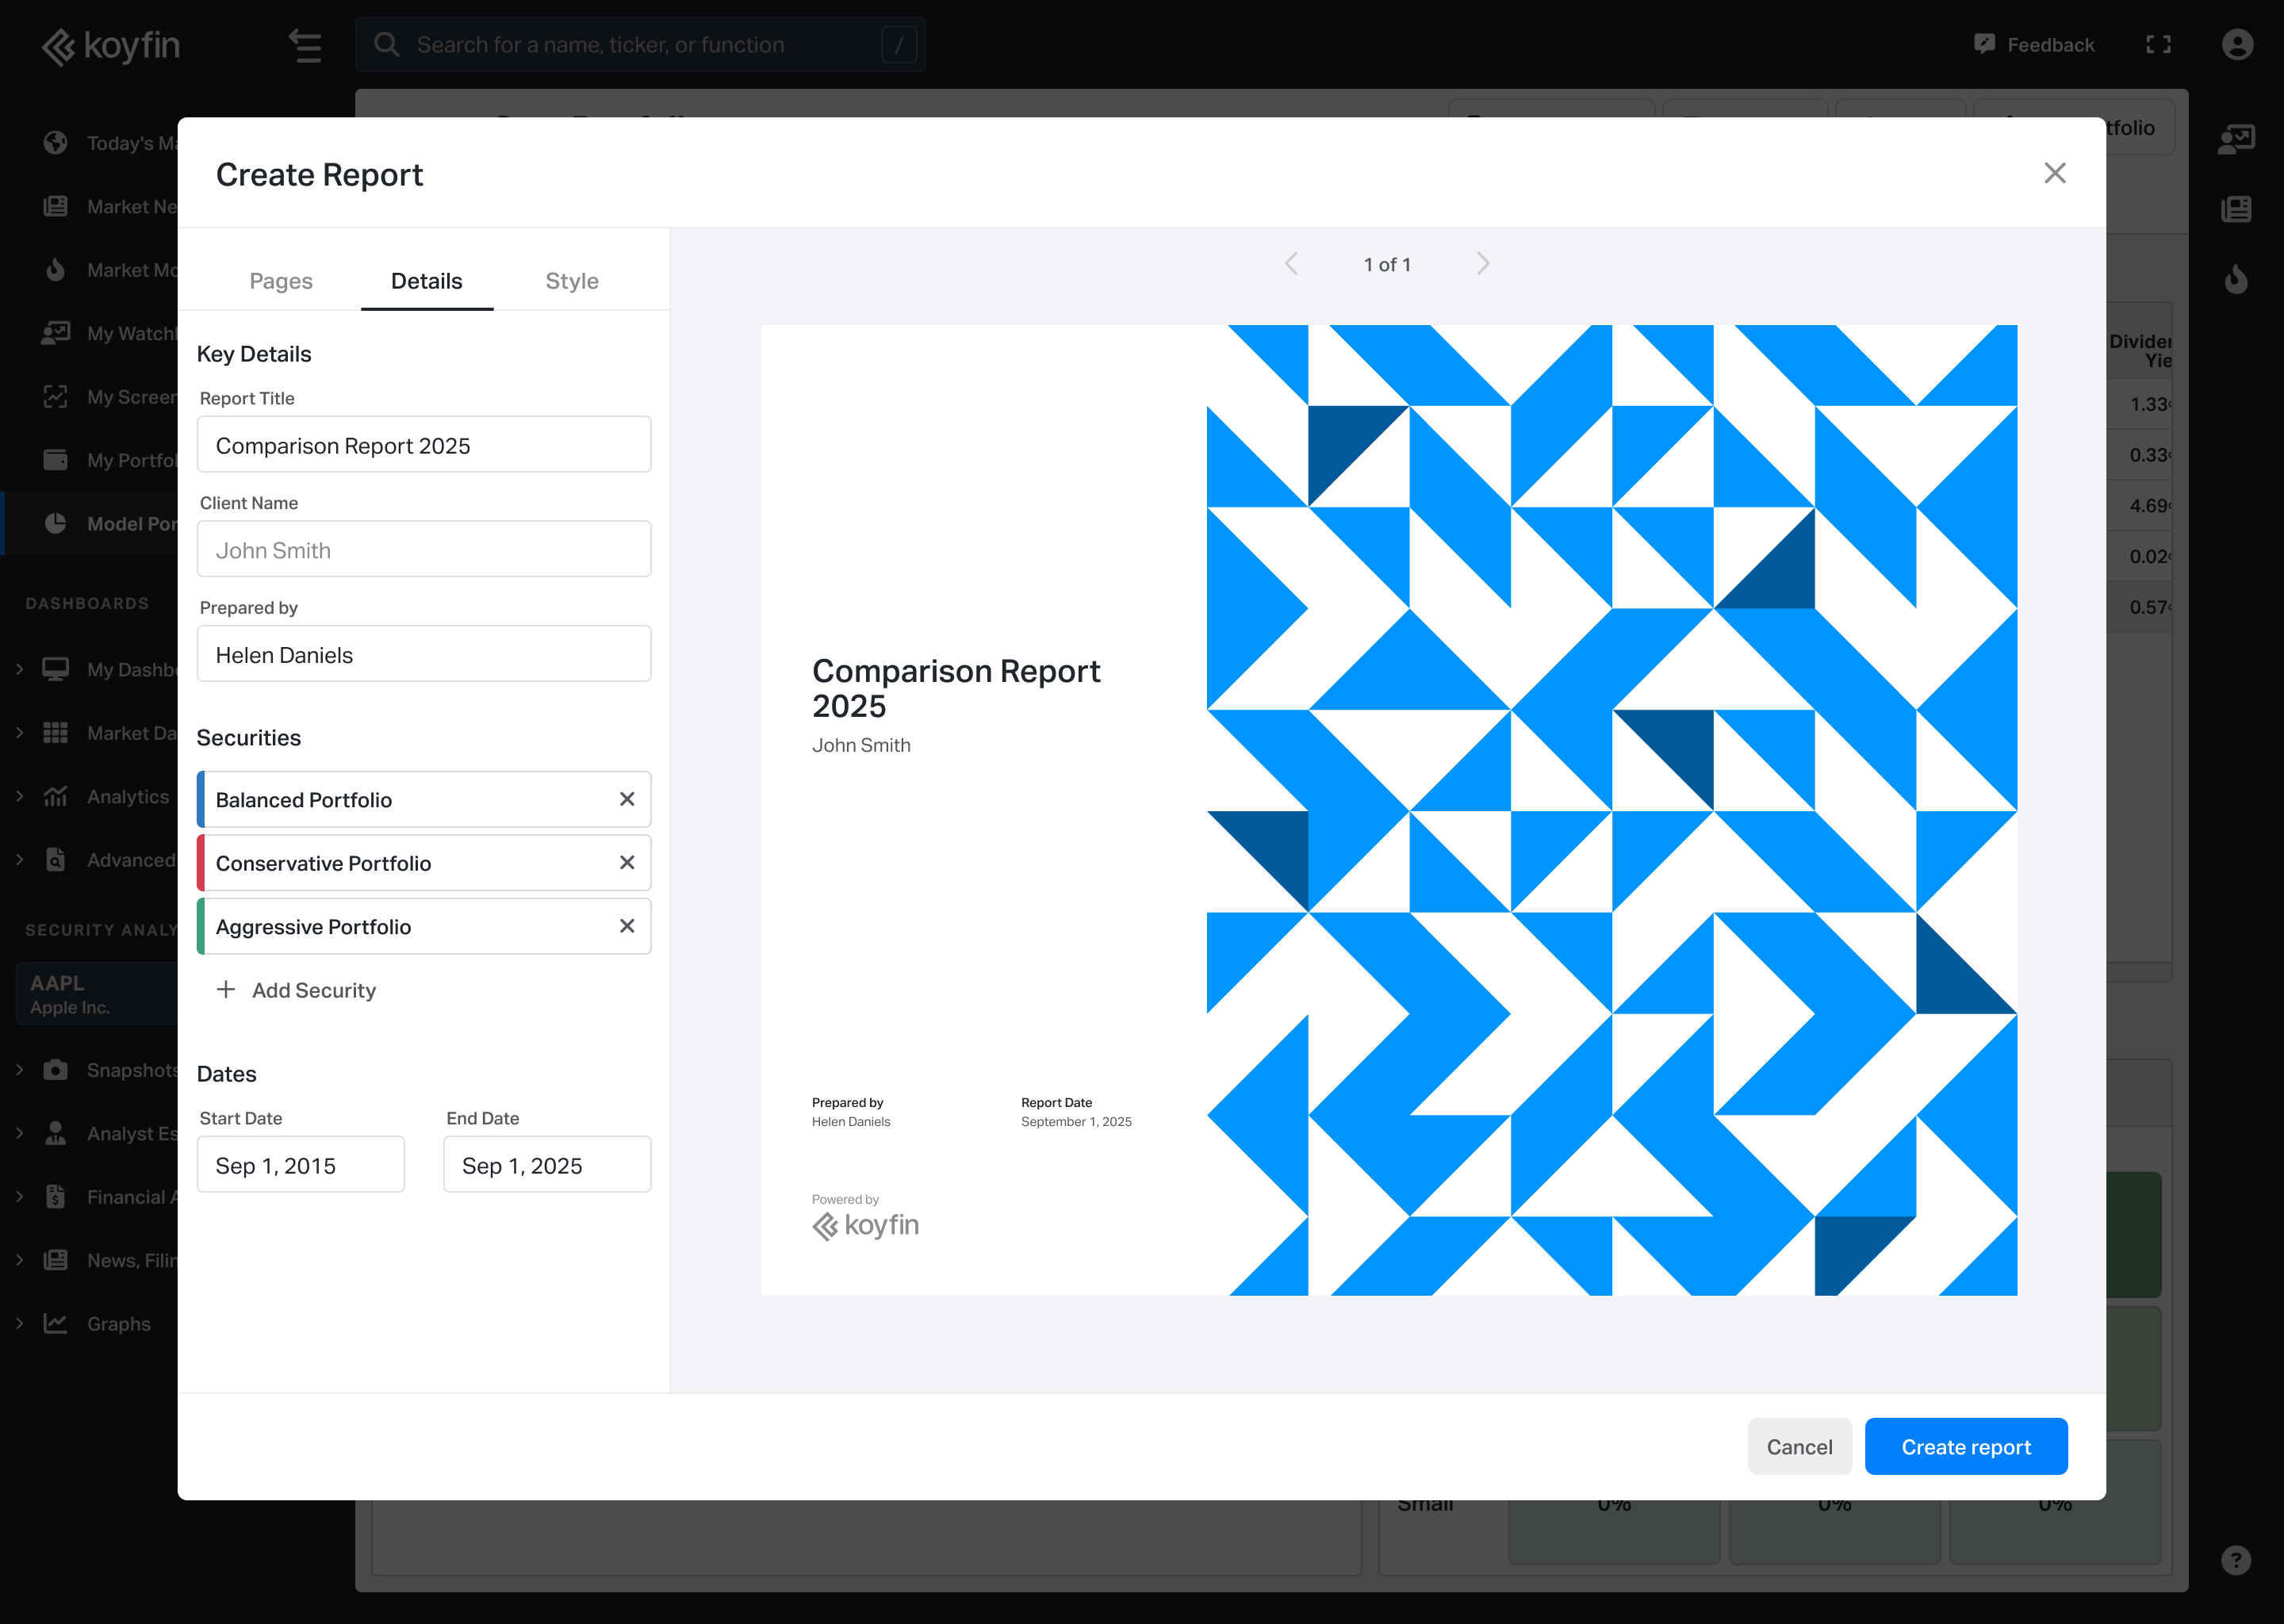
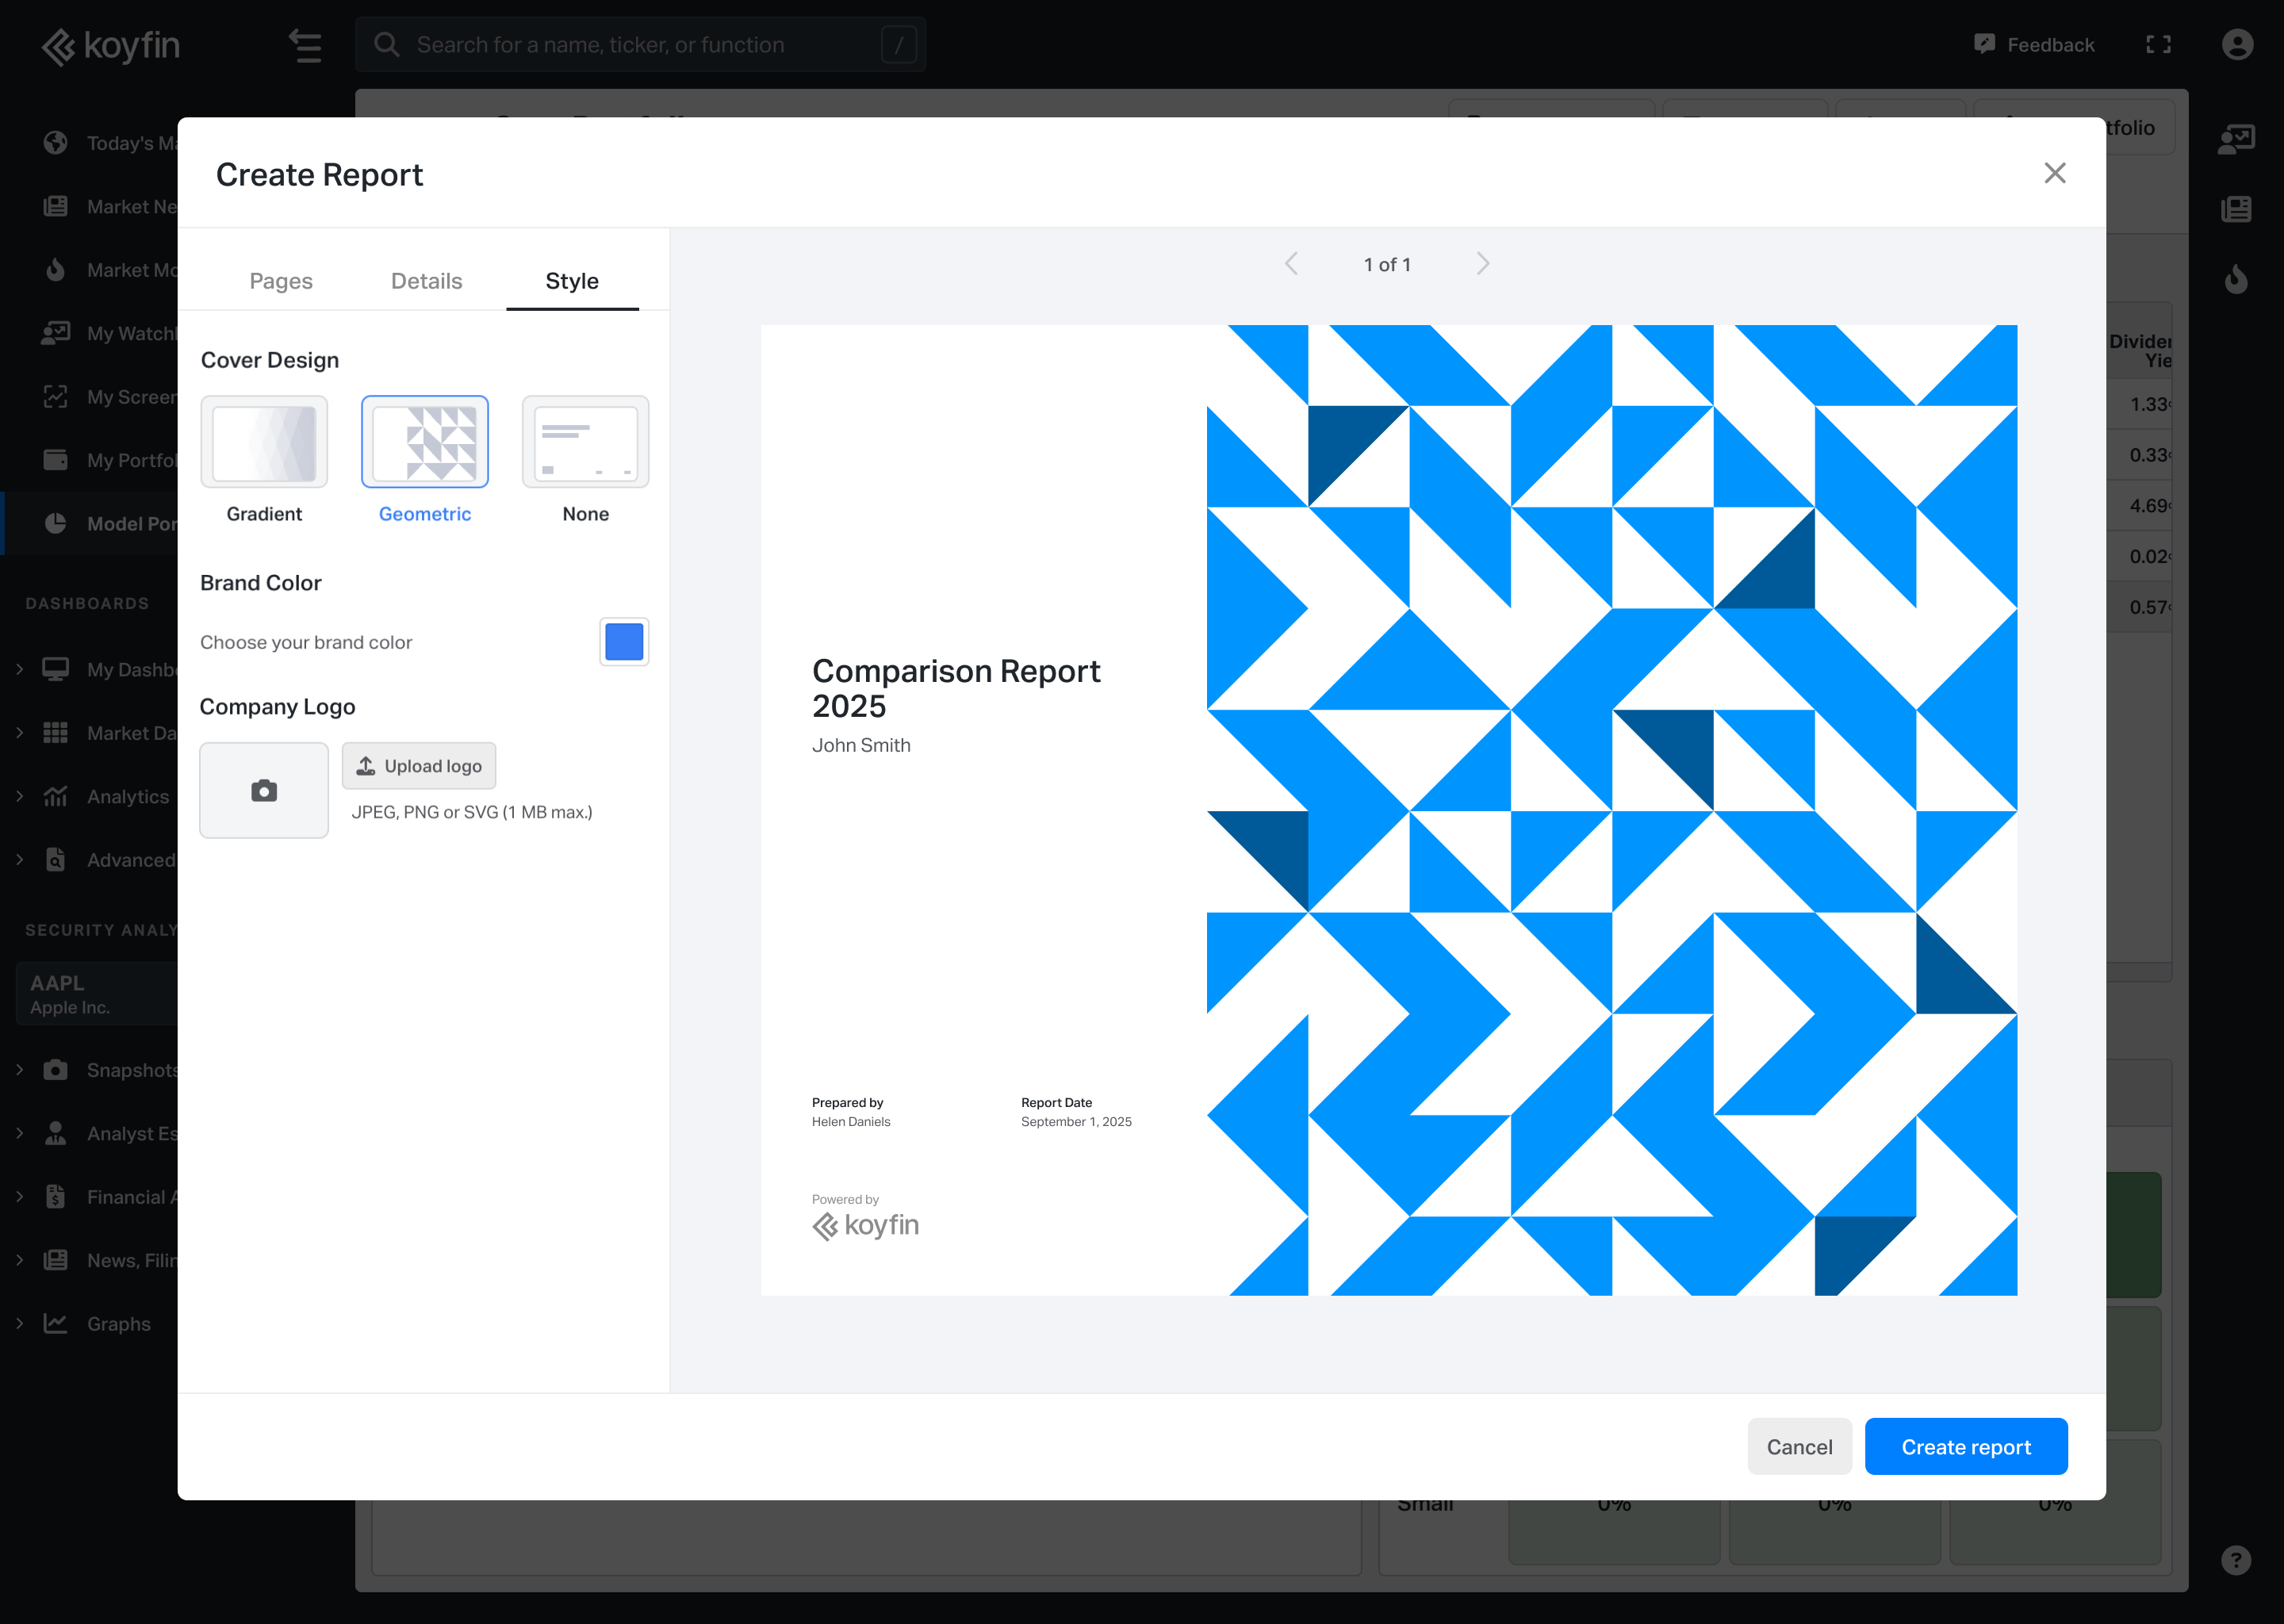
- Use the Style tab to adjust report colors, upload a logo, apply branding, and customize the cover page.
Availability
- Comparison Reports are available to Advisor Core and Advisor Pro users.
- Each Comparison Report counts toward your total monthly report limit.
Notes
- Comparison Reports do not use a primary portfolio. All selected securities are treated equally in the comparison.
- Each security is color-coded so it can be easily identified across report pages.
- Portfolio names appear exactly as they are named in the platform and cannot be changed within the report.