We've added new ways to customize how you present portfolio data in Client reports: a Breakdown Table for visualizing portfolio structure, and customizable columns in the Top Holdings table.
Breakdown Table for Households and Portfolios
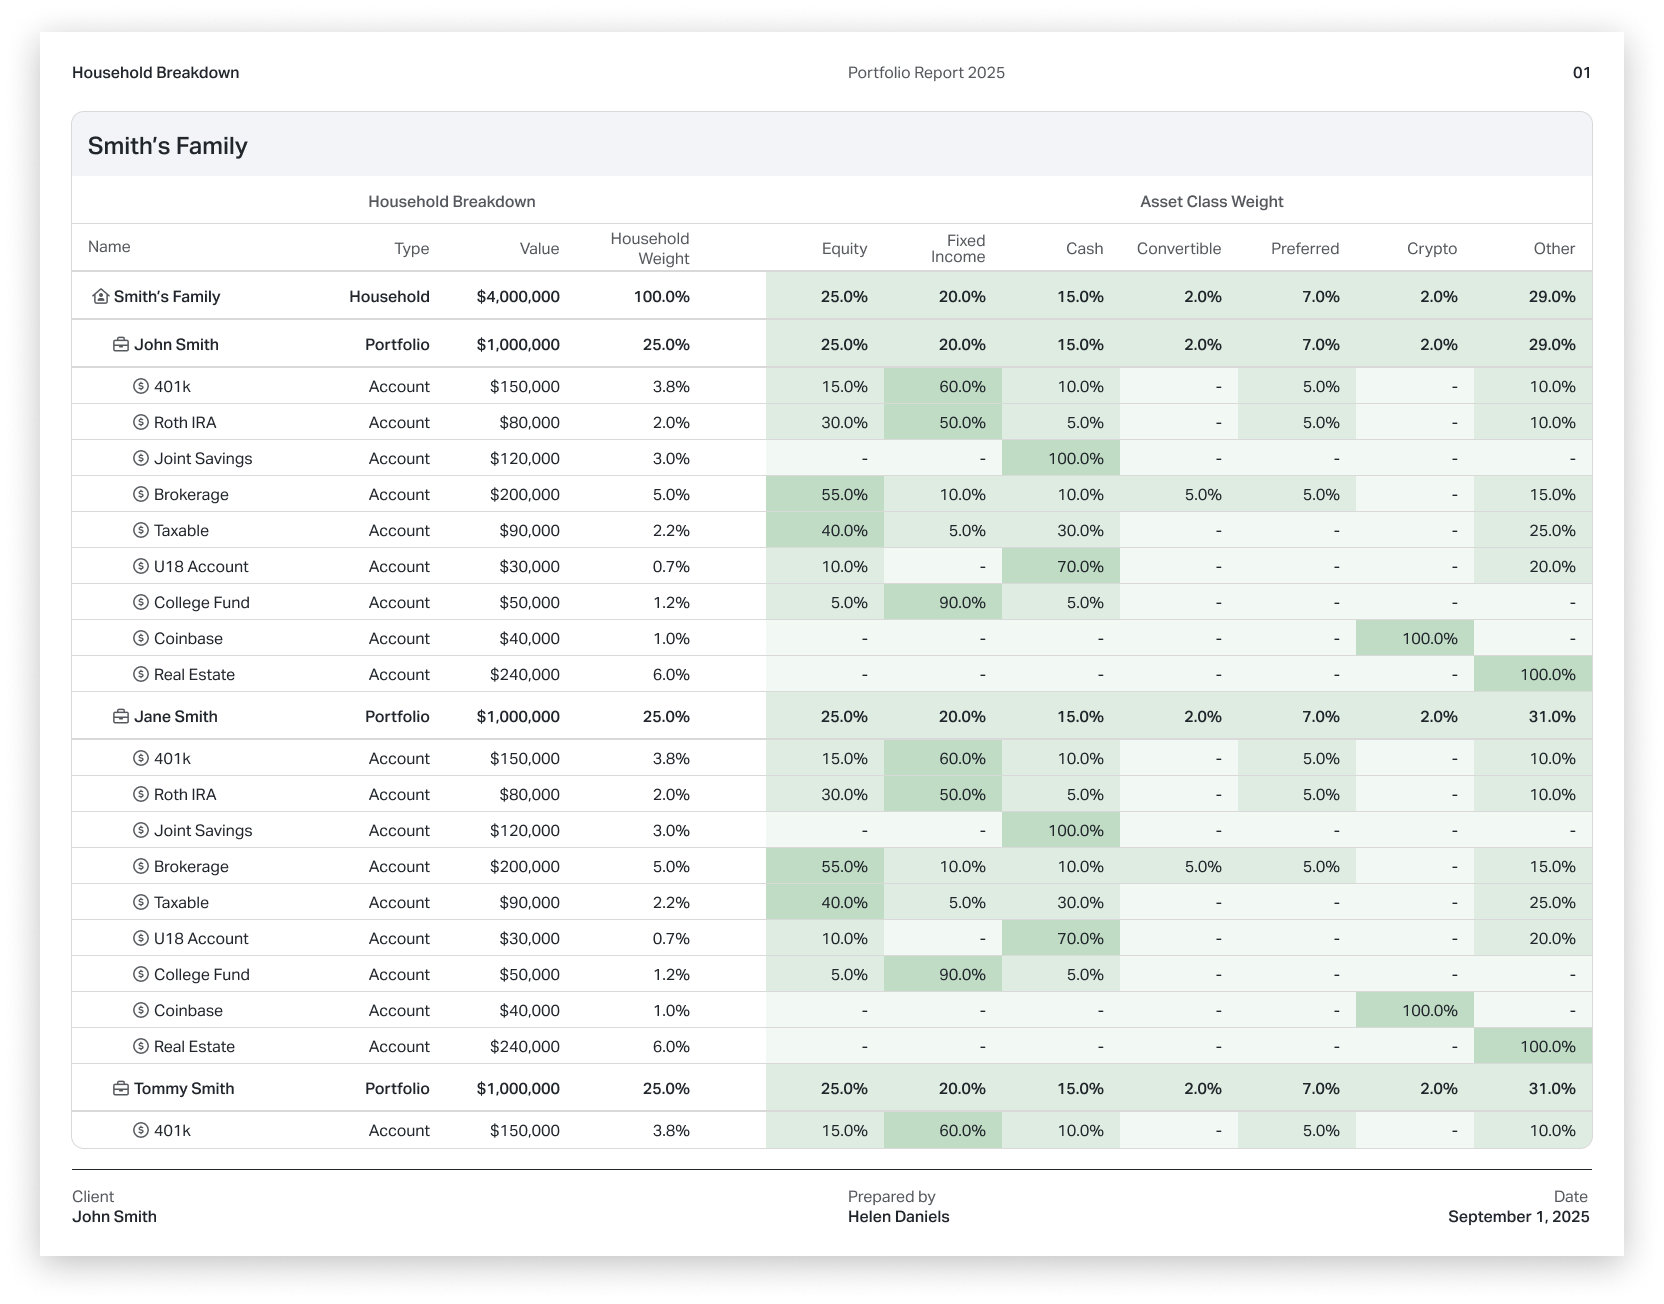
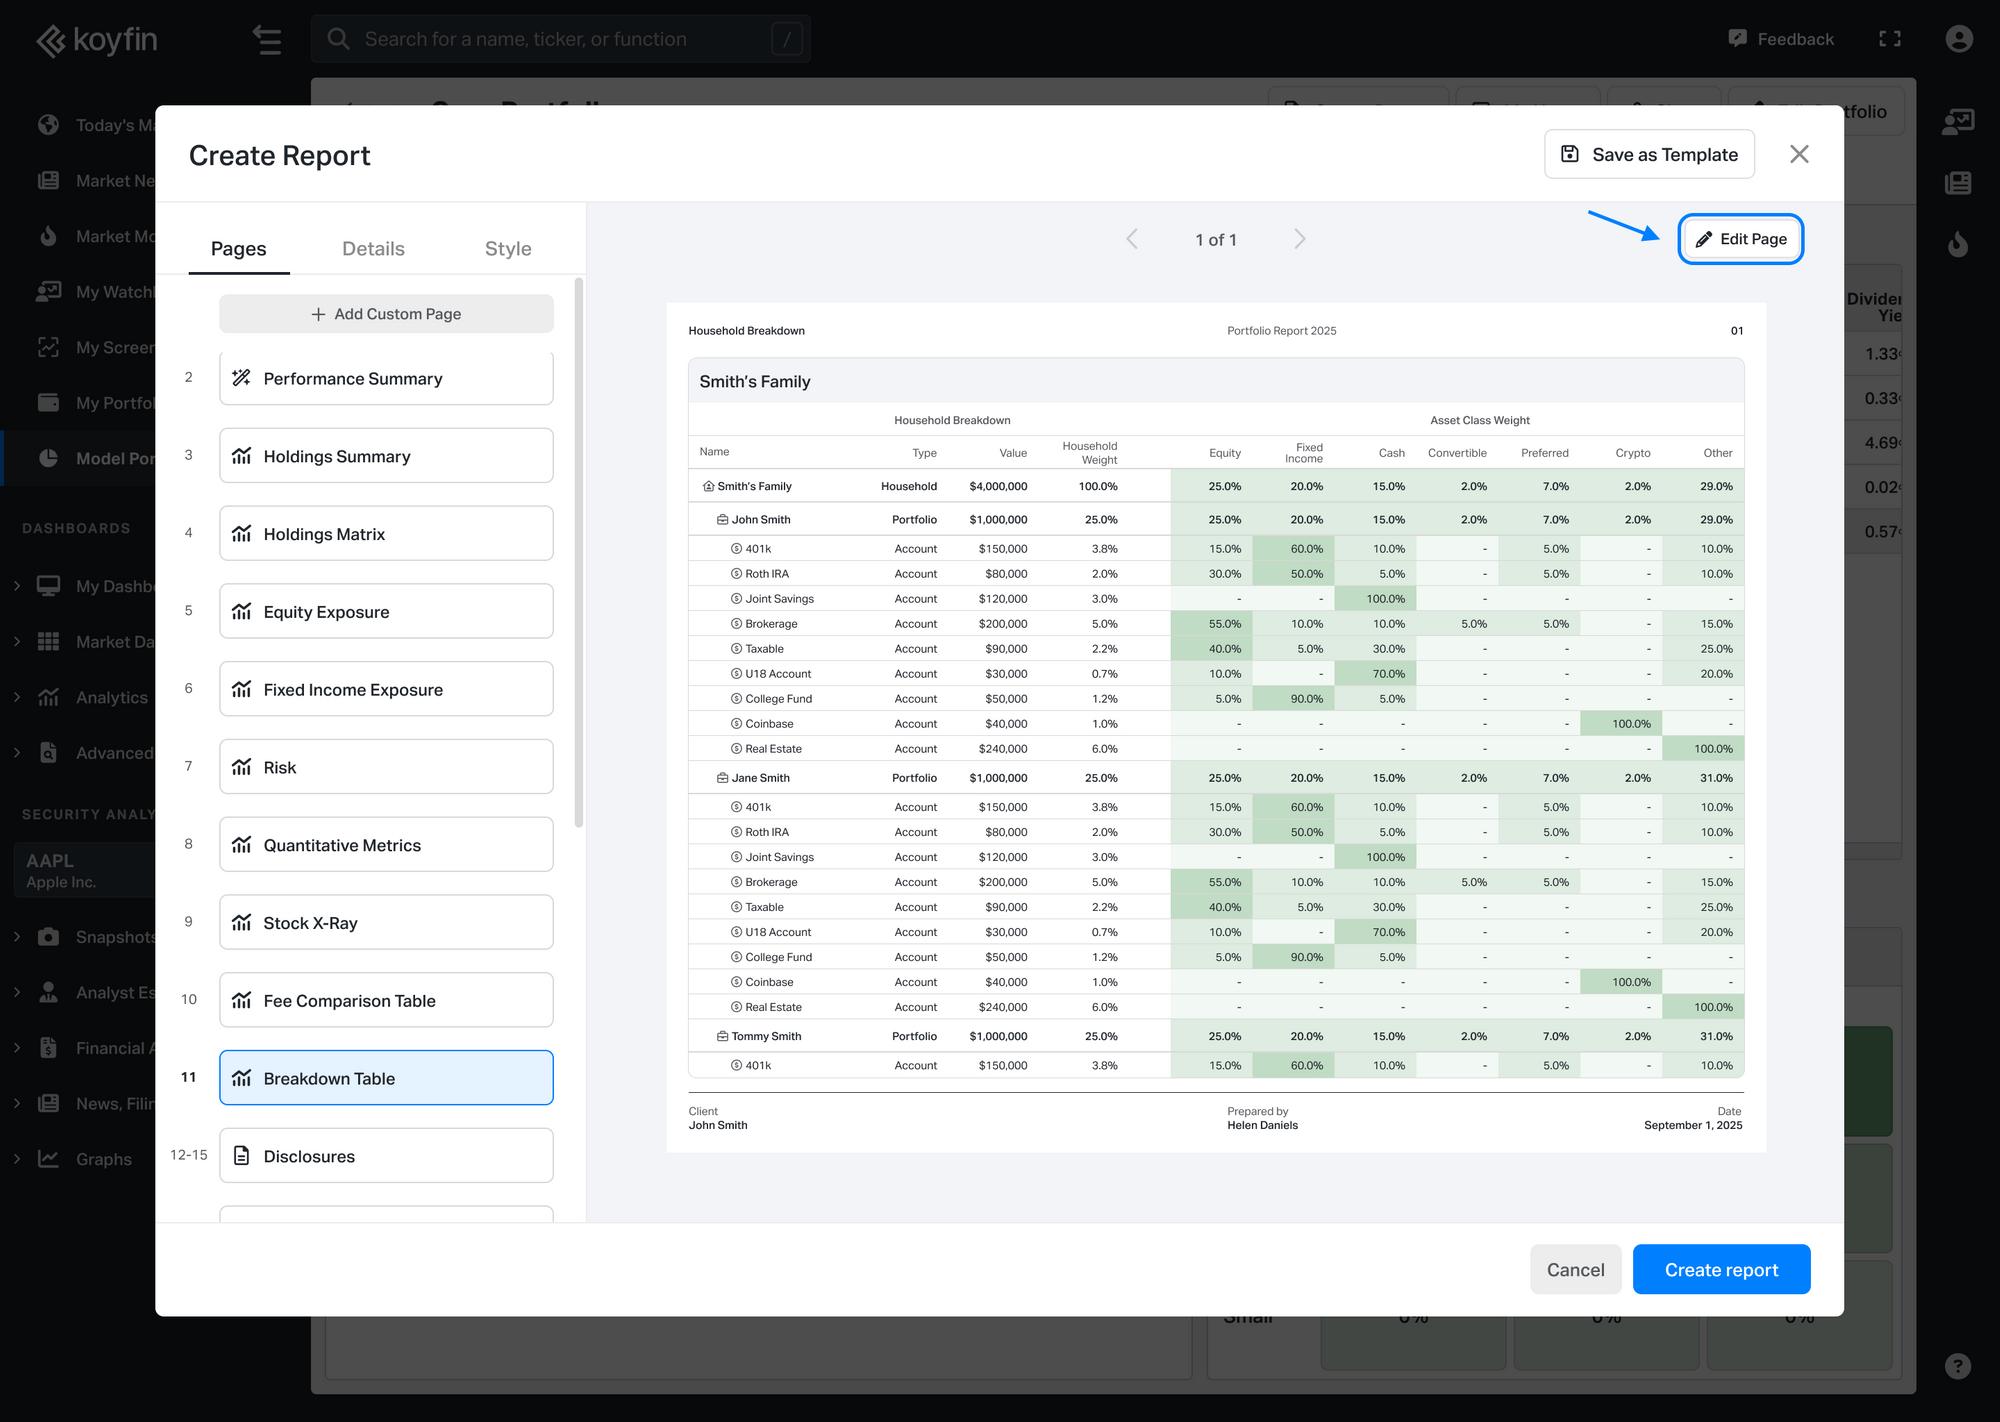
See exactly how your client portfolios are structured with the new Breakdown Table, a new page available in Client Reports.
This page shows a clear hierarchy of your Household, underlying Portfolios, and Accounts, including:
- Name and structure level
- Market value
- Weight relative to the top-level entity
- Asset class allocation for each tier
Color scaling highlights allocation concentrations at a glance, with darker shades indicating higher weights.
Use Edit Page in the top right corner to show or hide the primary or comparison portfolio.
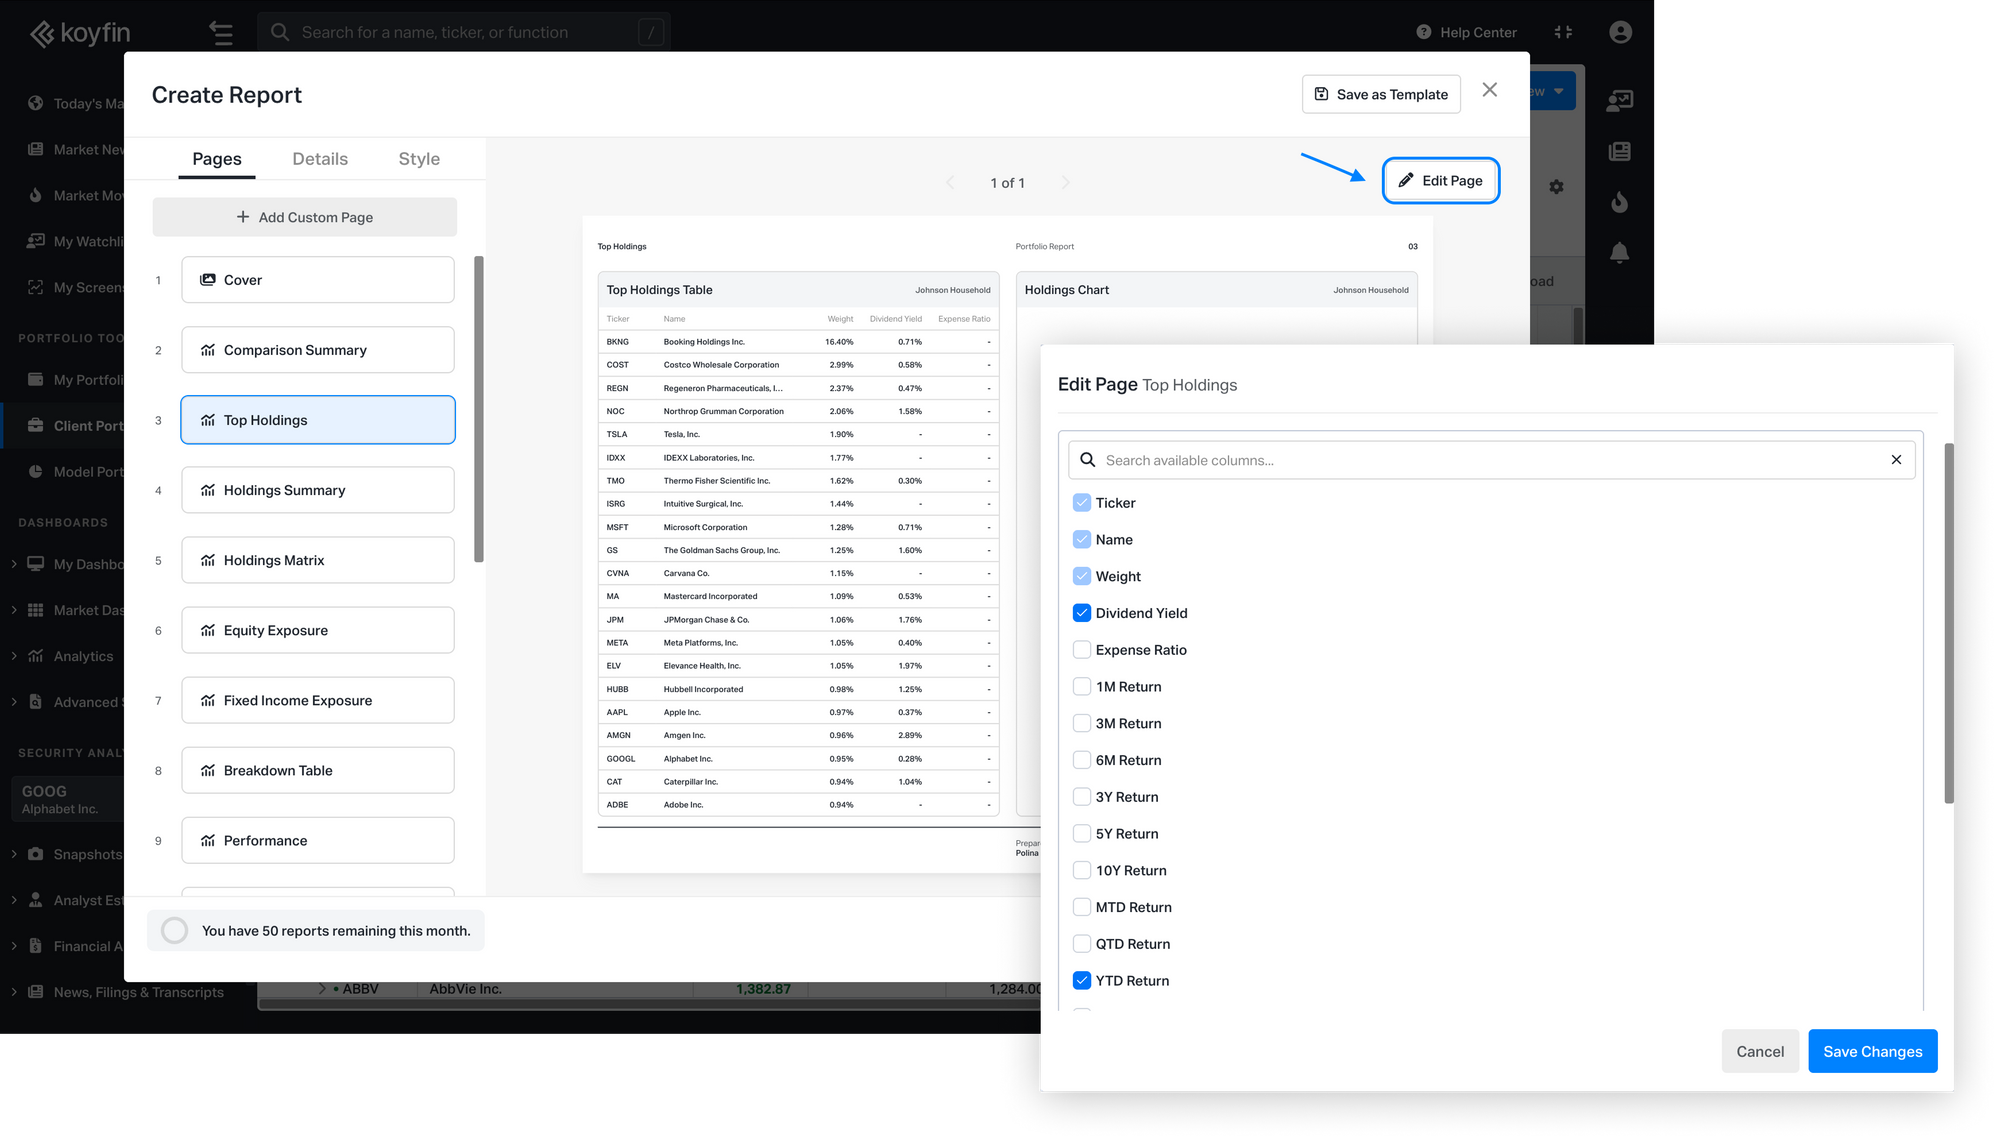
Customizable columns in Top Holdings table
You can now choose which metrics appear in the Top Holdings table in client reports.
By default, the table shows Ticker, Name, Weight, Dividend Yield, and Expense Ratio. With the new edit option, you can replace Dividend Yield and Expense Ratio with other metrics that better match how you present holdings to clients.
To customize, open the Top Holdings page and click Edit Page in the top right corner to select your preferred columns.