We’ve added several updates to make reporting tools more customizable, visual, and professional. Here’s an overview of what’s new and how to use each enhancement.
- New Custom Pages
- Customizable Quantitative Metrics
- Net and Gross Performance
- New Holdings Table Page
- New Top Holdings Page
- Updated Holdings Summary Page
1. New Custom Pages
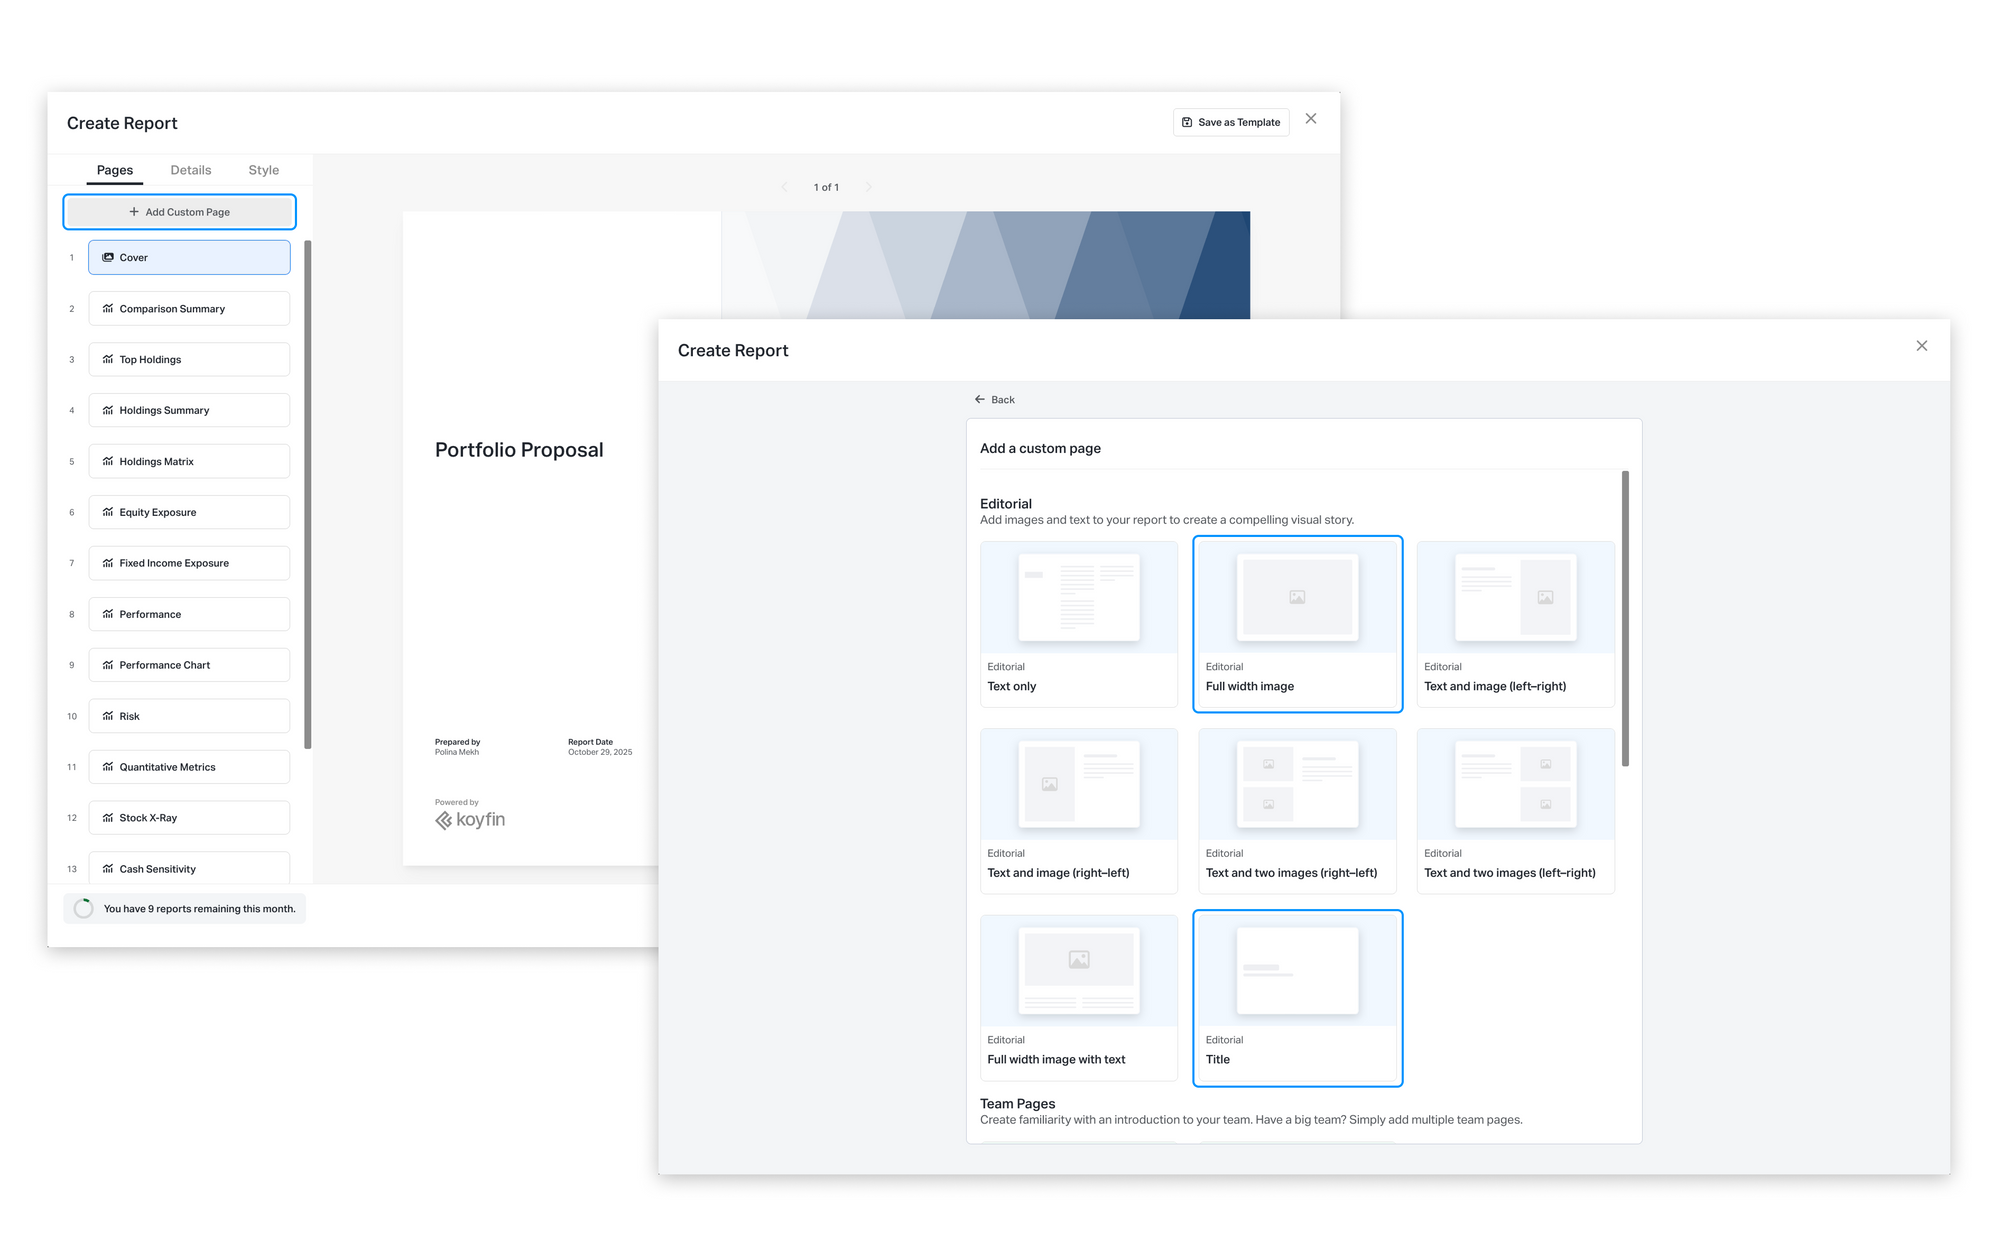
We’ve added two new Editorial pages to make reports more polished and better structured with clear section breaks:
- Full-width Image Page: Add large visuals like branded graphics, charts, or photos.
- Title Slide: Add an editable title and subtitle to separate report sections (e.g., Portfolio Overview or Market Outlook).

Where to find it:
In the report editor, click + Add Custom Page in the left sidebar, then choose your preferred layout. The Title Slide and Full Width Image are found in the Editorial section.
2. Customizable Quantitative Metrics
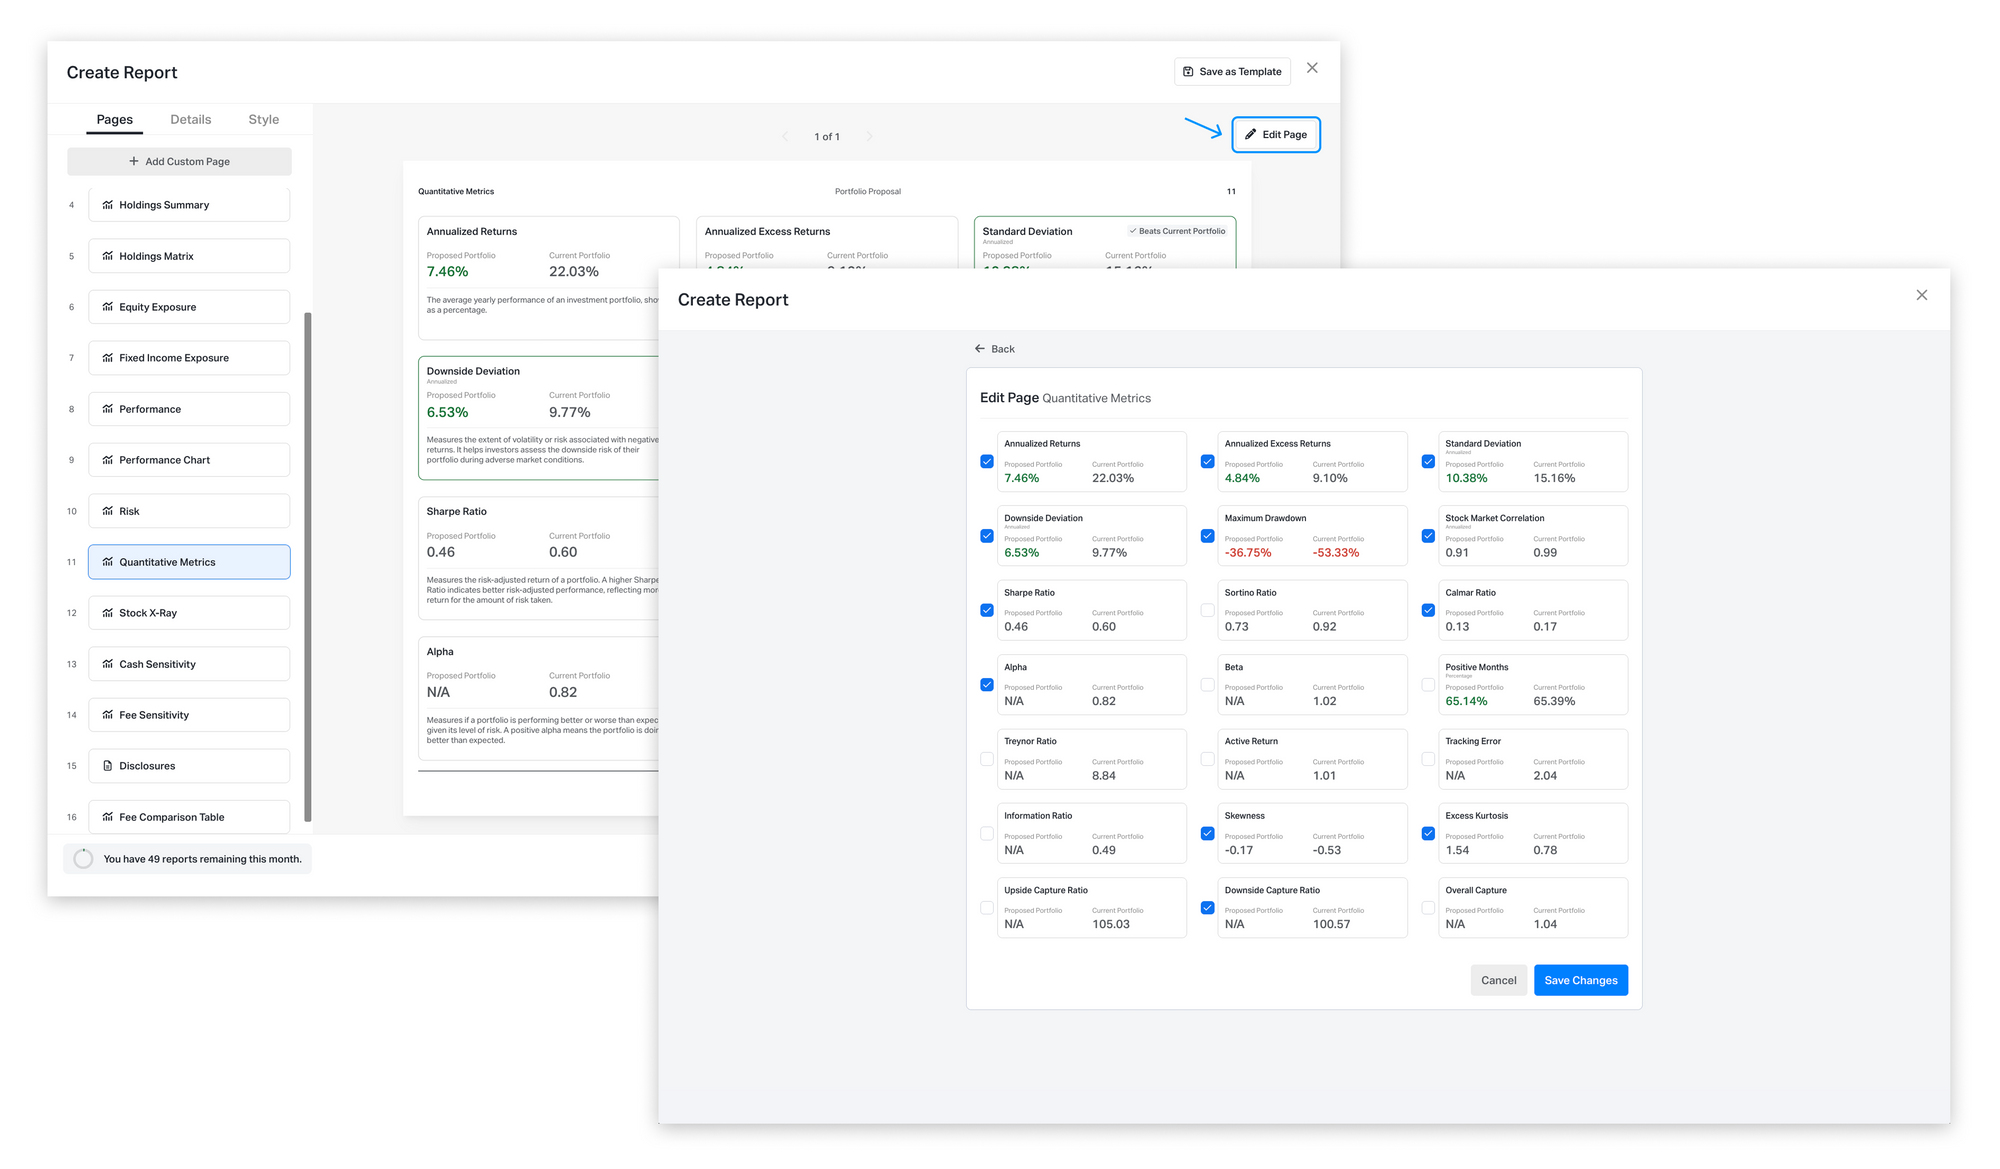
We added 9 new metrics, as well as the ability to choose which quantitative metrics appear in your reports to highlight what’s most relevant to each client.
New metrics:
- Treynor Ratio
- Active Return
- Tracking Error
- Information Ratio
- Skewness
- Excess Kurtosis
- Upside Capture Ratio
- Downside Capture Ratio
- Overall Capture
Where to find it:
Go to the Quantitative Metrics page in the report editor, click “Edit Page” (top-right corner) to select or deselect the metrics.
3. Net and Gross Performance
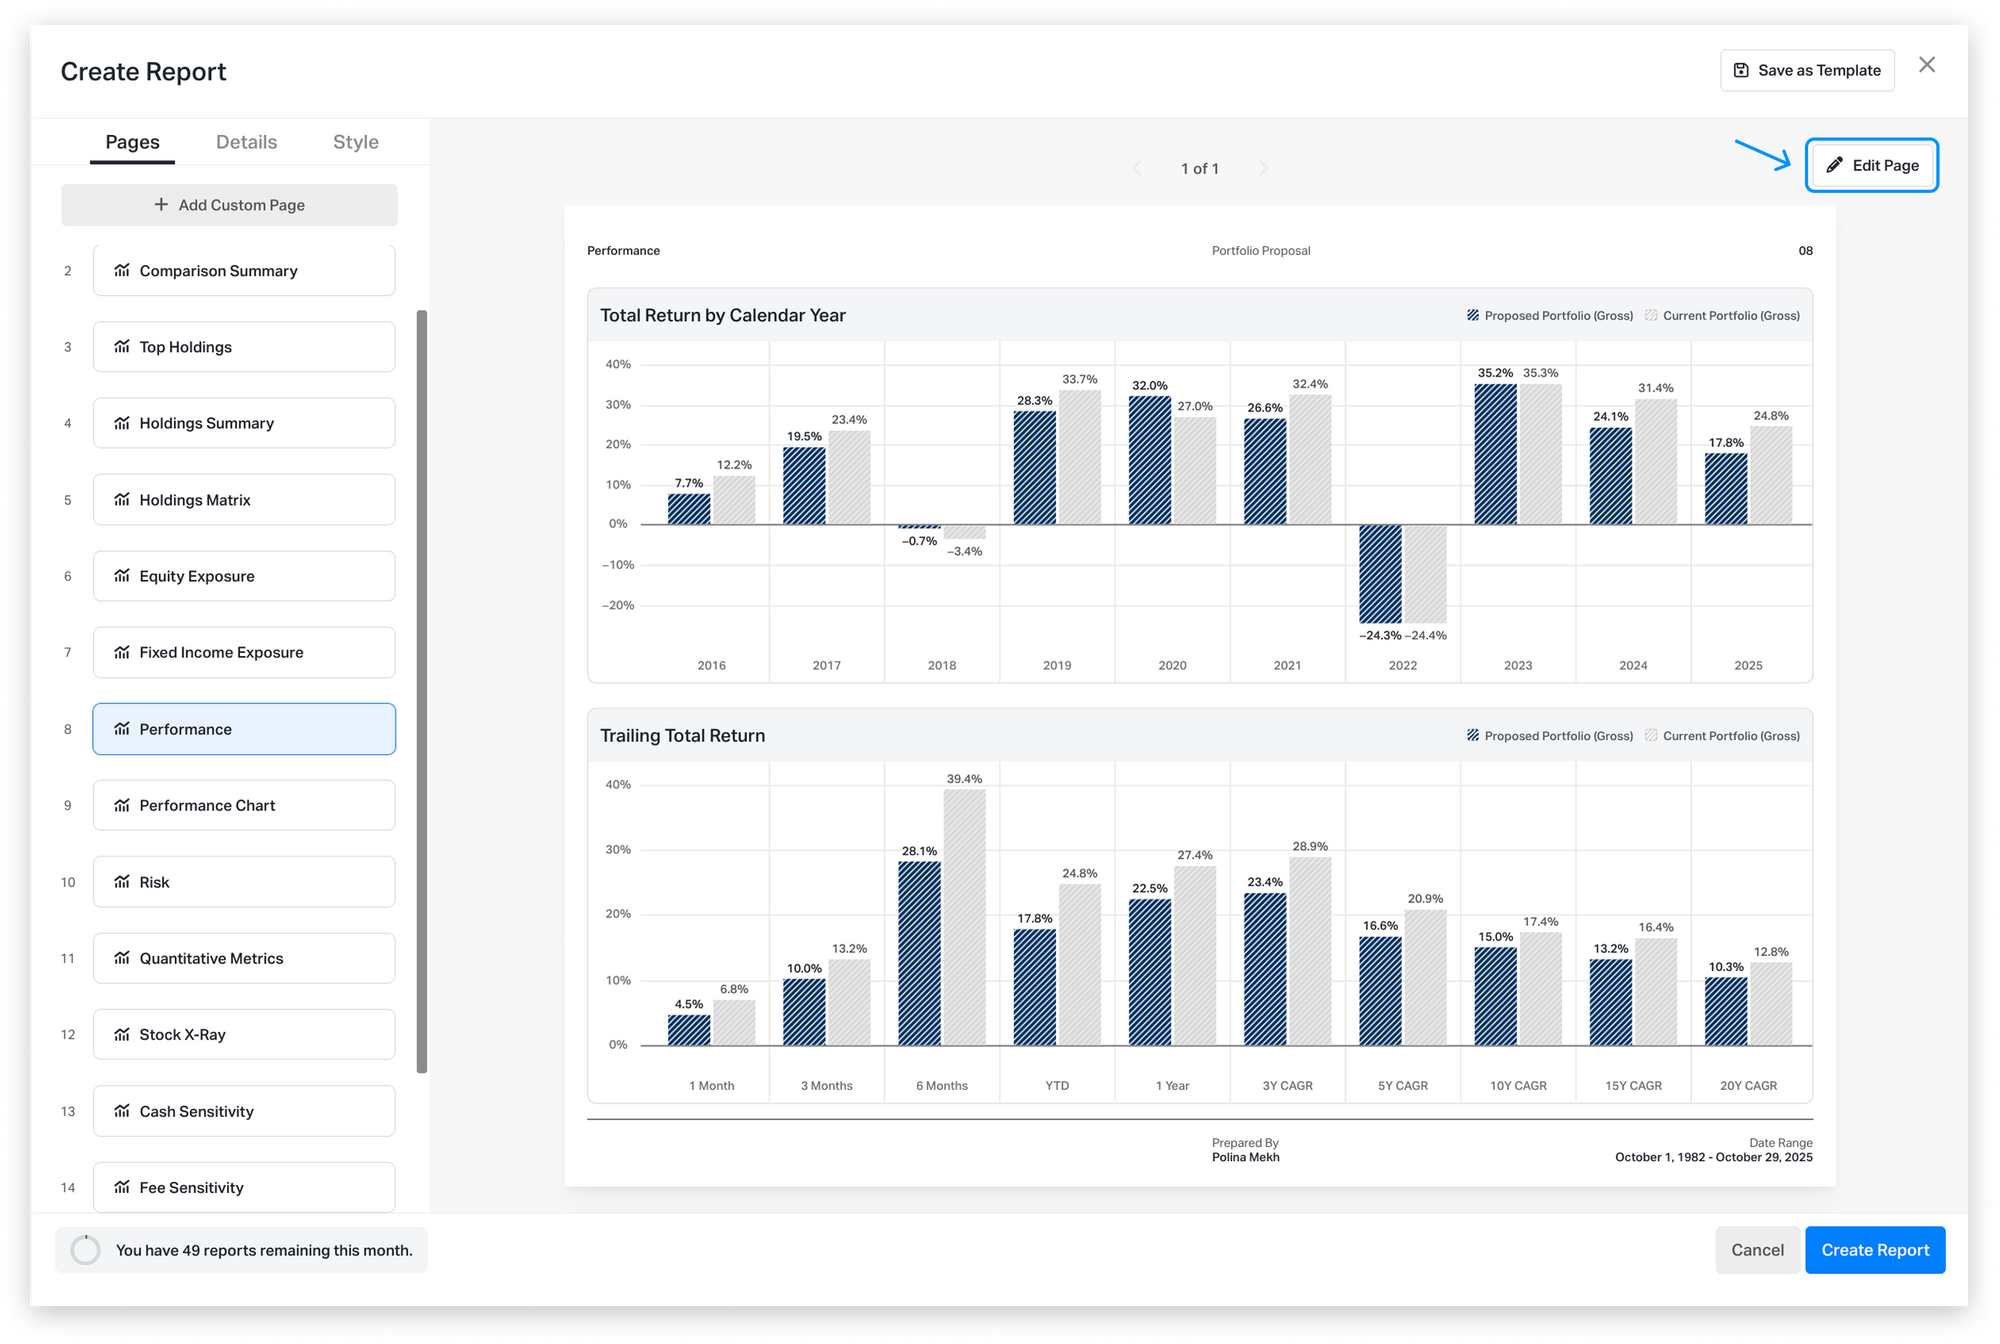
You can now display Net (including fees) and Gross (excluding fees) performance in your reports.
Where to find it:
Go to the Performance or Performance Chart pages in the report editor, click “Edit Page” (top-right corner), and choose to display Net, Gross, or Both.
4. New Holdings Table Page
The Holdings Table is a new report page that lists all underlying positions in the selected portfolio. When enabled, the table also shows the secondary portfolio to make comparisons easier.
It gives clients a clear view of what they own and helps advisors explain portfolio construction with more detail and transparency.
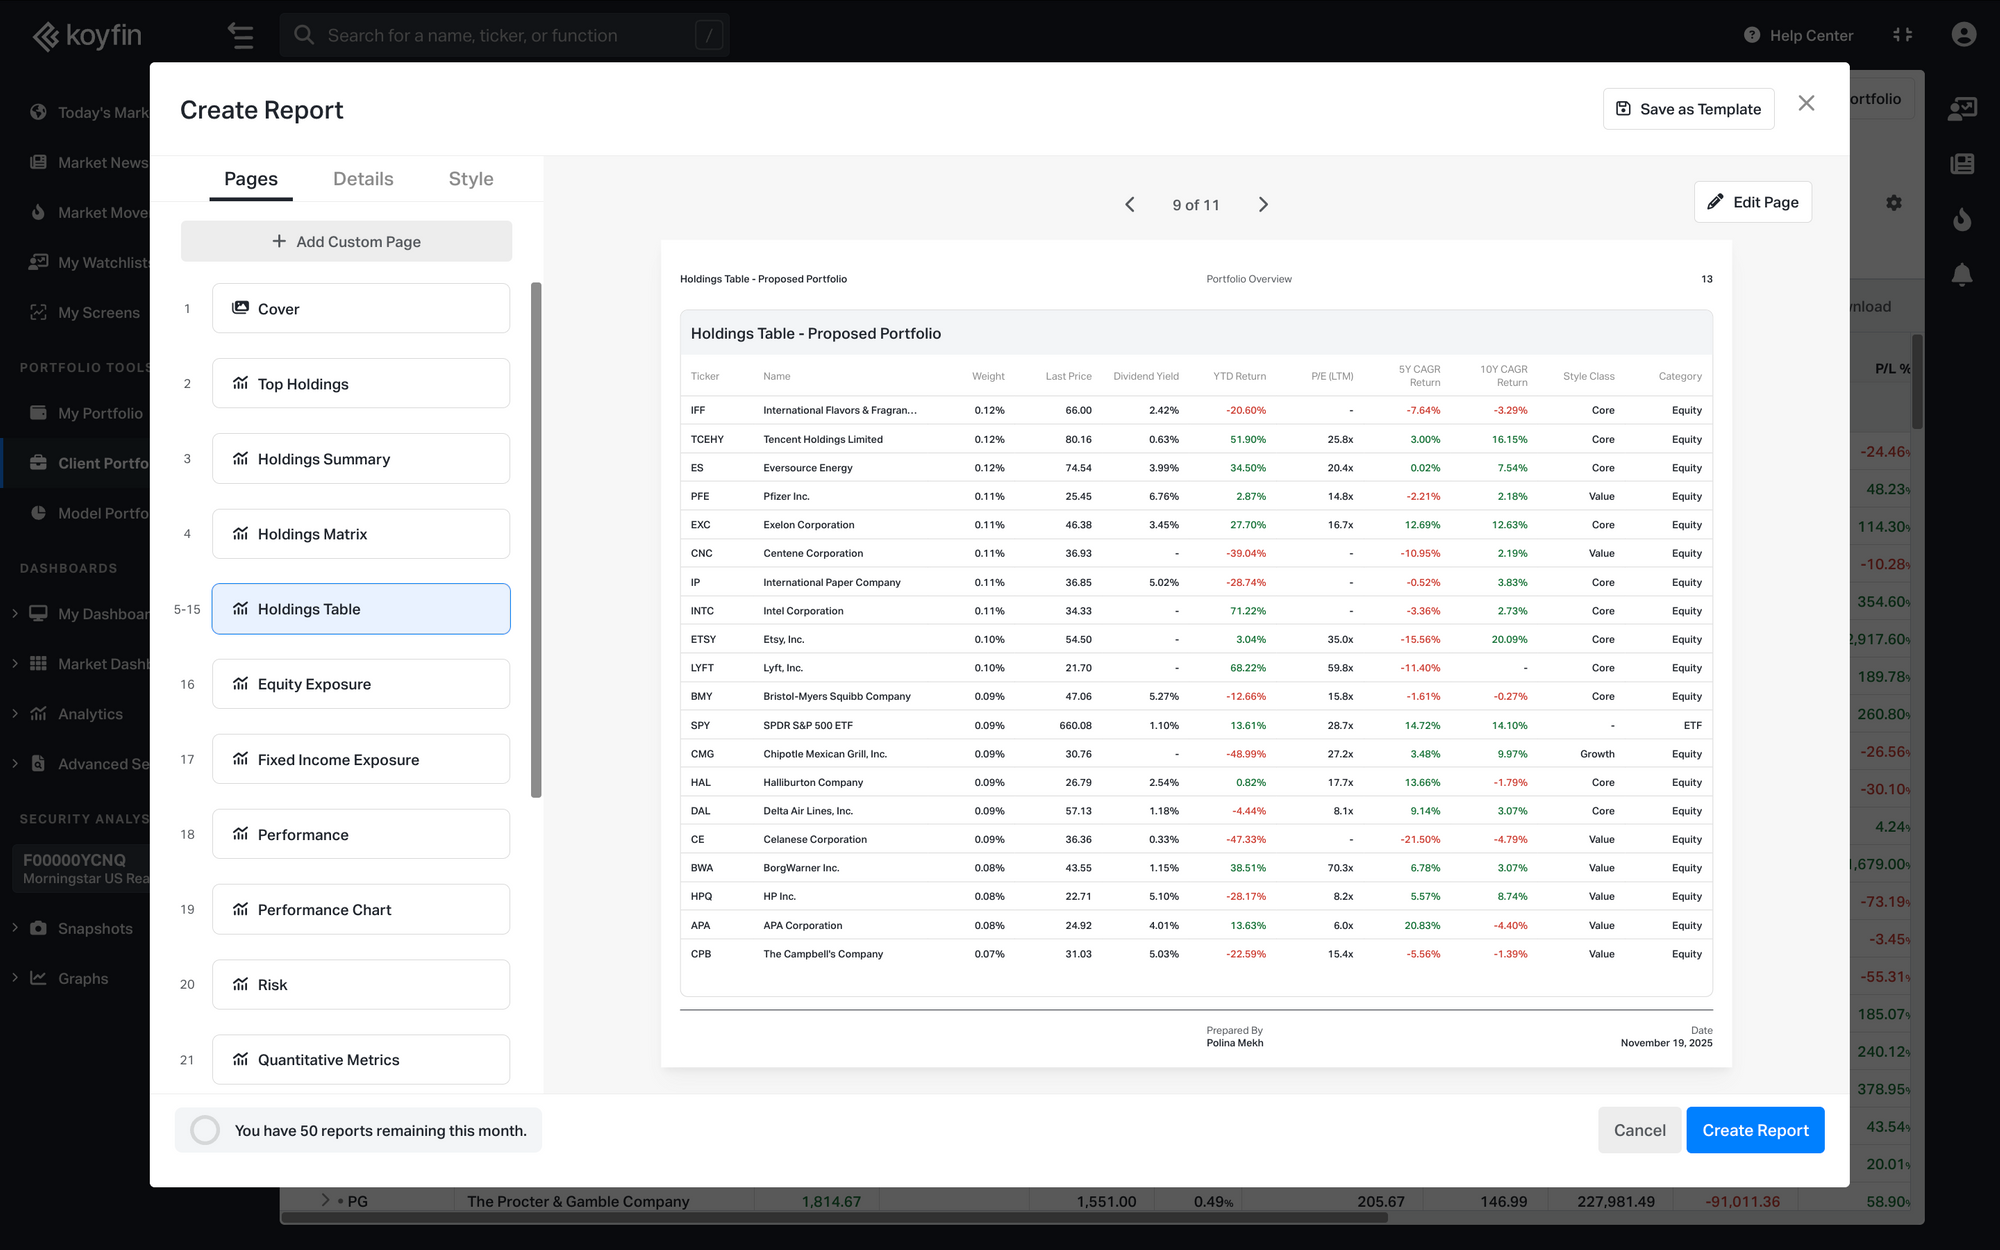
You can adjust which columns appear and choose whether to display the secondary portfolio table.
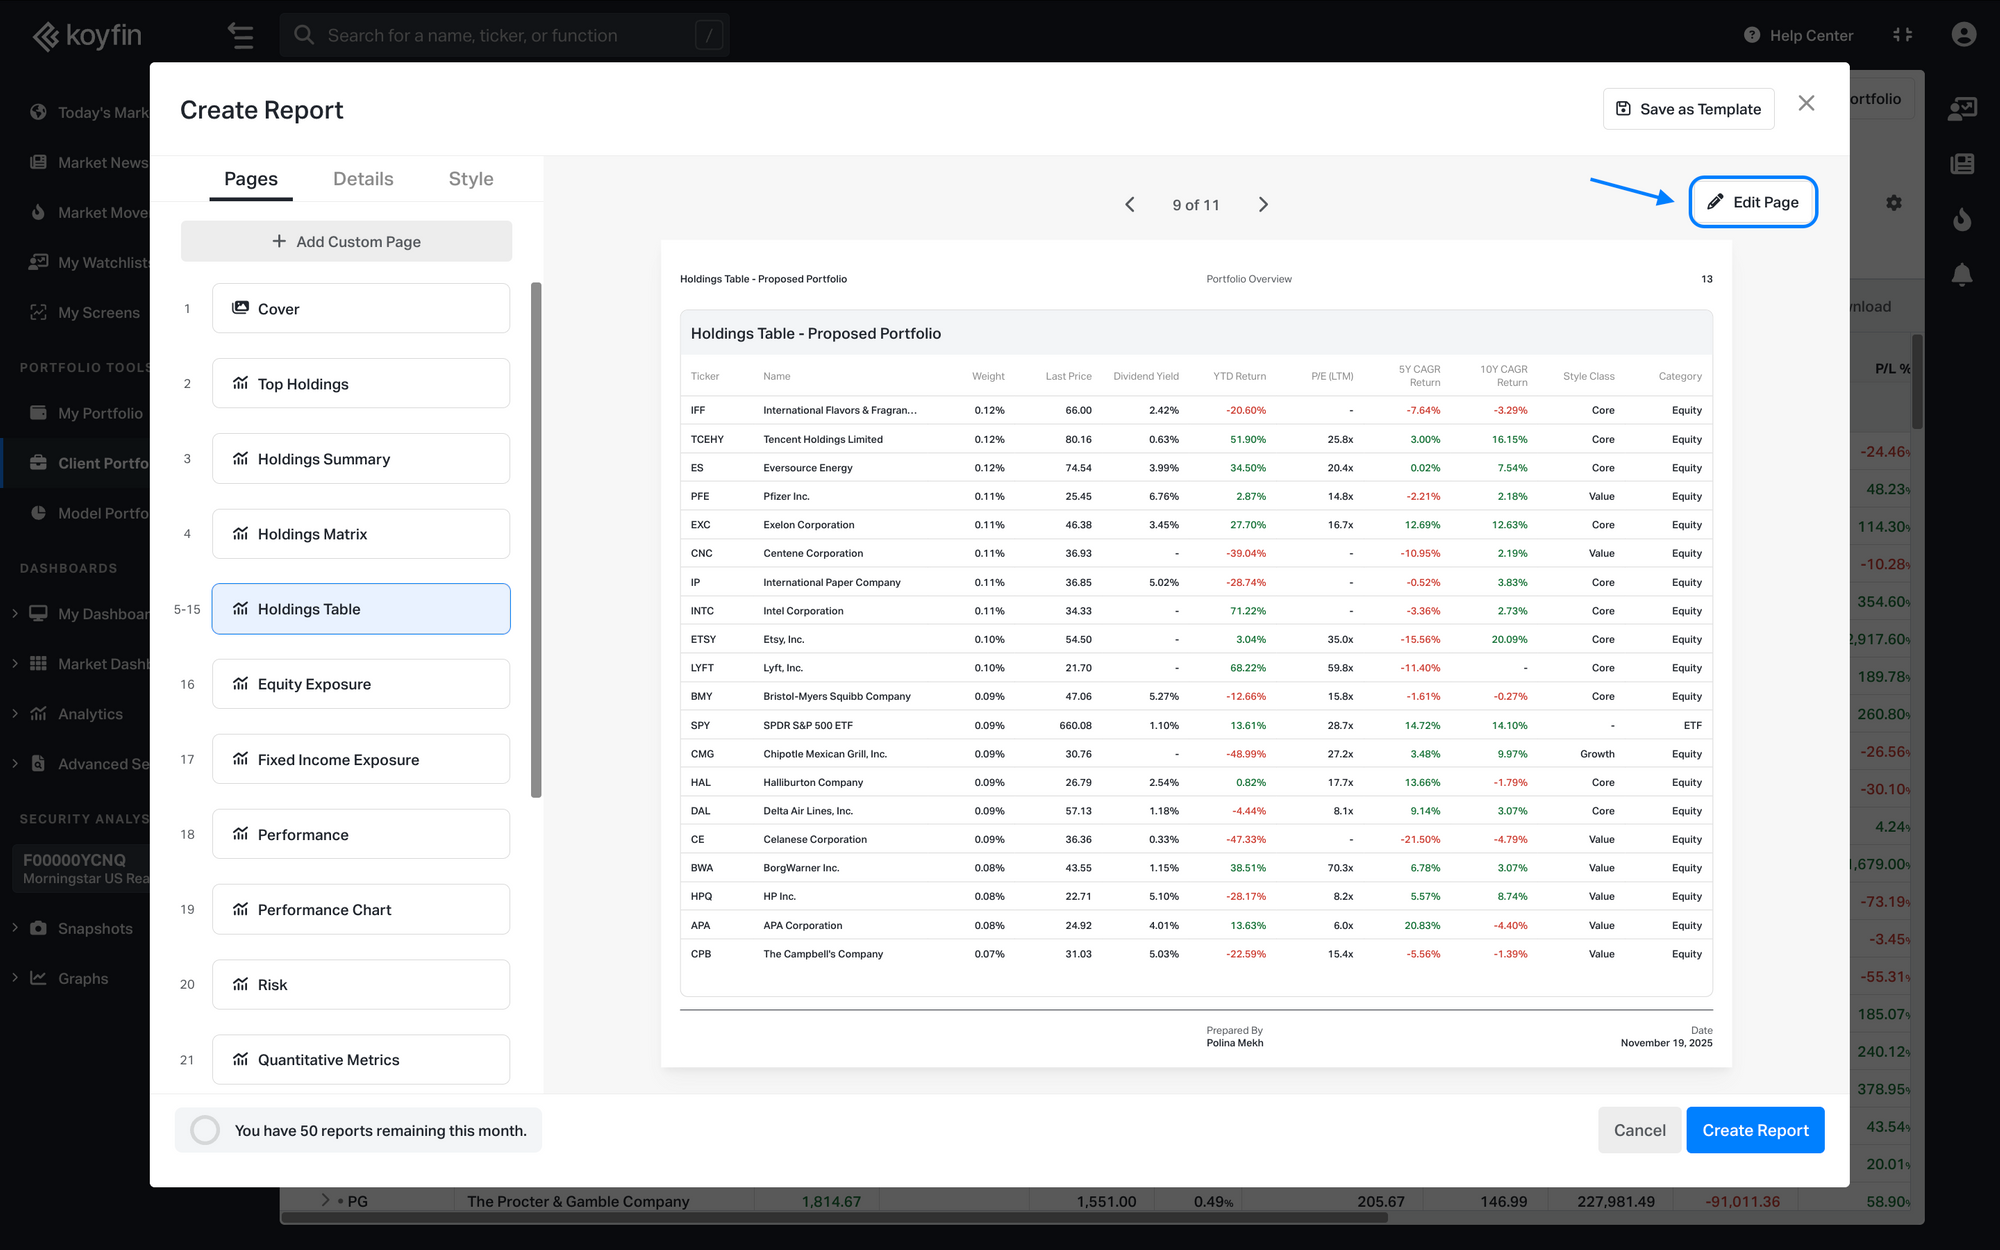
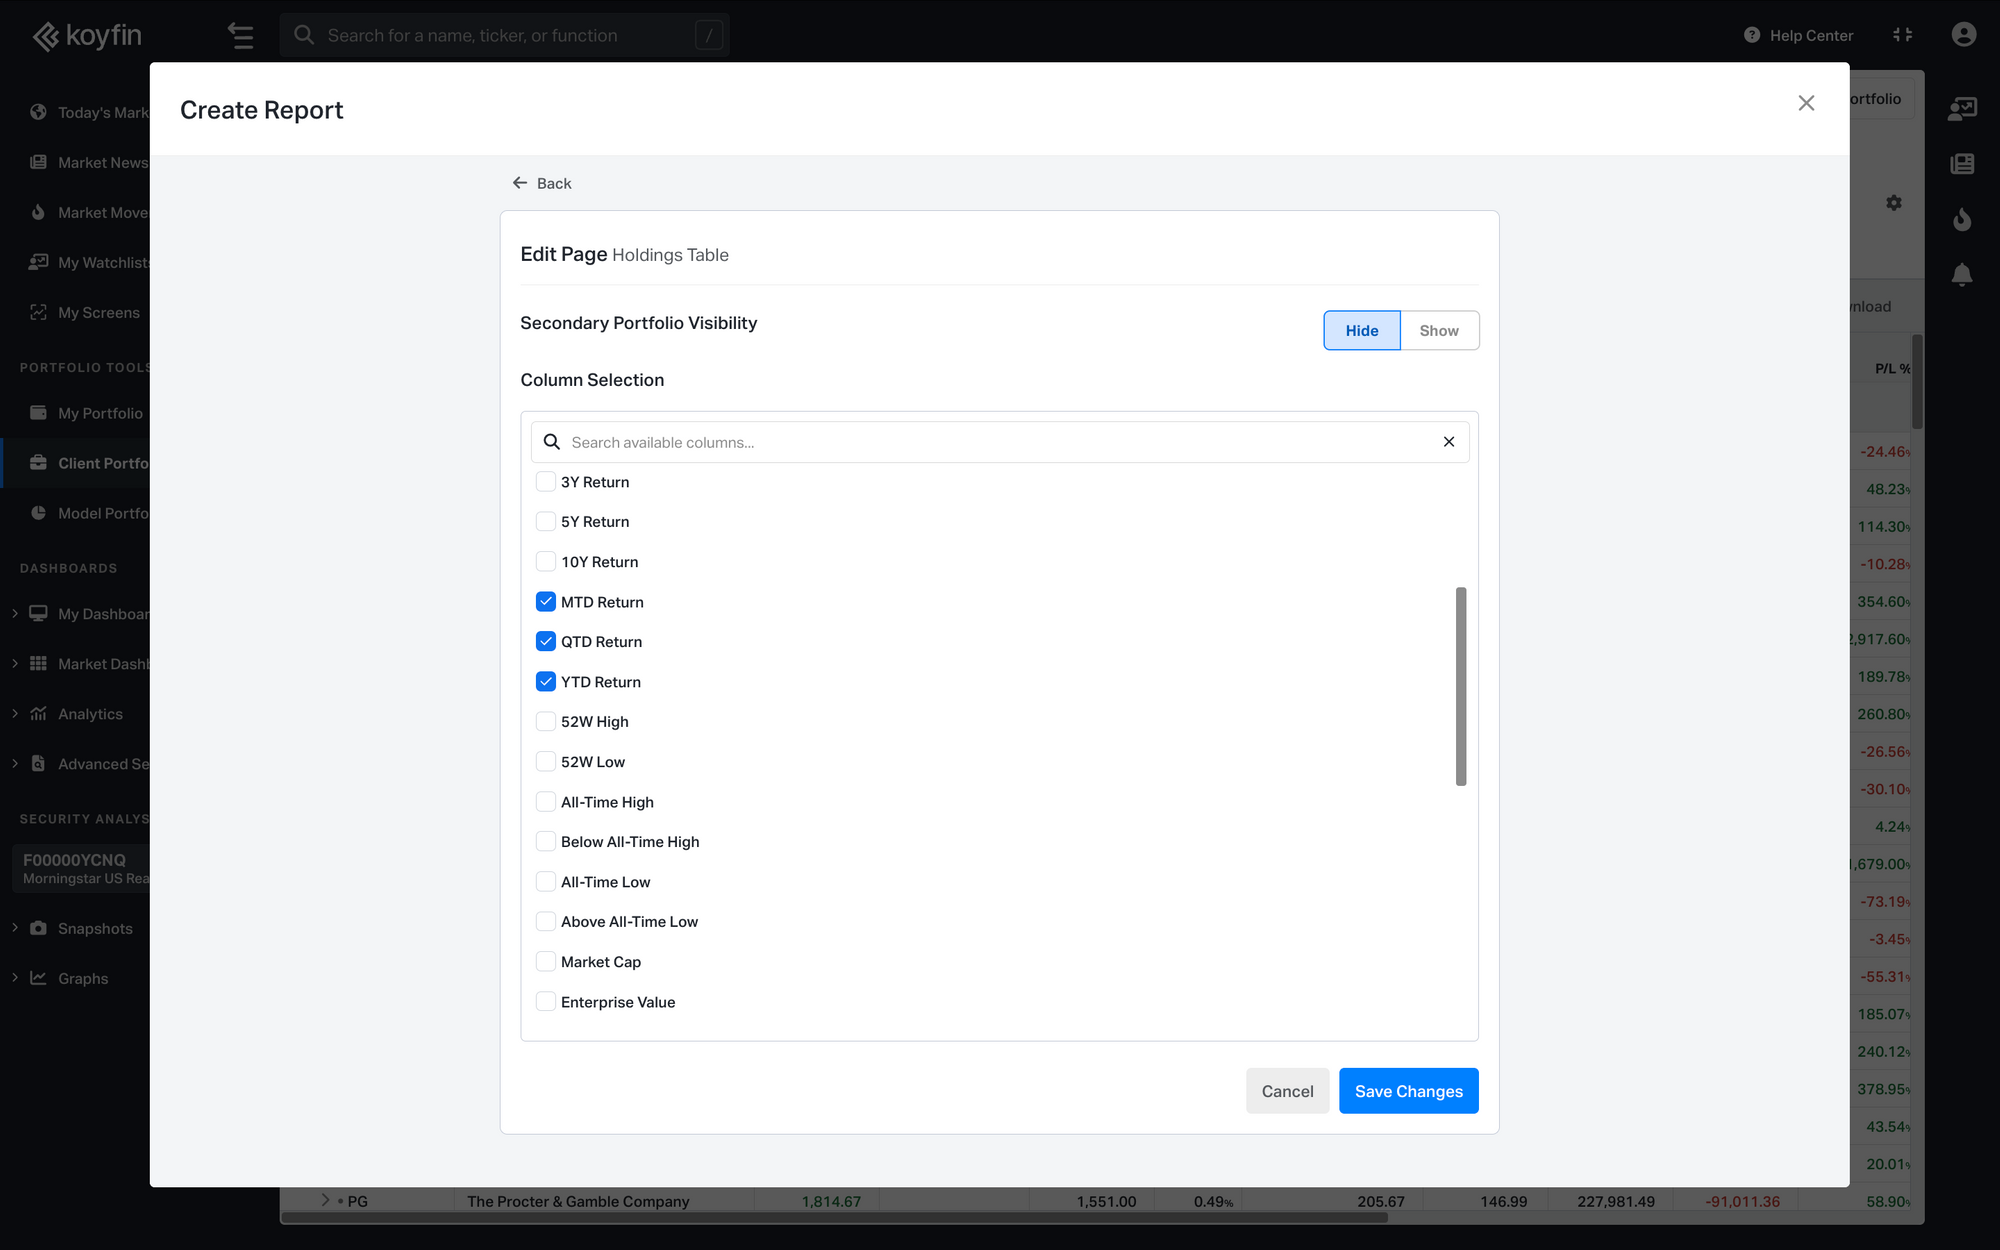
To customize the page:
- Click Edit Page in the top right corner.
- Choose whether to show or hide the secondary portfolio table.
- Select the columns you want to display.
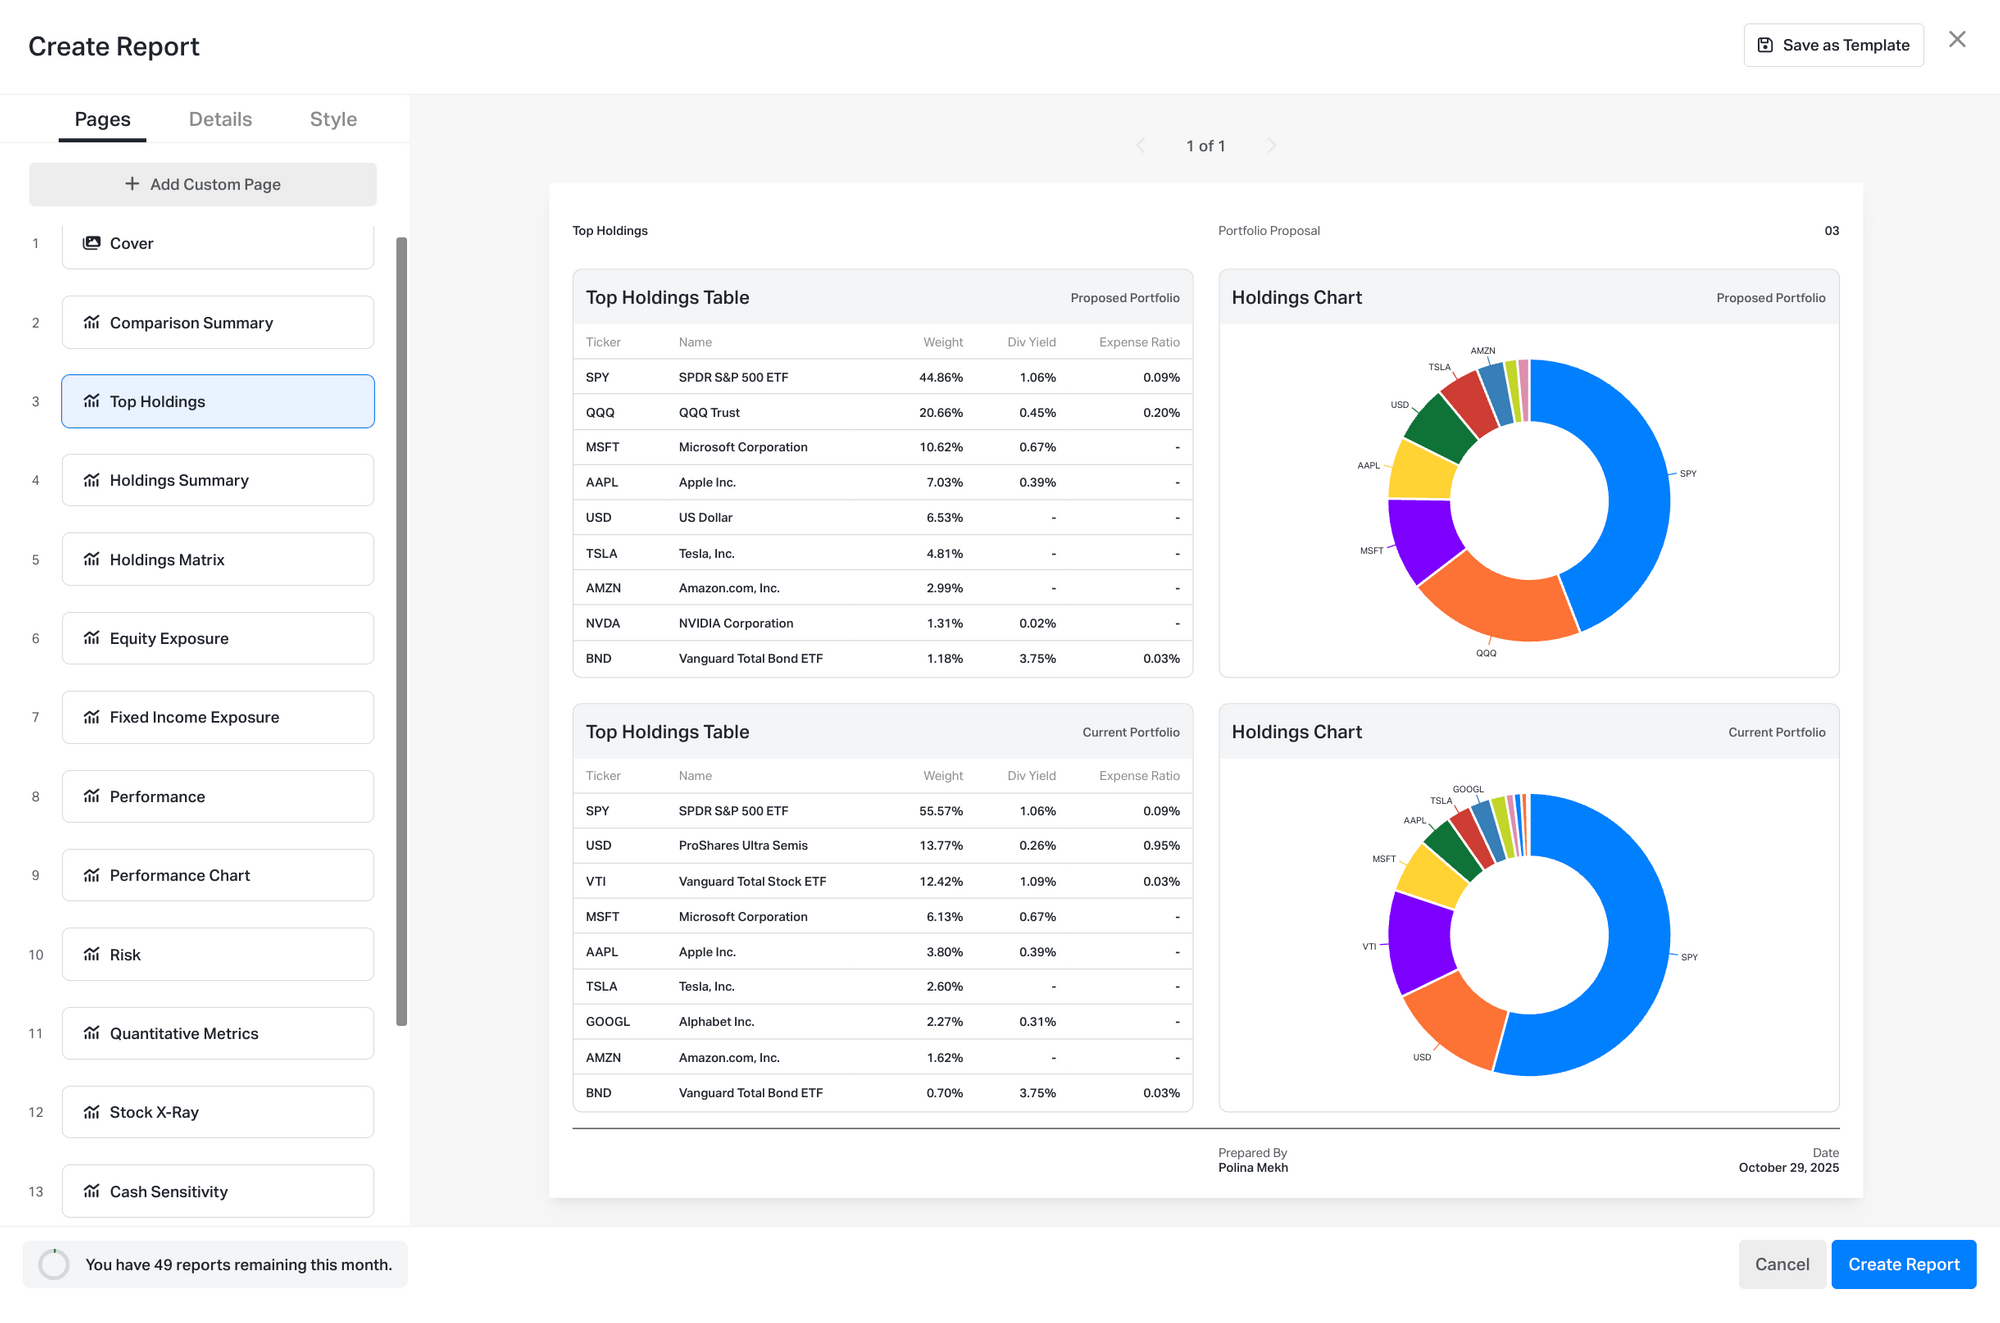
5. New Top Holdings Page
The Top Holdings page includes a table and a chart showing each portfolio’s largest positions by weight. It’s a clear, client-friendly way to show portfolio concentration and diversification at a glance.
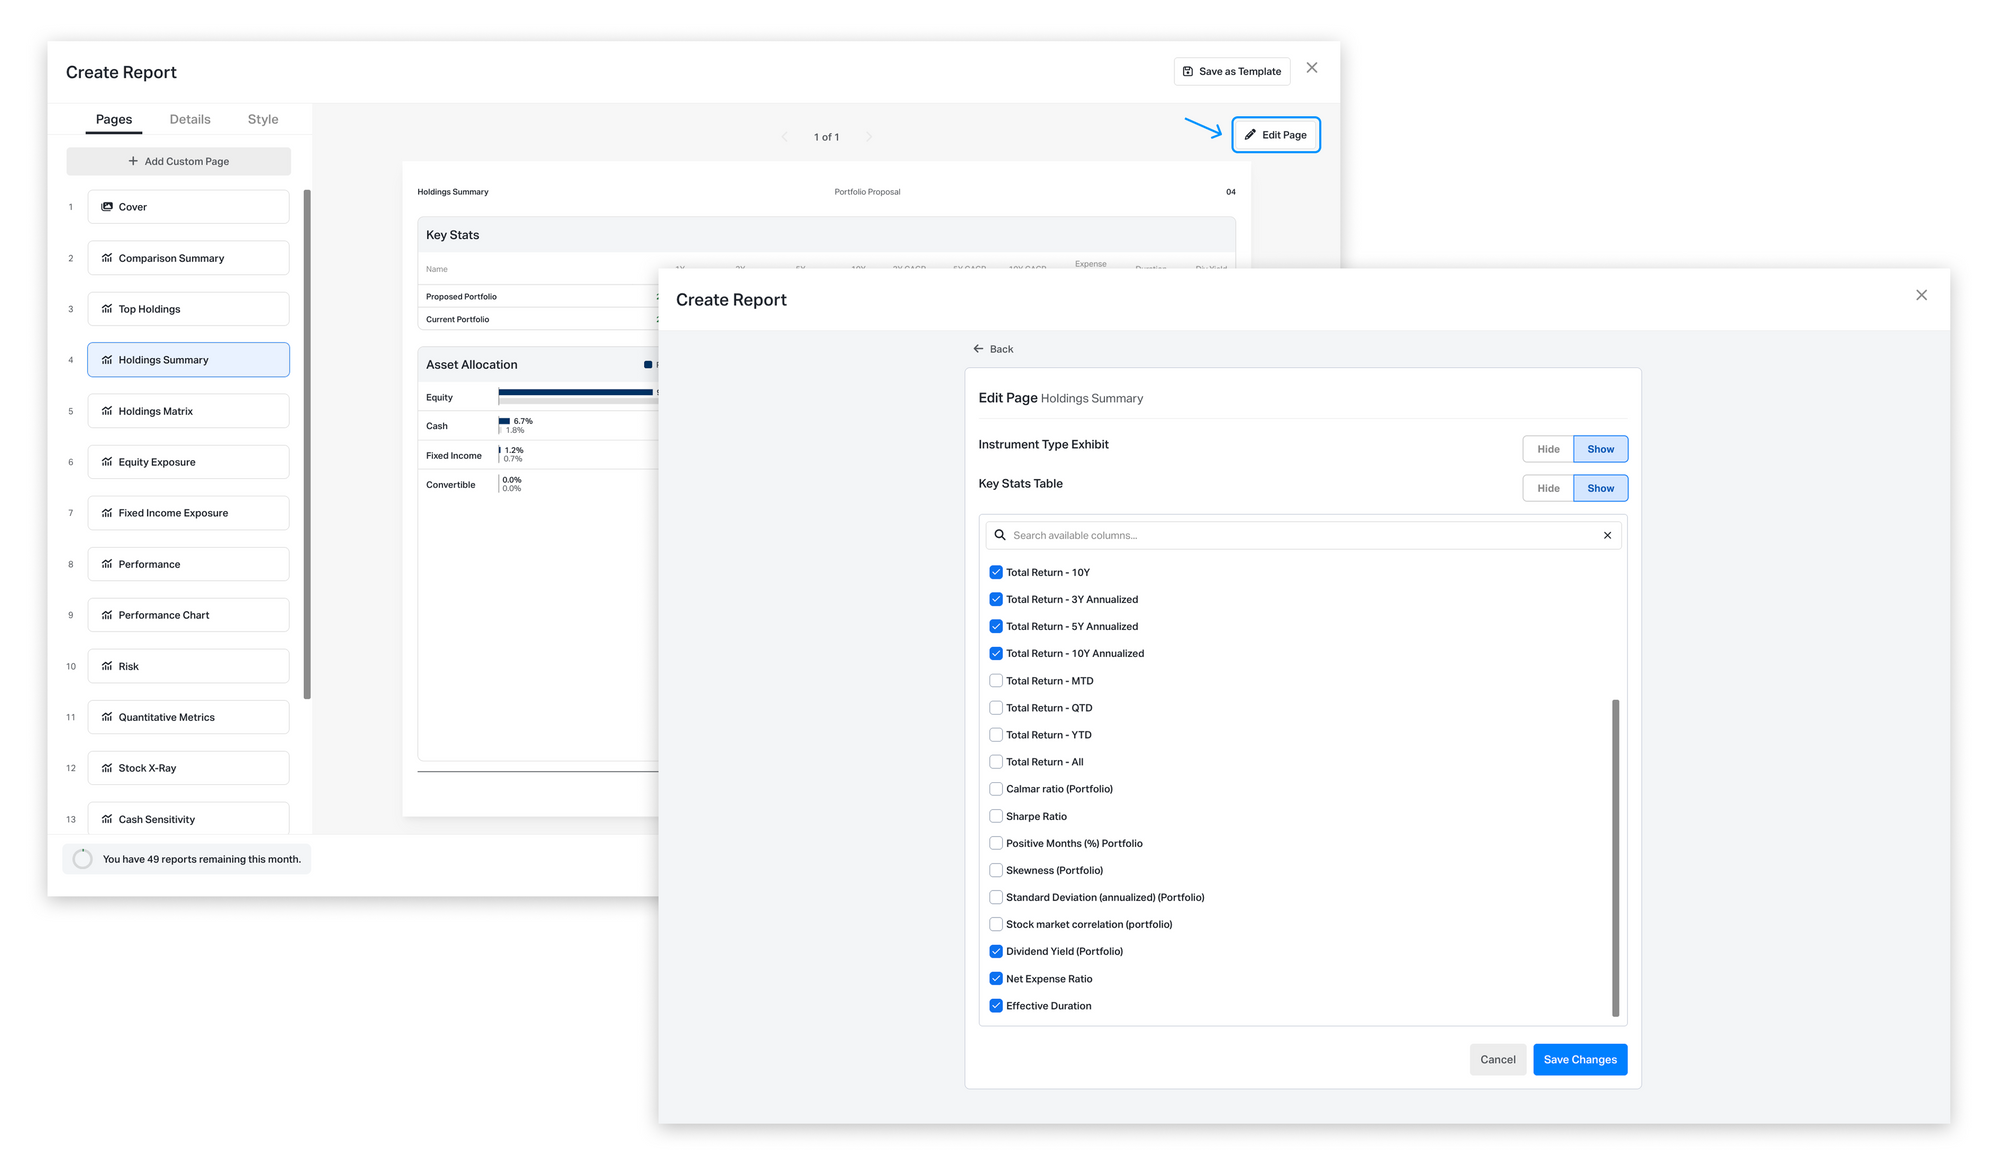
6. Updated Holdings Summary Page
The Holdings Summary page has been reorganized for clarity and now includes a new Instrument Type chart showing exposure by equities, ETFs, mutual funds, and other asset types. The Key Stats table is now customizable too.
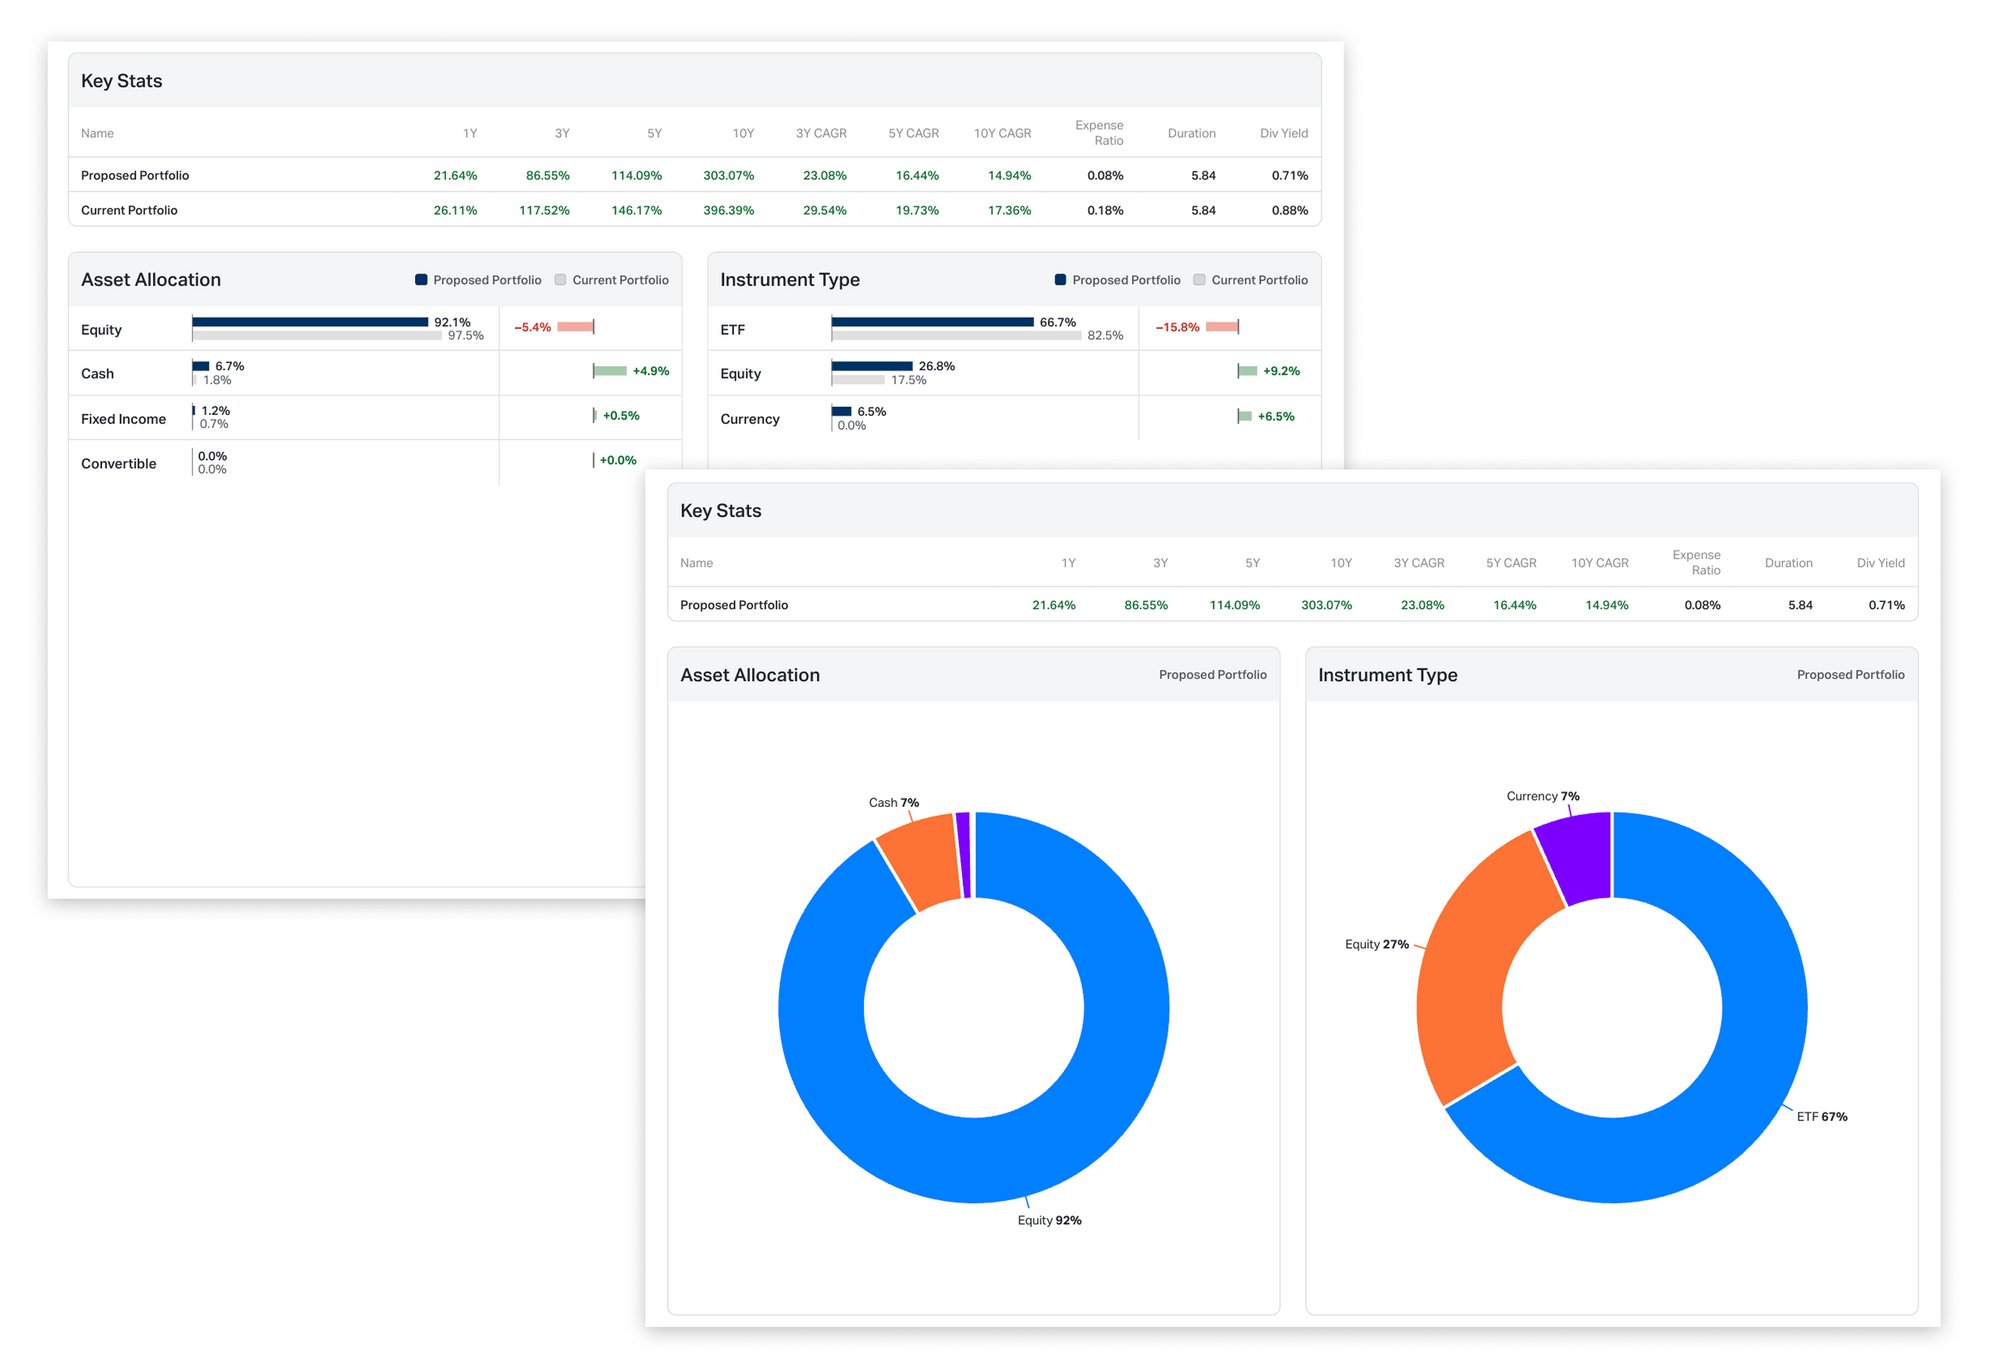
Edit Options: Click Edit Page (top-right corner) to choose which key stats to highlight and to hide or show the Instrument Type section.