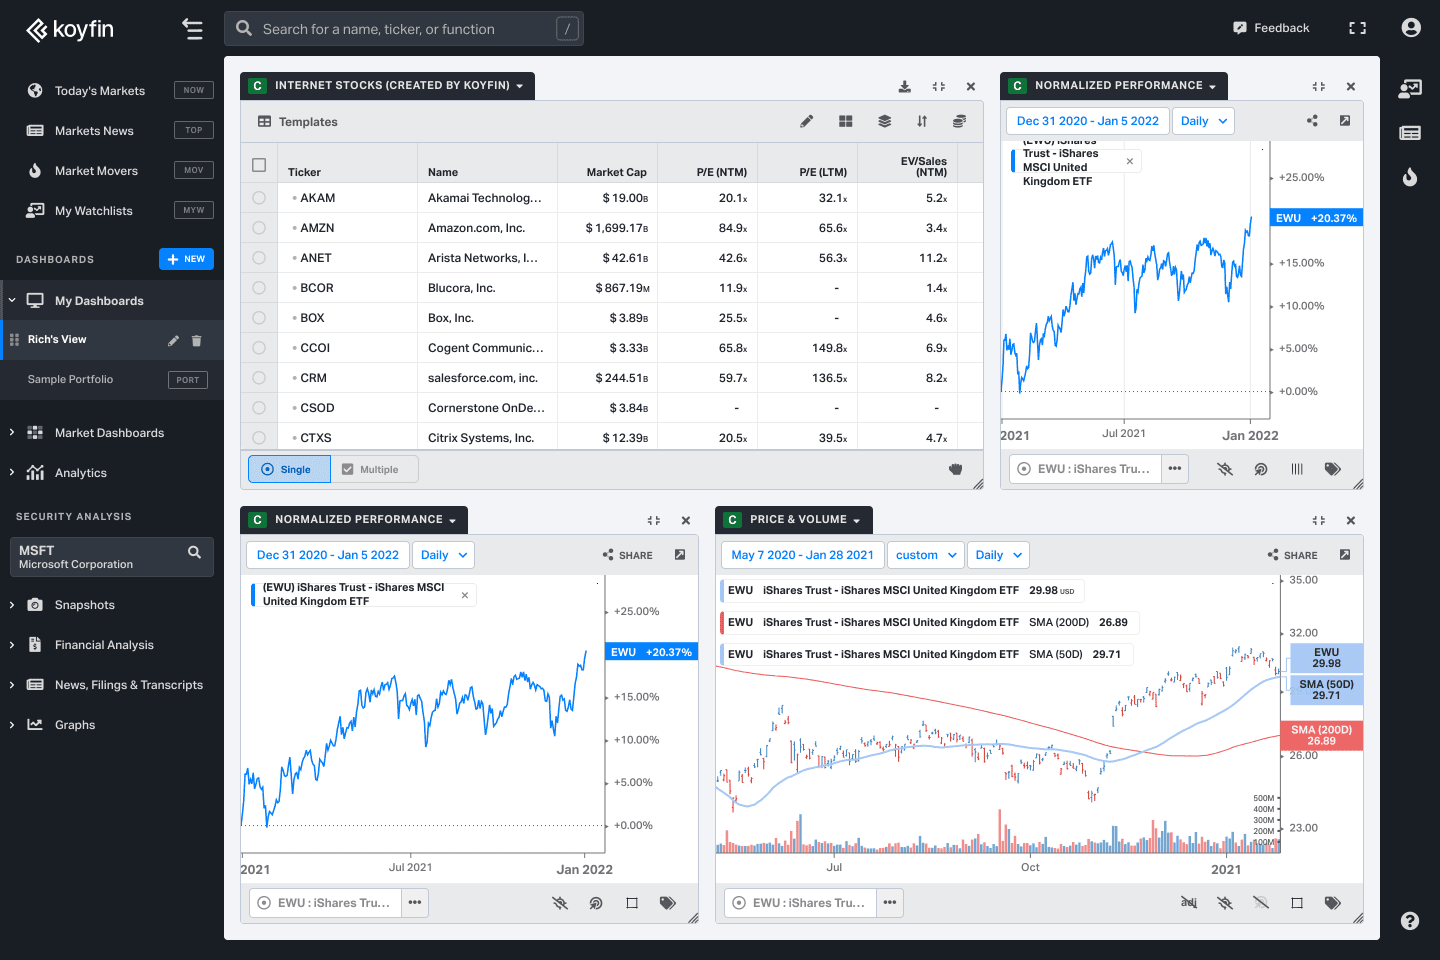
Custom Dashboards
Advanced Graphing
Graph like never before
Unlock insight with winning graphing tools that let you spot trends and identify investment opportunities with ease.
Powerful
Our graphs let you analyze assets with lazer like focus. With great graphs, comes great responsibility.
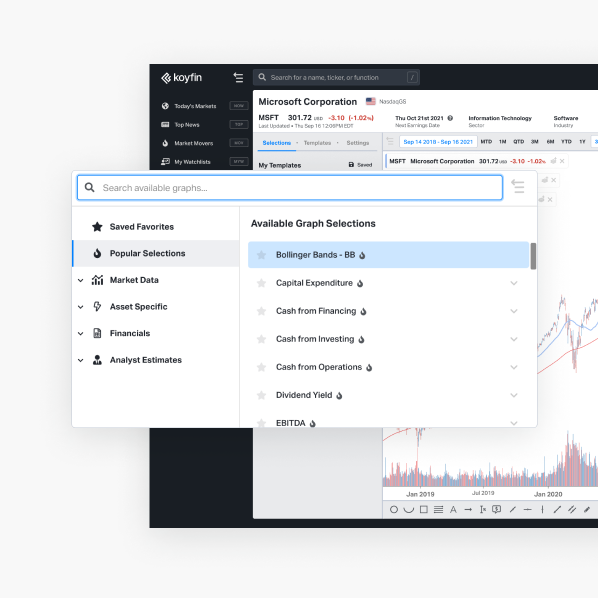
Customizable
Easily apply all your favorite indicators to make your graphs shine like never before.
Intuitive
With our focus on the user experience, you’ll find our graphs a joy to use!
Responsive
Get your work done on any device, no matter the screen size, with our responsive graphing tools.
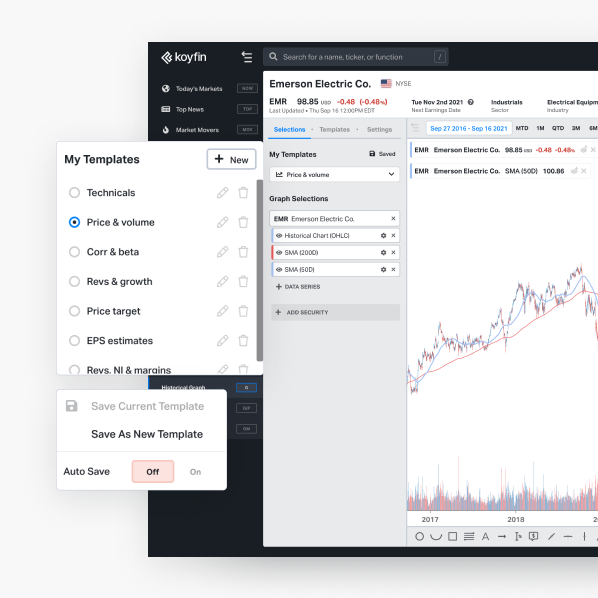
Save templates
Adapt and save templates
Koyfin lets you build your graphs to match how you work best. Templates let you apply your favorite views again and again!
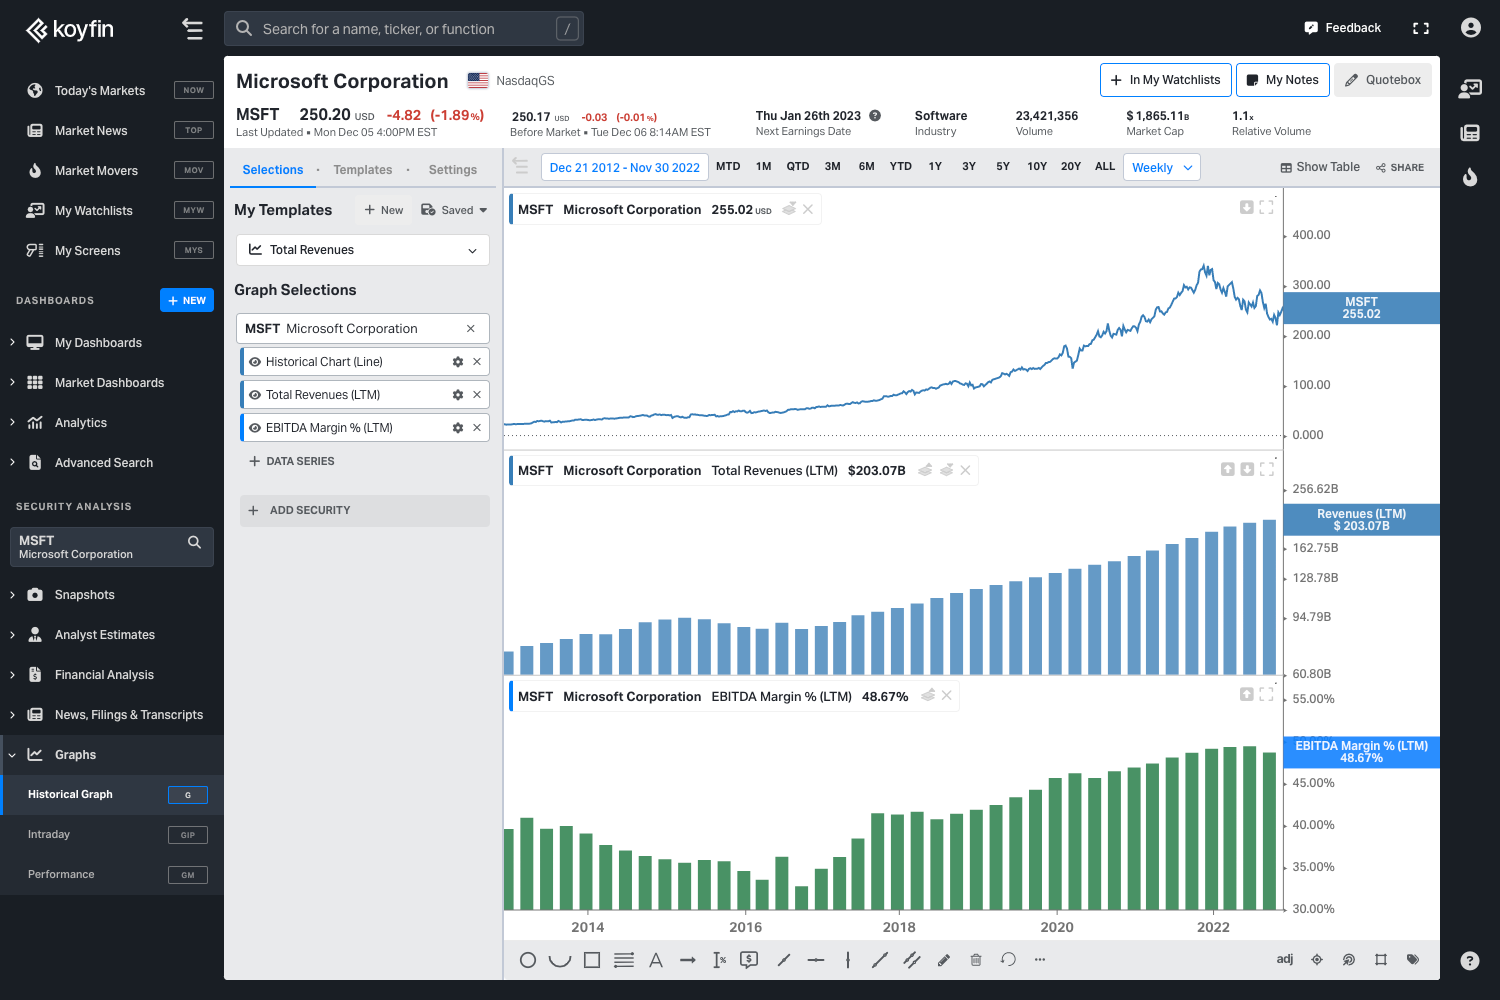
Technicals & fundamentals
Over 100 indicators
at your disposal
Our graphs can include over 100 different series related to fundamentals, technicals, performance, valuation, consensus estimates, and analyst ratings.
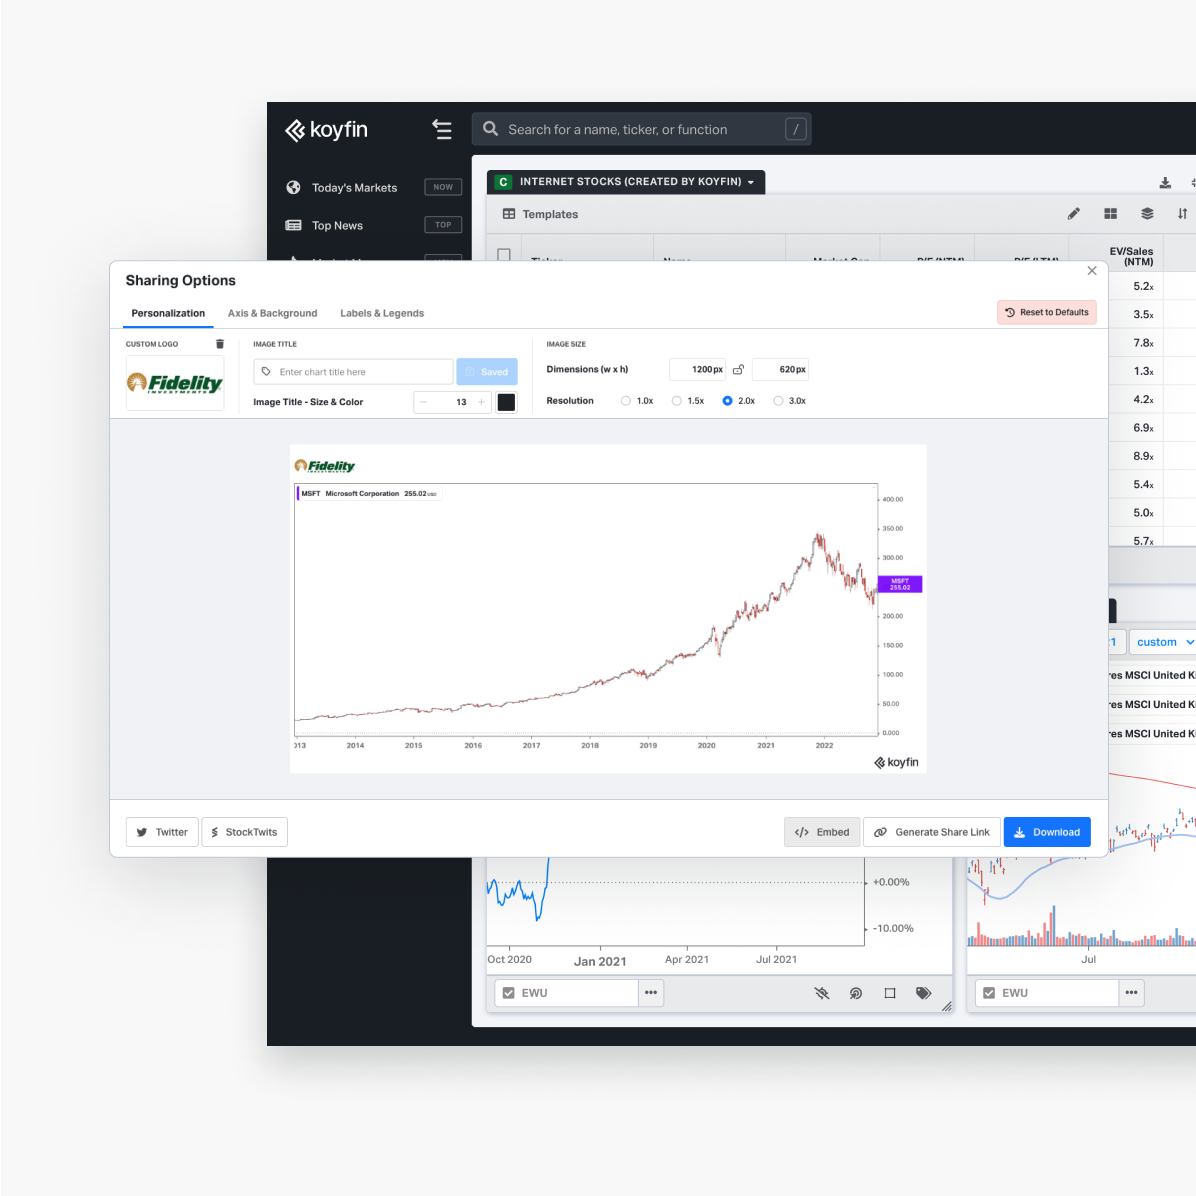
Easily share your insight
Share your charts with a mouse click
Easily add your company's logo to a chart to brand your content. Share your charts with an easy link, or choose "embed" to easily add them to your website. Download your graphs to use in presentations or emails.
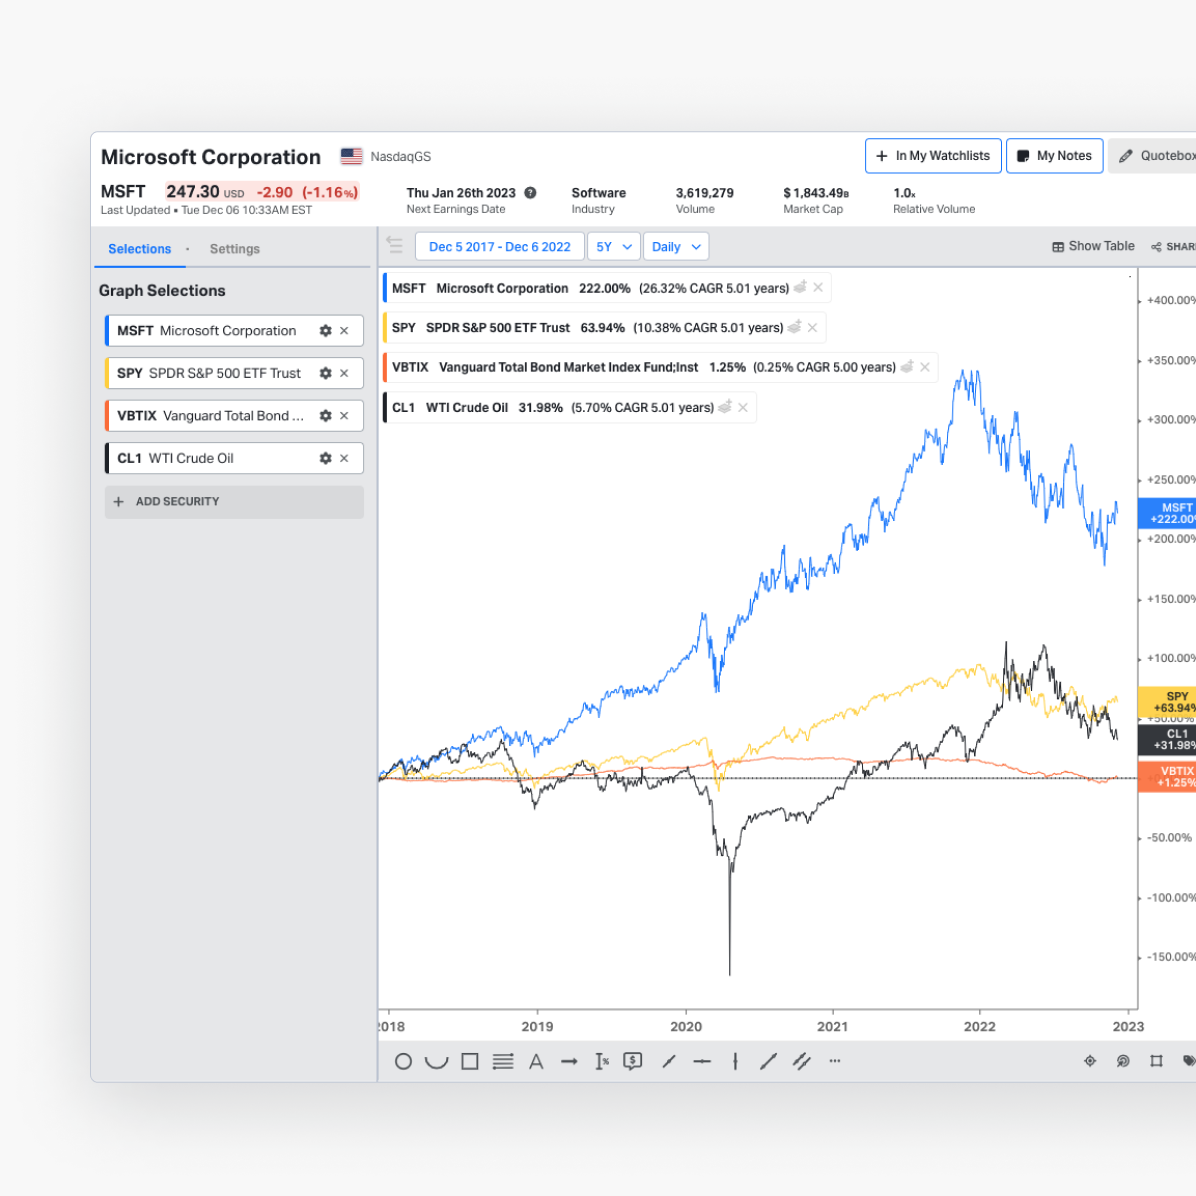
Historical performance
Analyze past performance
Create performance and total return charts across stocks, mutual funds, ETFs, or any other asset class charts to highlight the overall return and CAGR over any time period.
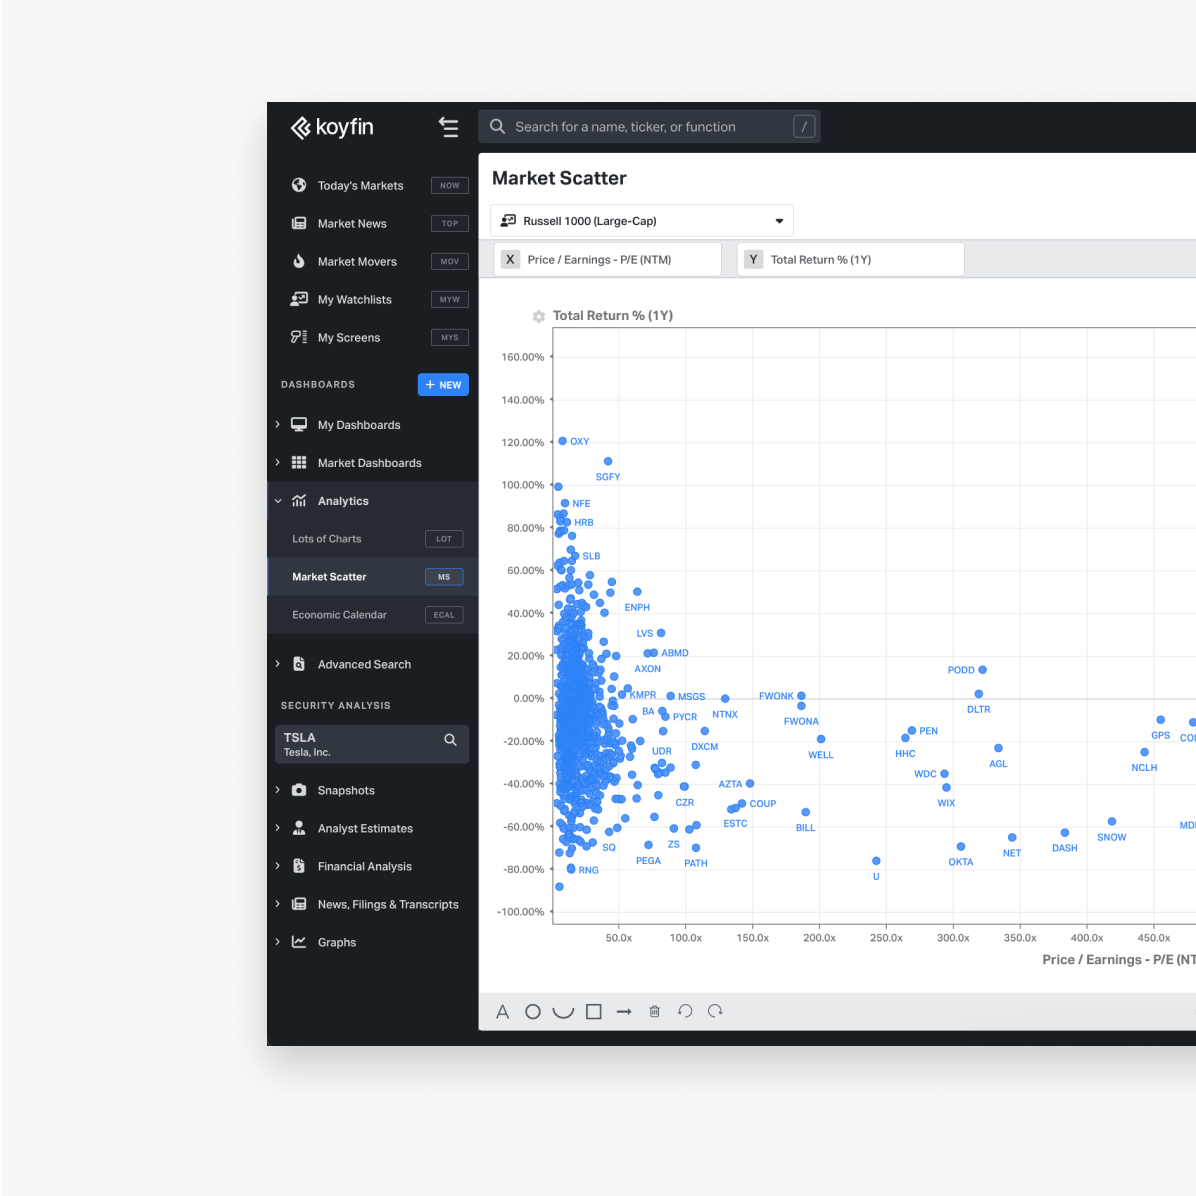
Scatter charts
See trends across a universe of stocks
Cross-sectional analysis allows you to see relationships and outliers for many stocks at once.


Great investments start with
great insight.
Join with the thousands of investors who’ve discovered Koyfin.