Stocks
Essential information
at your fingertips
We cover all global stocks including historical prices, financials, valuation, analysts ratings, consensus estimates, news, filings, and transcripts.


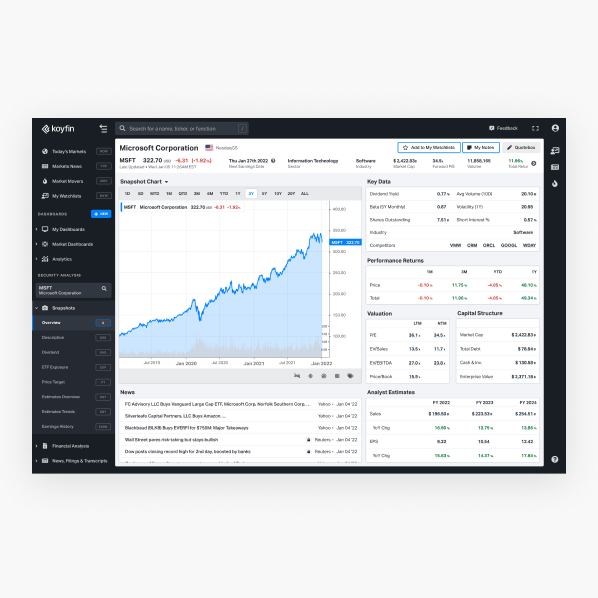
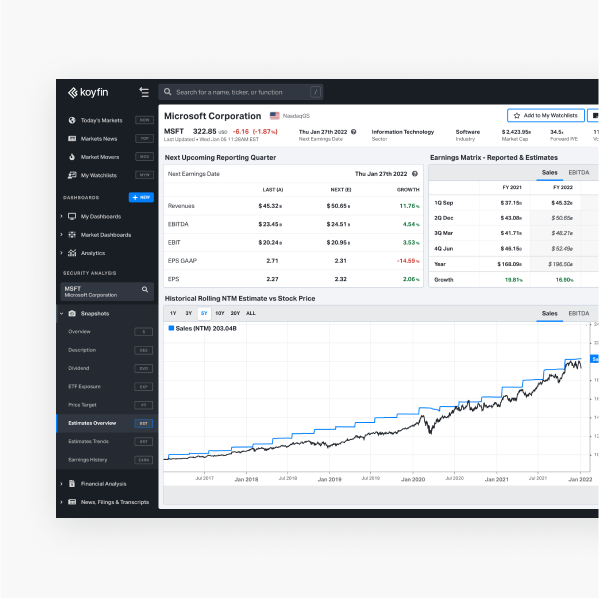
Stock Snapshots
Essential
information on
one screen
Ramp up your power with real-time price data, business summaries, key analytics metrics, price-performance charts, recent news, earnings estimates — and much more!
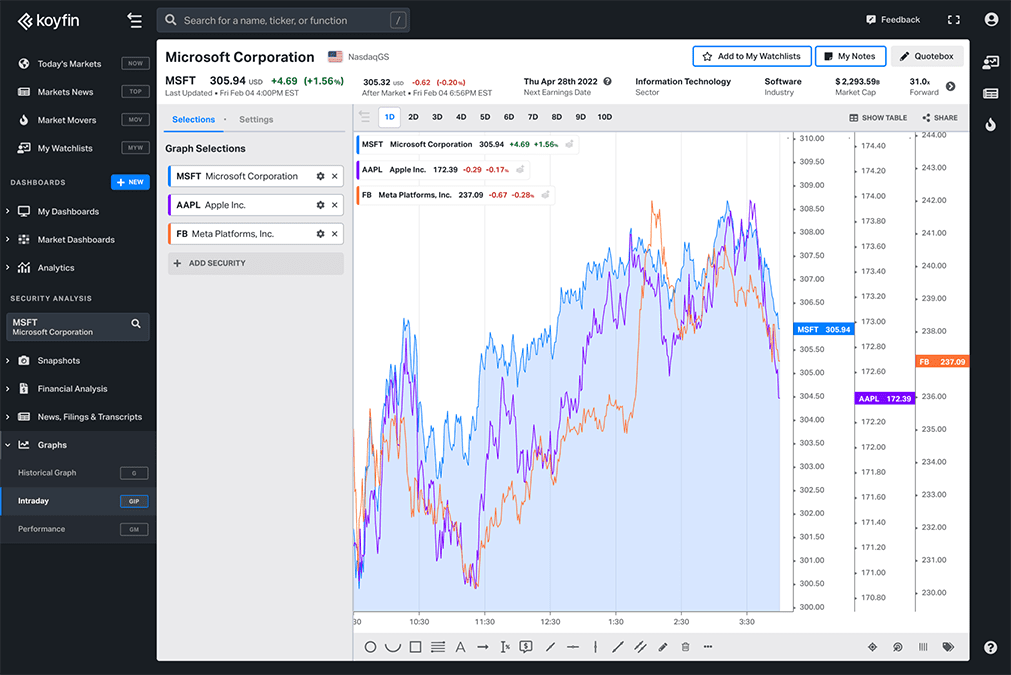
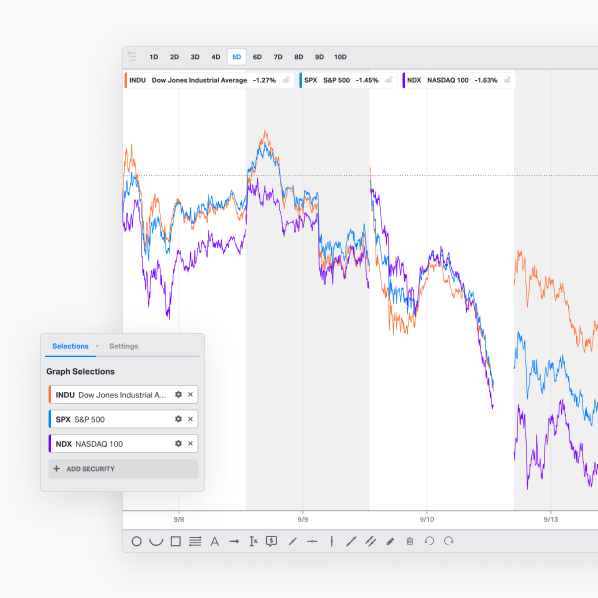
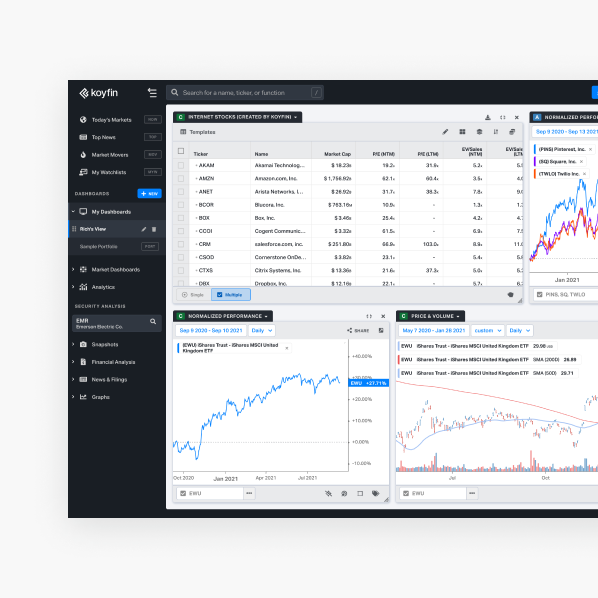
Advanced Graphing
Powerful
visualization tools
Customize graphs using hundreds of technical analysis indicators, create charts to illustrate fundamental and valuation measures, and view analysts' price targets and consensus earnings estimates.
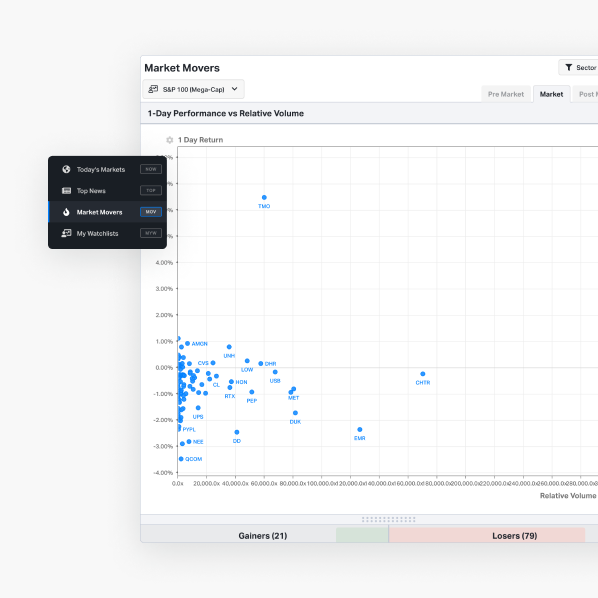
Follow the market
Market Movers
Ready, real-time displays show the biggest daily gains, losses and volume breakouts above their 10-day averages all on one easy-to-understand screen.
Wall Street Estimates
Monitor earnings estimates
Monitor earnings estimates and price targets from analysts across Wall Street. View historical changes and trends in consensus estimates for earnings, sales, and operating profits. All on one screen!
Create custom watchlists
Tailor to your investment style
Leverage My Dashboards tool to create dozens of custom watchlists. Tailor each using the specific data points that fit your unique investment management style and personal preferences from hundreds of sortable criteria.
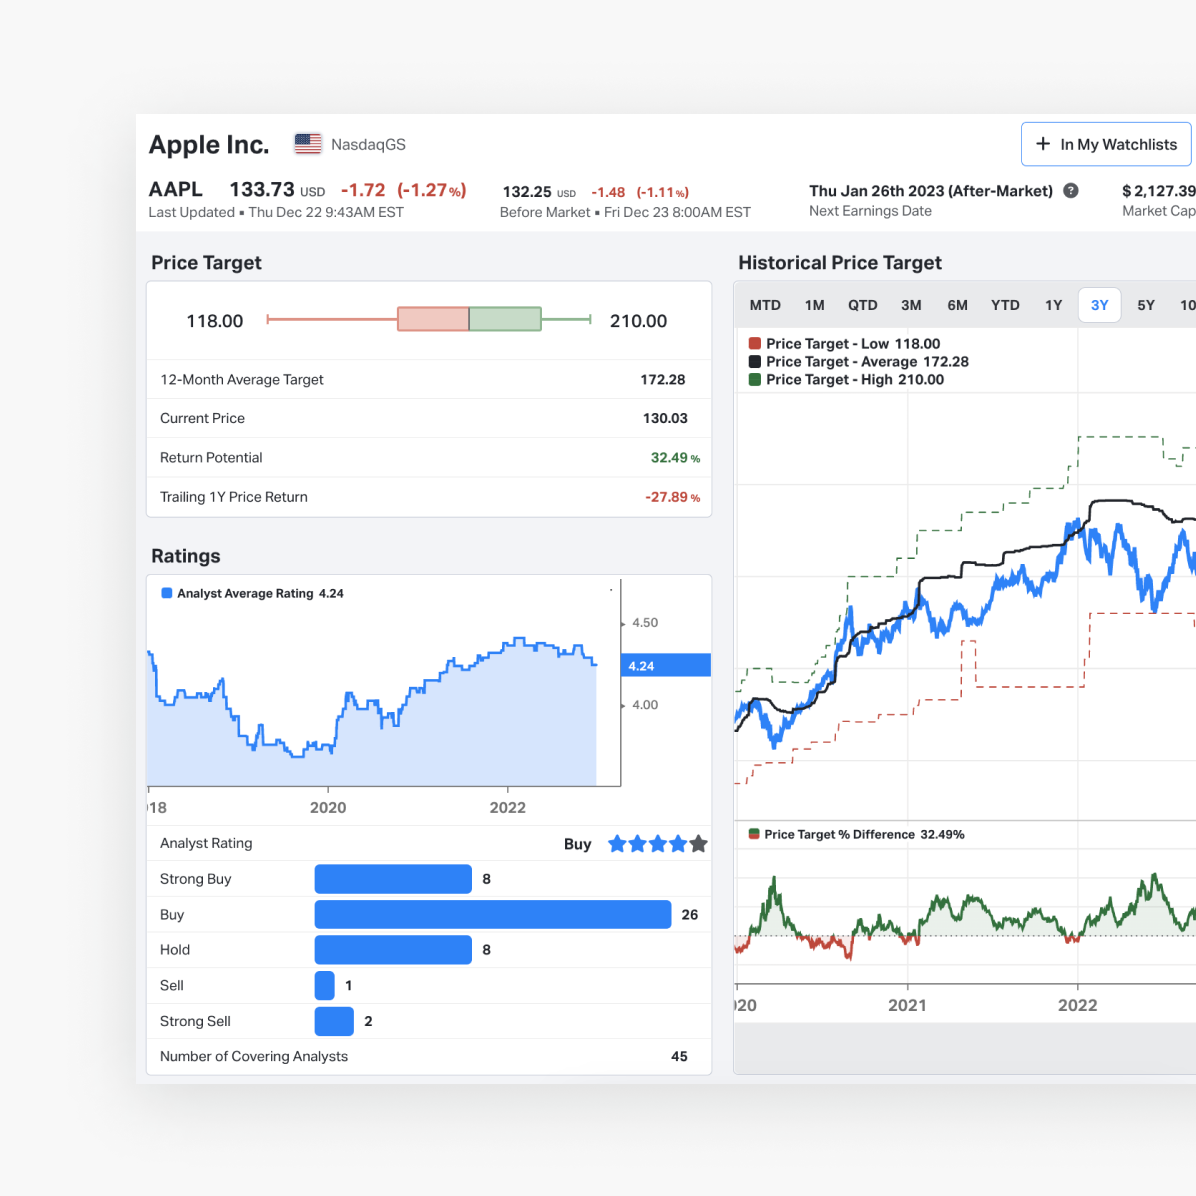
Analyst price targets
See what Wall Street Analysts think of a stock
It's important to understand what the pros think of a stock, even if you disagree. Track the average price target historically and see the broker breakout by buys, sells and holds.
More data; more insight
Discover in more detail how our data can help you.

Koyfin is an excellent research tool and with its global coverage of equities, analyst estimates and financials, it allows investors to carry out fast and comprehensive analysis. Koyfin is a great product!

Koyfin as a service is like no other. I’ve used Bloomberg terminals that my university provides but Koyfin’s service is perfect for what I need. It’s even comparable to the service that Bloomberg offers!

I truly enjoy Koyfin. I have been in the investment advisory business for 35 years and although I subscribe to and use a number of tools ranging from Eikon to Zephyr, I open Koyfin every day.

Koyfin is one of the chief tools I use to get a quick overview of the markets, as it offers a great dashboard covering multiple asset classes across the globe. And because they also offer data and analysis on US-listed ETFs and funds.

I have the hugest amount of respect for Rob and the Koyfin team. What these guys are doing is great – and they are empowering individual investors like me with tools that make it easier and faster to analyse companies all over the world!
Great investments start with
great insight.
Join with the thousands of investors who’ve discovered Koyfin.