Enterprise
A tool that’s built for business
Koyfin has been designed to streamline business systems and save you time.
With access to high-quality data and powerful tools all wrapped up in an affordable and easy-to-use platform, Koyfin is the clear choice for the best Bloomberg alternative.
A compelling reason to choose Koyfin over Bloomberg is the price. It may sound silly, but where Bloomberg costs upward of $2,000 a month, Koyfin’s Pro plan costs as little as $70 a month. Even at the lower price point, Koyfin packs a powerful one-two punch with comprehensive data coverage and intuitive analytical tools.
With everything you need in one place and without the steep learning curve associated with Bloomberg, Koyfin saves you time, streamlines your workflow and let’s you make smart investment decisions.
You don’t get put on an industry pedestal without some powerful features and this is where Bloomberg shines. A quick scan of this list though and you will see that, pound-for-pound, Koyfin is more than a match for the big-hitting heavy-weight, Bloomberg.


Data coverage
Global stocks
Professional-grade financials
Wall Street consensus estimates and price targets
Professional-grade mutual fund data
ETFs, fx, crypto & government bond yields
Global economic data
News, Filings and Transcripts
Core tools & analytics
Company snapshots
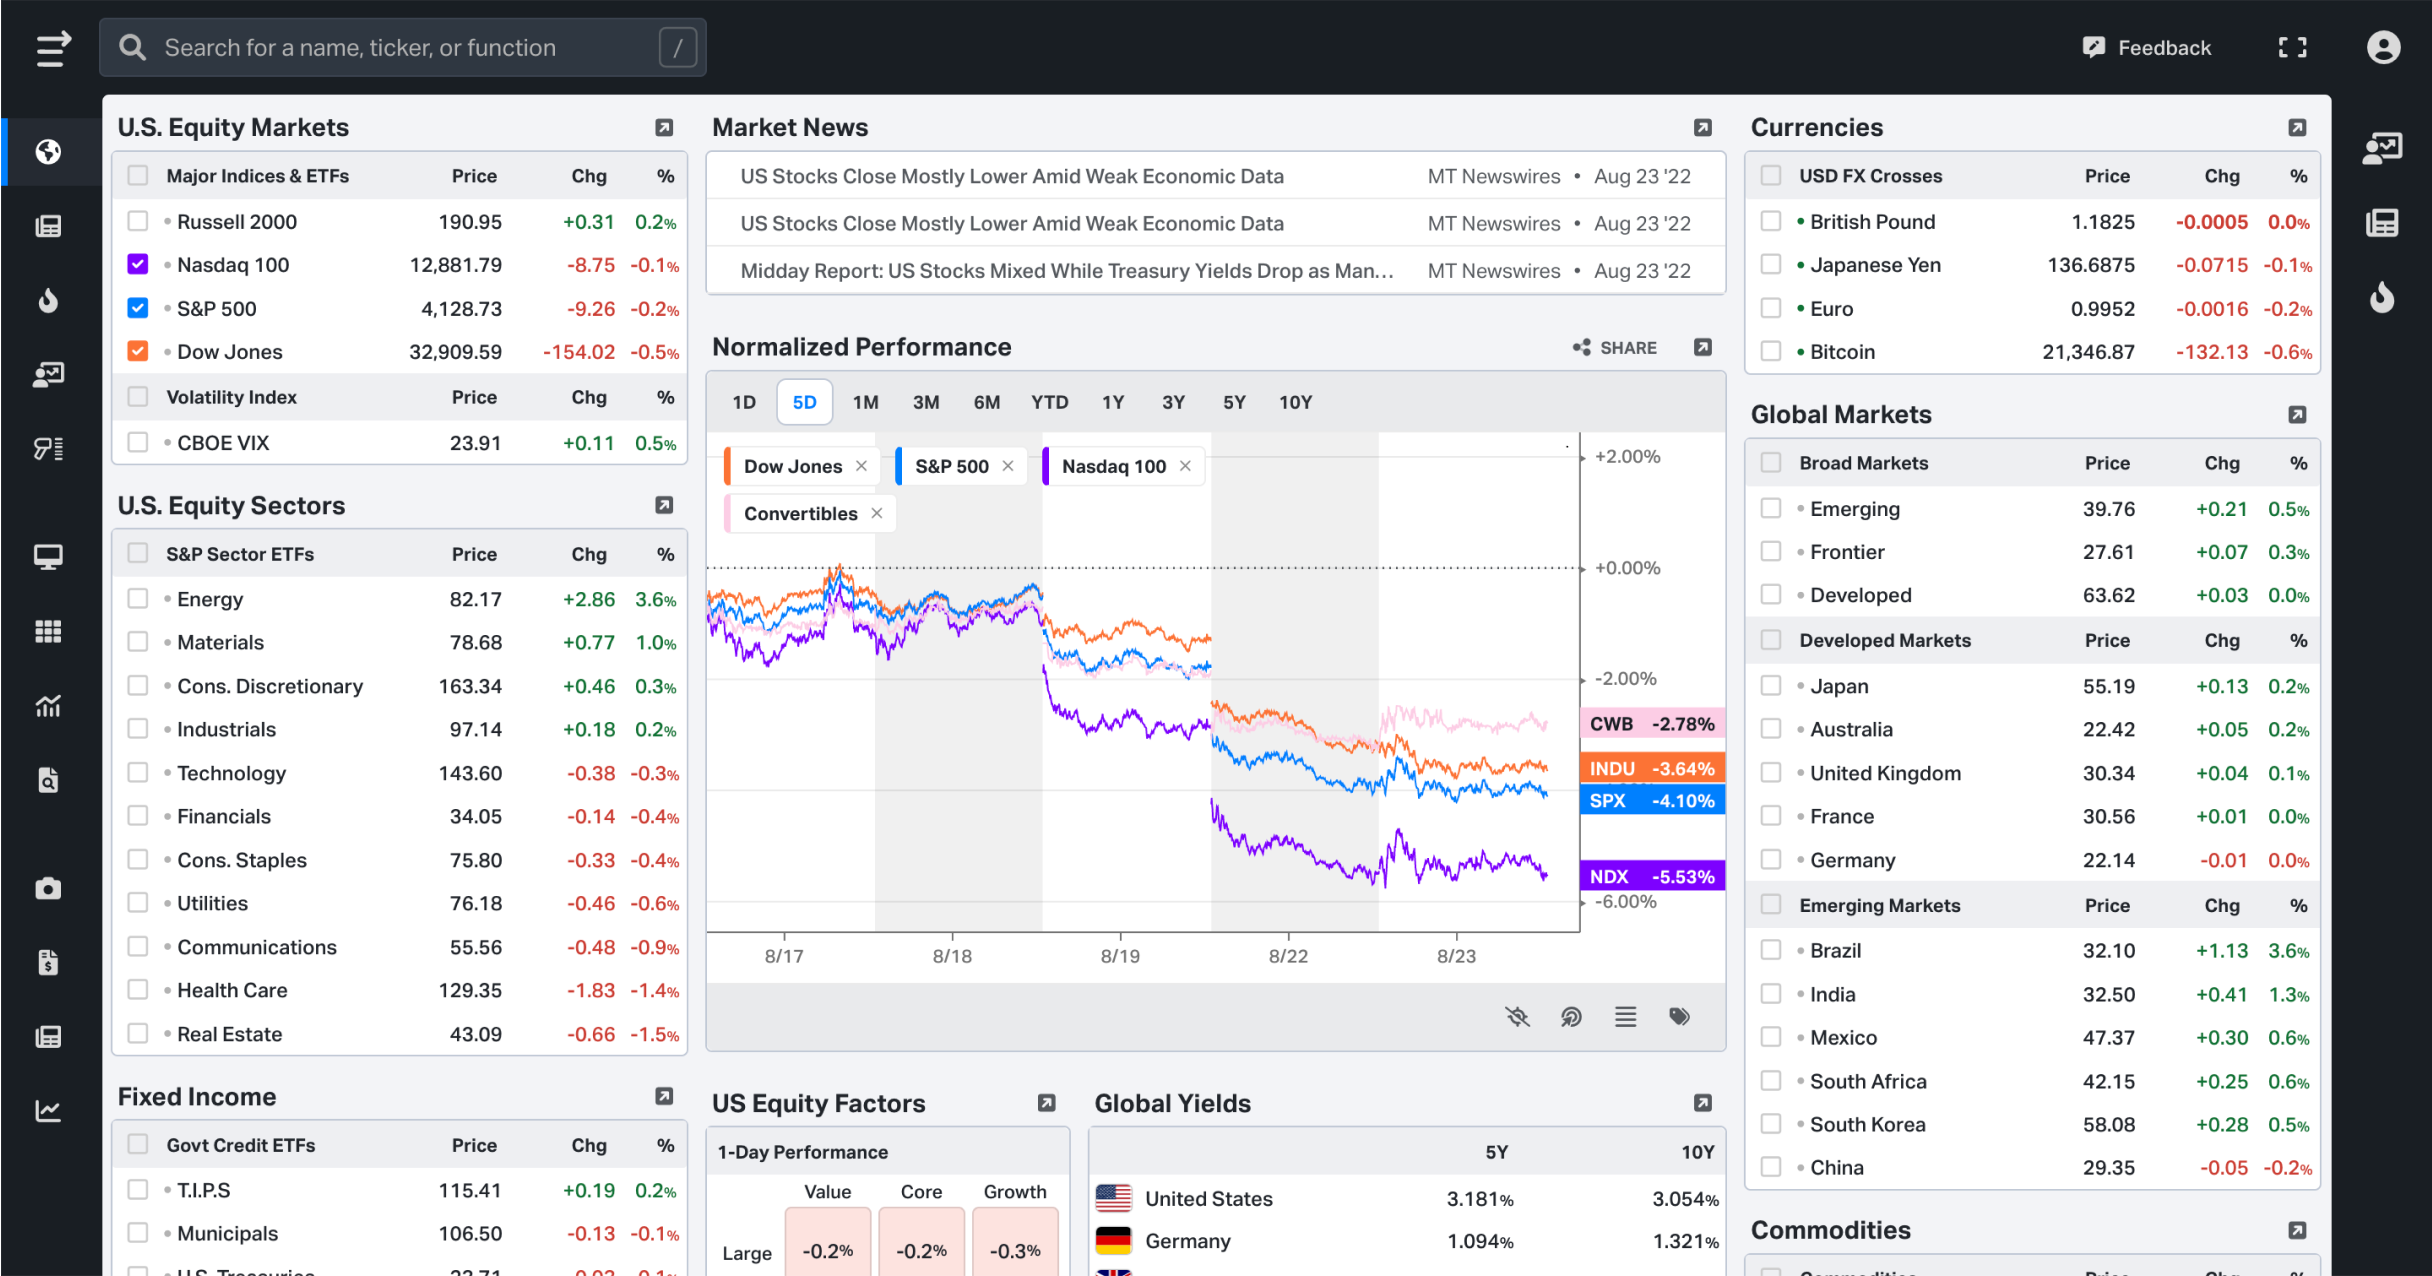
Market dashboards
Advanced charting (G and GM)
Equity screener (EQS)
Custom watchlists and dashboards (LPD)
Economic calendar (ECO)
Top movers (MOV)
ETF and Mutual Fund Holdings (HDS)
Transcripts search
Historical financials and estimates (EE)
User interface
Web-based platform
Intuitive and easy to use
Free tier
Doesn't cost an arm and a leg
No BBG unit needed to sign in
Pricing & Value
Value for money
Free version
Transparent Pricing

In the Kitces Report, users were asked about the value of tools they use relative to their cost. With a value of over 9.5 out of 10, Koyfin was the highest ranked tool by FIAs.

Our plans are clear, offer great value and have no hidden costs. And if you’d like to stay on our Free plan forever, that’s cool with us too. A range of price plans means that you can scale your access as and when you need.
Starting price
$2,250/mo
Bloomberg Terminal is available for an annual cost of $27,660 per user. The pricing decreases to $24,240 per user for firms with 2+ terminals. Please note that each terminal lease lasts for two years, making the total cost for a single terminal $54,000 over that period.
$0/mo
Our Free plan gives you pro-grade analytical tools & live data so that you have everything you need to get started. You can switch to our paid plans any time to unlock our most powerful features.
Get startedOur features are easy to use yet powerful. From advanced graphing to macro dashboards, we have everything you need to identify your next trade right here. Bookmark it now and never look back.
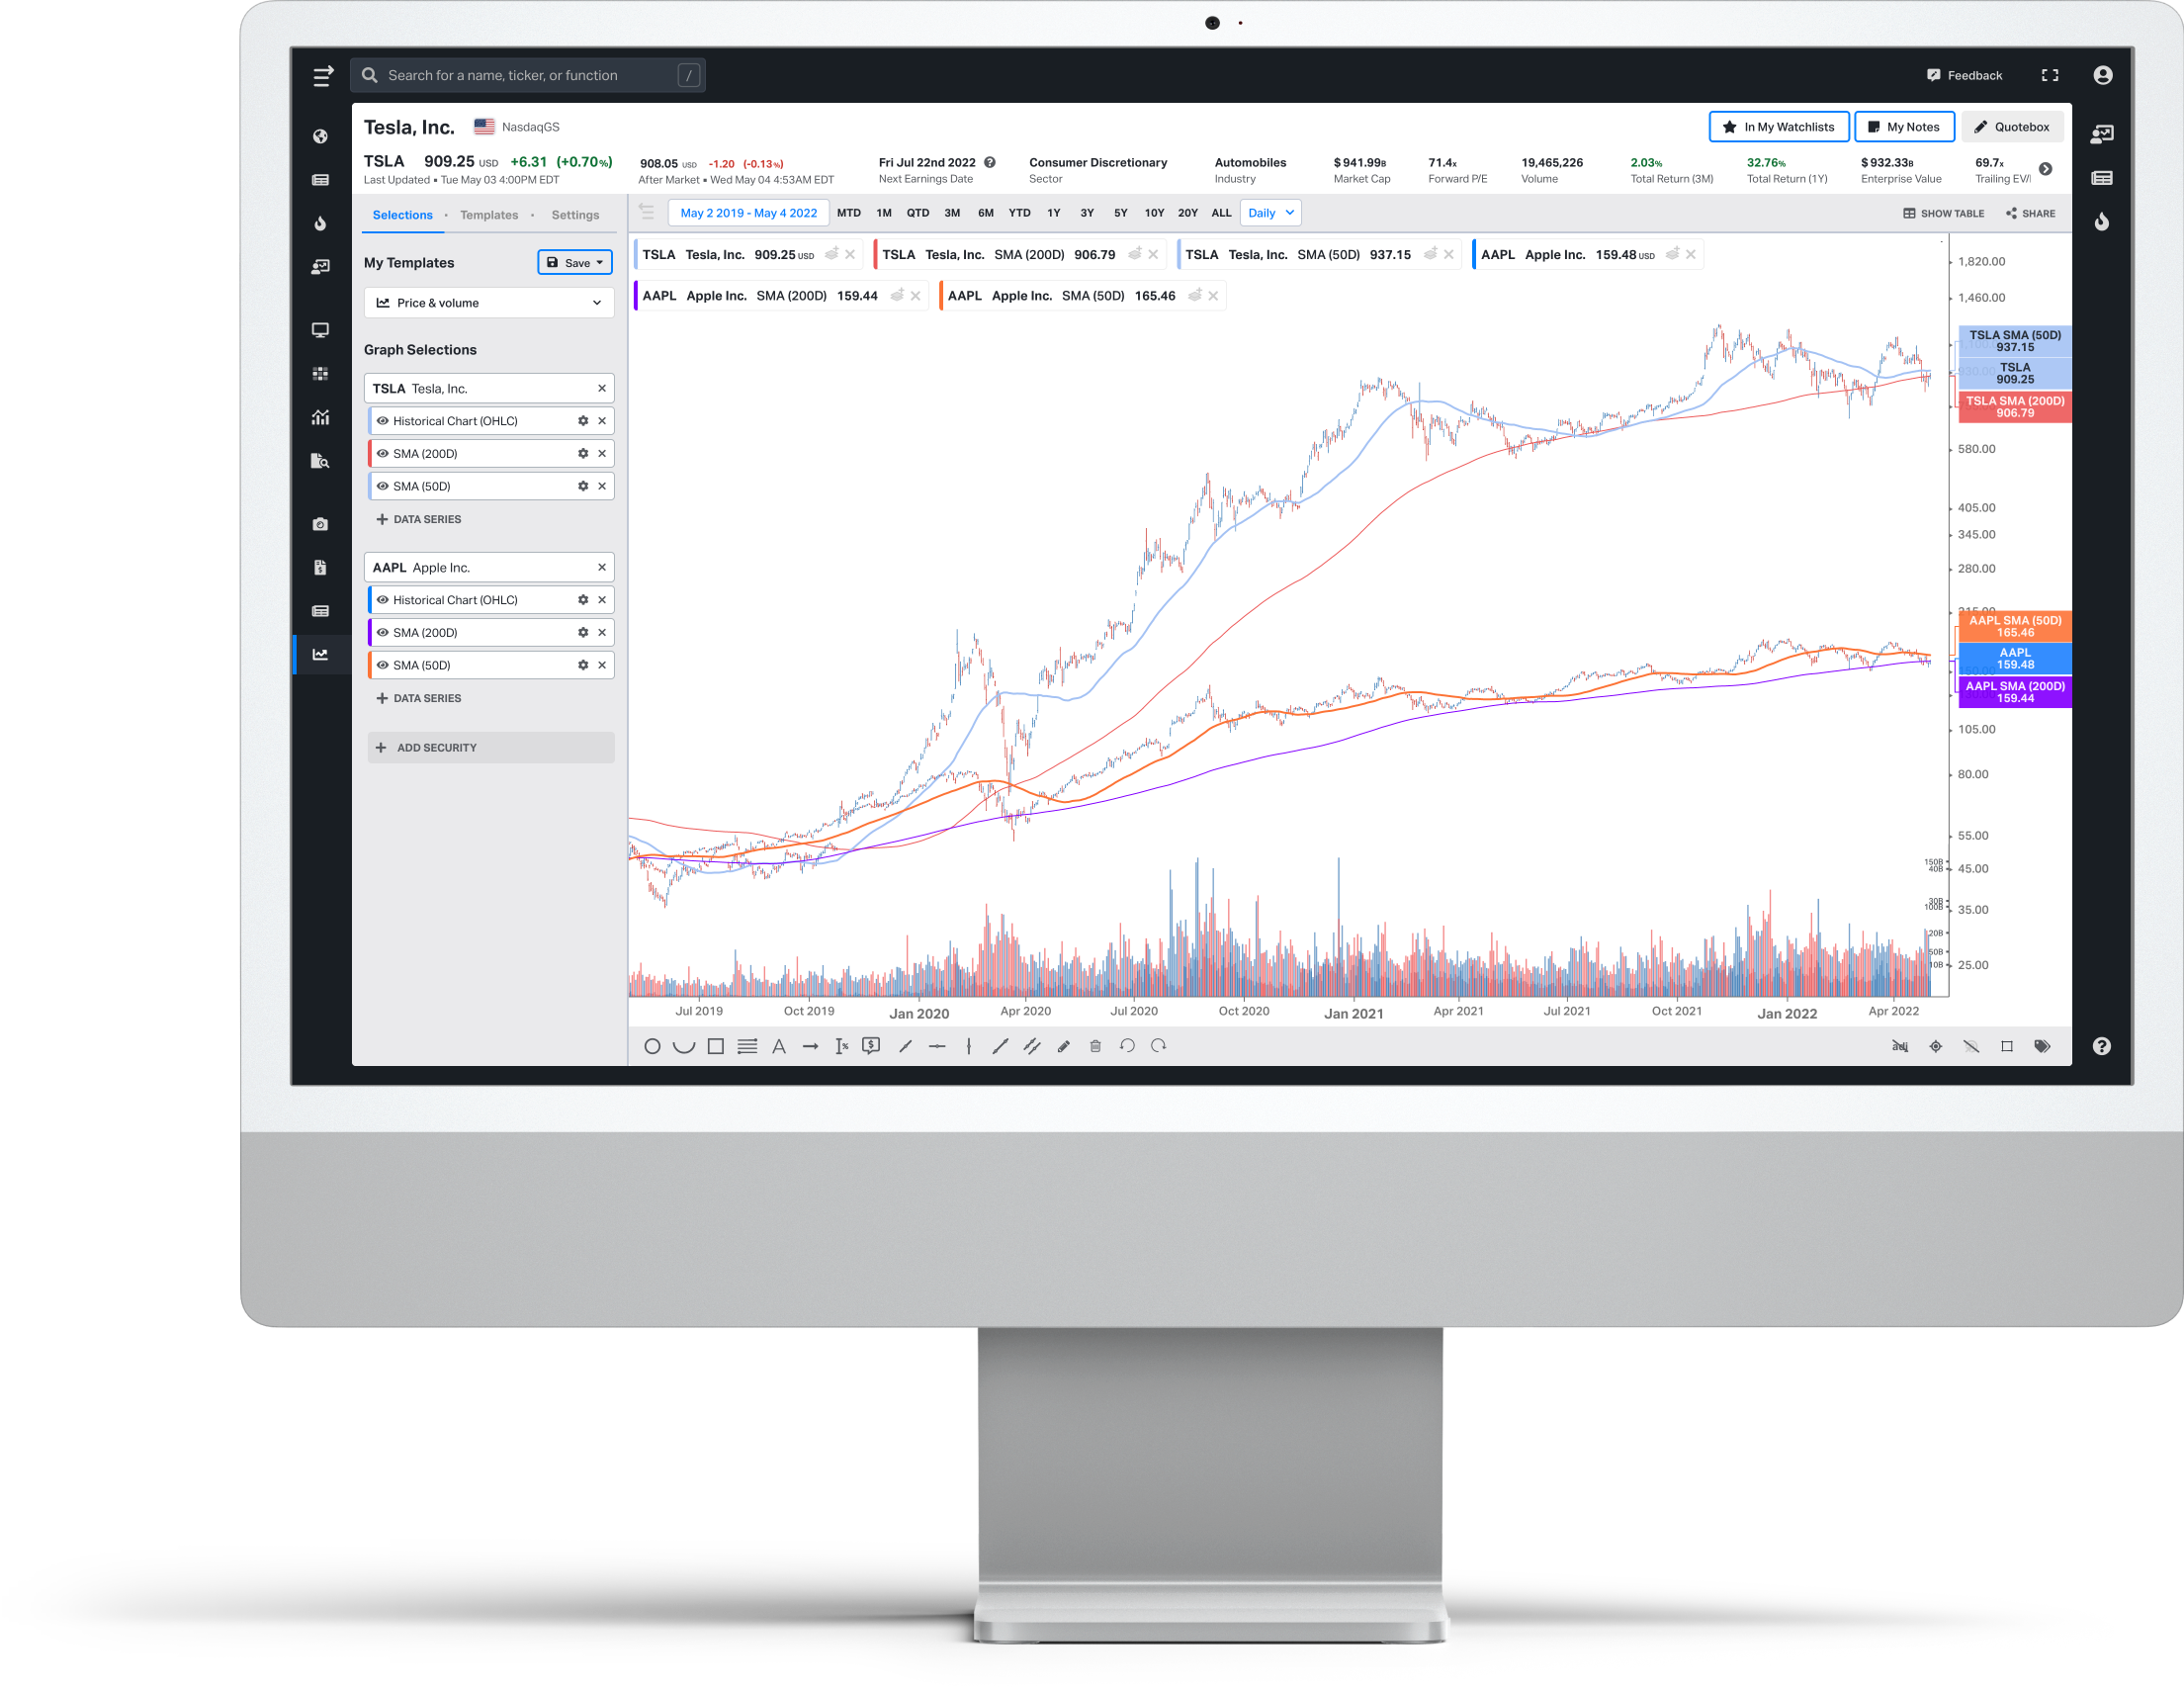
Humans love to visualize. Graphs drive today’s investing. Koyfin’s craft starts with fitting all the world’s data into radiant views. No more clunky interfaces! It’s the look and feel you wished for.
The analysts speak, and the market moves. We help you keep up. Koyfin puts the world’s financial data at your fingertips. When the analysts speak, you can listen in.
What’s your style? Build watchlists that come alive. Shape them to your style or needs. Custom dashboards let you perfect your vision. Focusing on the right data has never been easier.
Macro Dashboards give you our best models for viewing bundled aspects of the financial landscape with just the right contextual detail. Explore and customize at will. Make our insight your own!
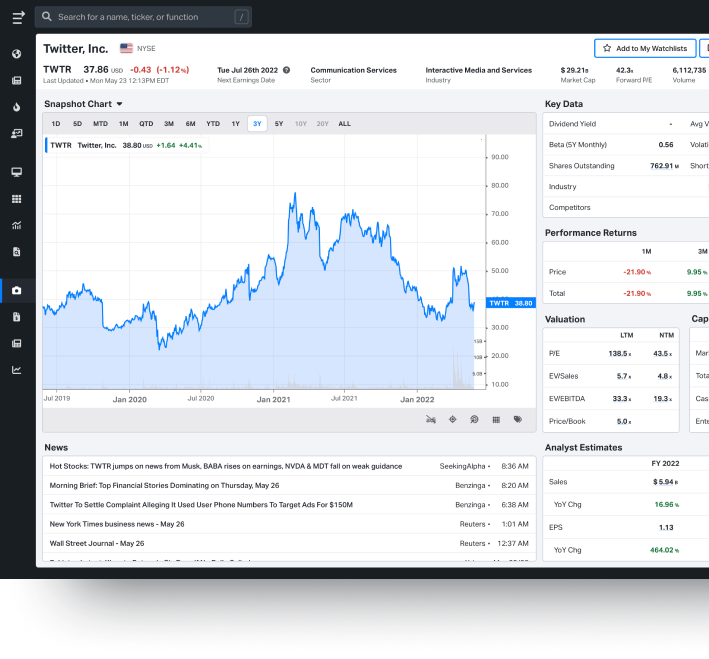
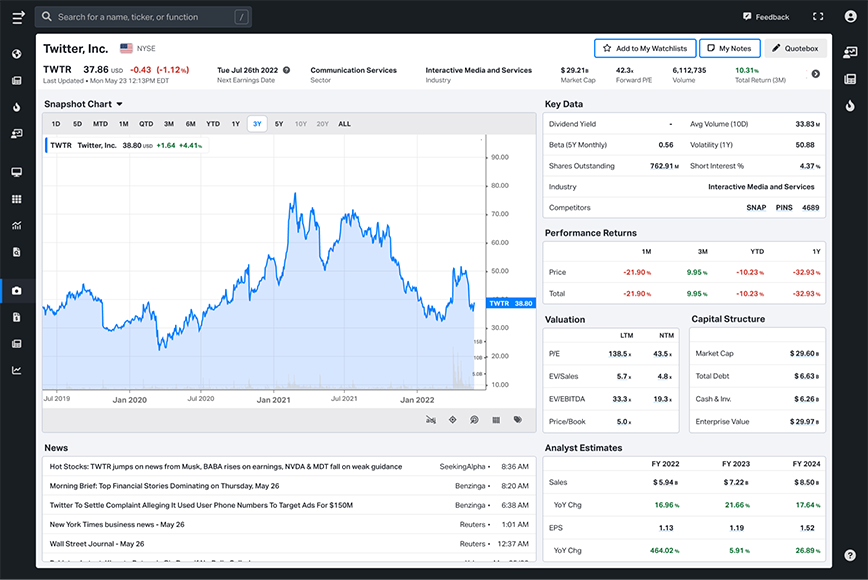
Koyfin gives you access to all the data you need, so you can stay up to date, focus on your investments and identify new opportunities.
Real-time price data, business summary, key analytics metrics, price performance charts, recent news, and earnings estimates.
Track & research all in one place as Koyfin covers all US ETFs including full holdings and constituents.
Easily track and analyze US mutual fund performance vs any security such as stocks, ETFs and other mutual funds.
Research and analyze government bond yields and yield curves, we cover every major country.
Understand which indices are leading and lagging around the world. We cover the major equity indices in each region.
Track and analyze commodities performance using front-month Commodity futures prices.
Easily track the fast-paced currency markets with real-time prices and analyze with our advanced graphing tools.
Stay up to speed on economic indicators from around the globe — track events and graph economic data.
Obtain recent and past earnings reports along with verbatim analyst calls and company conference calls.
We offer streaming news as well as MT Newswires to track the latest in financial markets.
Koyfin provides intraday price data for all US-based closed-end funds as well as performance and financial statements.
Koyfin has short interest data from US exchanges for all US stocks so you can determine the direction of the market.
Information on this page is correct at time of publishing and is subject to change. For up to date information please check Bloomberg
Costing thousands of dollars a month, Bloomberg is out of the question for the majority of retail investors. That’s why thousands of savvy retail and enterprise investors are already using Koyfin to gain an advantage.
Enterprise
Koyfin has been designed to streamline business systems and save you time.

Research Analyst
Get stuck into the numbers with a complete data set and powerful analytical tools as well as company snapshots and financial histories.
Join with the thousands of investors who’ve discovered Koyfin.